Global Dairy UPDATE - Interest.co.nz
←
→
Page content transcription
If your browser does not render page correctly, please read the page content below

JULY 2021

Global Dairy
UPDATE
Our Markets                                                      Our Performance

              • Start of new season in New Zealand. US, EU       • Farmer feedback set to shape revised capital
                and Australia monthly production up.               structure proposal.

              • Australia, New Zealand and US monthly
                exports continue to grow while EU monthly
                exports ease.

              • Increase in imports across China, Asia and
                Latin America. Middle East and Africa monthly    Our Co-op
                imports ease.
                                                                 • Cow manure to fire up the barbecue.

              • Fonterra's New Zealand milk collection
                for the first month of the 2021/22 season
                was 14.6 million kgMS, less than 1% of the
                full season.
              • Fonterra’s Australian collection reached
                105.8 million kgMS for the full 2020/21 season
                to 30 June 2021, a 1.8% decrease compared to
                last season.

Key Dates
31 July 2021                     23 September 2021               December 2021
End of Financial Year 2021       FY21 Annual Results             FCG/FSF Annual Meetings
                                 Announcement

                                                                                                                  1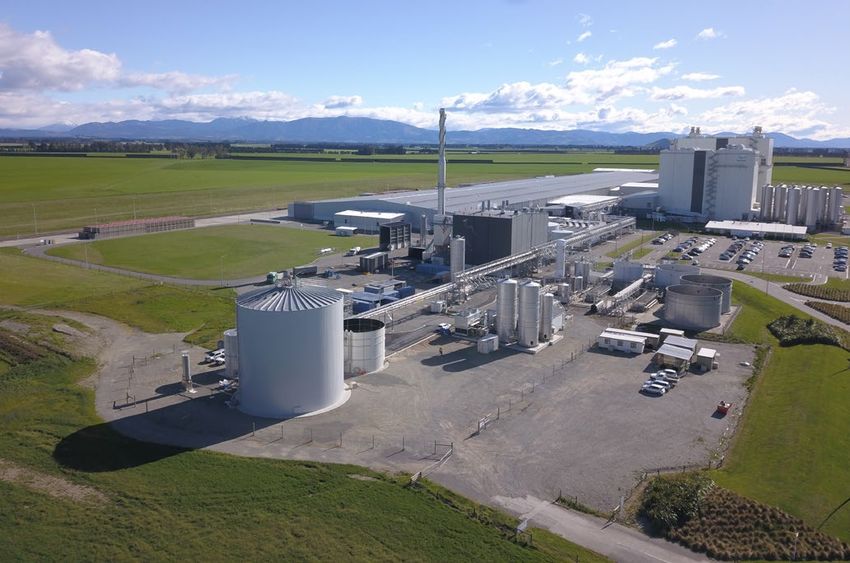
OUR MARKETS
Global Production

                                                  Start of the new season
                                                  in New Zealand. US, EU
                                                  and Australia monthly
                                                  production up
To view a chart that
illustrates year-on-year
changes in production –

      CLICK HERE

NEW ZEALAND                                       AUSTRALIA                        EUROPEAN UNION                  USA

   1.8%
   Change for June 2021
                                                    2.6%
                                                    Change for May 2021
                                                                                     2.3 %
                                                                                     Change for May 2021
                                                                                                                     2.9%
                                                                                                                     Change for June 2021
   compared to June 2020                            compared to May 2020             compared to May 2020            compared to June 2020

   2.6%
   Change for the 12 months to
                                                    1.1 %
                                                    Change for the 12 months
                                                                                     0.4%
                                                                                     Change for the 12 months
                                                                                                                     2.5 %
                                                                                                                     Change for the 12 months
   June 2021                                        to May 2021                      to May 2021                     to June 2021

New Zealand milk                                  Australia milk                   EU milk production²             US milk production
production¹ increased 1.8%                        production increased 2.6%        continued to improve and        increased by 2.9% in June,
on a litres basis, (up 1.6%                       in May compared to May           increased by 2.3% in May        compared to the same
on milk solids basis) in June                     last year.                       compared to the same            period last year.
compared to June last year.                                                        period last year.
                                                  Increasing farmer confidence                                     June production continued
June typically represents
                                                  and good seasonal                Strong volumes were             to grow year on year, albeit
about 1% of the total
                                                  conditions are yet to            observed in Italy, (up 10.6%)   at a slower pace, following
season’s production.
                                                  materialise into significant     on the back of very low         extreme heat in some
New Zealand milk                                  milk growth primarily due to     volumes last year, and          regions. A contraction in
production for the 12 months                      lower herd numbers, farm         increases in Ireland up 6.1%,   herd size was also observed
to June was 2.6% higher than                      exits and labour shortage.       Poland up 1.5% and Spain        following more than 12
last year.                                                                         up 1.0%.                        months of expansion as a
                                                  Dairy Australia is forecasting
                                                                                                                   result of higher input costs.
Fonterra collections are                          milk production to be -1% to     EU milk production for the
reported for June, see page 5                     +1% for the 2020/21 season.      12 months to May was up by      Milk production for the 12
for details.                                                                       0.4% compared to the same       months to June was 2.5%
                                                  Australia milk production for
                                                                                   period last year, driven by     higher compared to the
                                                  the 12 months to May was
                                                                                   higher volumes from Ireland,    same period last year.
                                                  1.1% higher than last year.
                                                                                   Poland, Italy and Sweden.
                                                  Fonterra collections in
                                                  Australia are reported for
                                                  June, see page 5 for details.
1 New Zealand production is measured in litres.
2 Excludes UK.

                                                                                                                                                   2
OUR MARKETS
Global Exports
Australia, New Zealand
and US monthly exports
continue to grow while EU
monthly exports ease
To view a chart that
illustrates year-on-year
changes in exports –
CLICK HERE
NEW ZEALAND AUSTRALIA EUROPEAN UNION USA
19.6%
Change for June 2021
43.6%
Change for May 2021
0.9%
Change for April 2021
10.8%
Change for May 2021
compared to June 2020 compared to May 2020 compared to April 2020 compared to May 2020
4.5%
Change for the 12 months
13.6 %
Change for the 12 months
2.8%
Change for the 12 months
11.9%
Change for the 12 months
to June 2021 to May 2021 to April 2021 to May 2021
Total New Zealand dairy Australia dairy exports EU dairy exports US dairy exports
exports increased 19.6% or increased by 43.6%, or decreased by 0.9%, or increased 10.8%, or
51,642 MT, in June compared 23,398 MT, in May compared 6,030 MT, in April compared 25,097 MT, in May compared
to the same period last year. to the same period last year. to the same period last year. to the same period last year.
The increase was driven by Continued strong demand, April exports saw lower Strong demand for SMP
record volumes of WMP, up primarily from China, in fluid demand for infant formula, from Mexico and Algeria
49,558 MT year-on-year, or milk products, up 5,795 MT, cultured products, SMP and are driving this increase.
45%, to China and South SMP up 5,628 MT, WMP butter. This was partially Shipments to China of
East Asia. up 4,884 MT and cheese, offset by strong volumes whey, SMP and fluid milk
up 1,782 MT are driving of fluid milk products products also strengthened
Exports for the 12 months
this increase. and cheese. in May. Partially offsetting
to June were up by 4.5%, or
this increase was a decrease
153,613 MT, on the previous Exports for the 12 months Exports for the 12 months
in cheese export volumes
comparable period. This was to May were up 13.6%, or to April were up 2.8%, or
of 4,408 MT, or 12%, on the
primarily driven by WMP, 97,546 MT, on the previous 197,726 MT, on the previous
back of rising prices.
fluid milk products and comparable period. comparable period. Fluid
cheese but partially offset milk products, whey, cheese Exports for the 12 months to
This was predominantly
by declines in SMP, AMF and and lactose were the main May 2021 were up 11.9%, or
driven by increases in fluid
infant formula. drivers of this growth, up a 281,232 MT on the previous
milk products, SMP and
combined 364,439 MT. It was comparable period, driven by
butter but partially offset by
partially offset by declines SMP, whey, WPC and cheese,
declines in infant formula.
in SMP, infant formula, MPC up a combined 267,303 MT.
and MPI.
3OUR MARKETS
Global Imports
Increase in imports
across China, Asia and
Latin America. Middle
East and Africa monthly
To view a chart that
illustrates year-on-year
imports ease
changes in imports –
CLICK HERE
LATIN AMERICA ASIA MIDDLE EAST & AFRICA CHINA
3.0 %
Change for April 2021
17.0%
Change for April 2021
0.1%
Change for April 2021
19.7%
Change for June 2021
compared to April 2020 compared to April 2020 compared to April 2020 compared to June 2020
4.3%
Change for the 12 months
2.7%
Change for the 12 months
3.9%
Change for the 12 months
26.1%
Change for the 12 months
to April 2021 to April 2021 to April 2021 to June 2021
Latin America dairy Asia (excluding China) Middle East and Africa China dairy import
import volumes¹ increased dairy import volumes¹ dairy import volumes¹ volumes increased by
3.0%, or 3,831 MT, in April increased 17.0% or decreased 0.1% or 293 MT in 19.7%, or 54,205 MT, in
compared to the same 65,077 MT, in April compared April compared to the same June compared to June
period last year. to the same period last year. period last year. last year and marked a
The increase was driven by The increase was driven The decrease was driven record import month for
stronger volumes across by higher imports across predominantly by lower June as China continues to
most product categories, in most categories. There were volumes of SMP and WMP promote the consumption of
particular, cheese to Mexico higher volumes of SMP to to Nigeria and Algeria but dairy products.
and Chile, WMP to Peru, and the Philippines and Vietnam partially offset by higher Strong volumes of WMP
WPC to Mexico. This was and lactose to Nepal. imports of fluid milk imports continued in June,
partially offset by a large products to Iraq. sourced primarily from
Imports for the 12 months
decrease in SMP to Mexico. New Zealand as well as
to April were up 2.7%, or Imports for the 12 months
Imports for the 12 months 126,250 MT, compared to the Uruguay and Australia.
to April were up 3.9%, or
to April were up 4.3% or same period last year, driven 148,923 MT, compared to Fluid milk products and
75,042 MT compared to the by higher volumes of SMP, the same period last year, SMP also contributed to the
same period last year. lactose and cheese. driven by increases in WMP, import growth.
infant formula and SMP, and Imports for the 12 months
partially offset by declines to June were up 26.1% or
in fluid milk products 843,361 MT, driven by fluid
and butter. milk products, whey, SMP
and WMP.
1 Estimates are included for those countries that have not reported data.
4OUR MARKETS
Fonterra Milk Collection
New Zealand Milk Collection
90
VOLUME (M LITRES/DAY) 75
60
45
30
15
To view a table that shows our
detailed milk collection in New
Zealand and Australia compared 0
JUN JUL AUG SEP OCT NOV DEC JAN FEB MAR APR MAY
to the previous season –
2021/22 2020/21 2019/20
CLICK HERE
NEW ZEALAND NORTH ISLAND SOUTH ISLAND AUSTRALIA
0.9%
Change for June 2021
9.2 %
Change for June 2021
30.1%
Change for June 2021
13.7%
Change for June 2021
compared to June 2020 compared to June 2020 compared to June 2020 compared to June 2020
0.9%
Season to date
9.2%
Season to date
30.1%
Season to date
1.8%
For the 2021/20 Season
1 June to 30 June 1 June to 30 June 1 June to 30 June compared to the previous season
Fonterra's New Zealand North Island milk South Island milk Fonterra's Australia
collection for June was collection in June was collection in June was collection in June was
14.6 million kgMS, 0.9% 12 million kgMS, 9.2% higher 2.6 million kgMS, 30.1% 5.9 million kgMS, a 13.7%
lower than the same month than June last season. behind June last season. decrease on June last season.
last season. Although a large variance
June collections benefitted Farm milk collections were
in percentage terms, South
As is normal for this time of from unseasonably warm reduced as isolated storms
Island volumes are low at
the season, collections for weather. Much needed rain and flooding impacted
this time of the season.
June represent less than 1% was seen by most of the production in Victoria. Third-
of the full season forecast. North Island. The central and lower South party volumes were also
Island saw significant rain in actively reduced.
June and this, coupled with
Full season collections were
frosty mornings, impacted
1.8% down on last season,
milk flows.
with favourable on-farm
conditions throughout
stabilising milk production.
5OUR MARKETS
Fonterra Global Dairy Trade Results
Fonterra GDT results at
last trading event
20 July 2021:
2.2% USD
3,896 21.6000’ MT
Change in Fonterra’s Fonterra’s weighted Fonterra product quantity
weighted average product average product price sold on GDT
price from previous event (USD/MT)
CHEDDAR AMF BUTTER
1.9%
USD 4,022/MT
0.3%
USD 5,615/MT
0.9%
USD 4,419/MT
WMP SMP
3.5%
USD 3,730/MT
5.2%
USD 2,978/MT
Fonterra GDT sales LATEST AUCTION FINANCIAL
by destination: YEAR‑TO‑DATE
NORTH ASIA (INCLUDING CHINA)
SOUTH EAST ASIA
To view more information, MIDDLE EAST AND AFRICA 21,588 667,393
including a snapshot of the MT MT
LATIN AMERICA
rolling year-to-date results –
OTHER
CLICK HERE
The next trading event will be held on 3 August 2021. Visit www.globaldairytrade.info for more information.
Dairy commodity 1,400 0.76
prices and New
Zealand dollar trend 1,250 0.71
The NZD declined towards 69 US
PRICE INDEX
NZD / USD
cents as a global resurgence of
1,100 0.66
COVID-19 infections saw
increased demand for safe haven
assets such as USD; a more 950 0.61
pronounced decline was curtailed
as increasing inflationary
800 0.56
pressures in New Zealand JUL 19 SEP 19 DEC 19 FEB 20 MAY 20 JUL 20 SEP 20 DEC 20 FEB 21 MAY 21 JUL 21
resulted in higher interest rates, GDT PRICE INDEX NZD/USD SPOT RATE
which in turn supported the NZD.
6Our Performance
Farmer feedback set to have also been talking against which we will track share buy-back options
shape revised capital with other groups such as our progress.” might support liquidity in a
the Co-operative Council farmer-only market.
structure proposal (formerly the Shareholders’
McBride says farmers’
views have been varied and • Maintaining the share
Council), the Fonterra
heartfelt, but with some clear maximum at 4x milk
With the first phase of Shareholders’ Fund, the
themes coming through. supply to also help
Fonterra’s capital structure Government, major banks
support liquidity.
consultation now complete, and rural professionals. “We will seek to cater for
the Co-op is drawing up a This engagement the diversity within our “We have also reconsidered
revised proposal that aims to will continue as the ownership base, but it is voting rights in light of some
reflect farmers’ views. consultation progresses. impossible to incorporate feedback and at this stage
every piece of feedback. our preference is for voting
A number of changes are “We would like to thank our
As a Co-op, we need to to continue to follow share-
being considered to the farmer owners for getting
be pragmatic and open to backed supply as it currently
preferred option initially put involved and approaching
compromise in order to does,” adds McBride.
forward in the Consultation the consultation with open
minds,” says McBride. find a way forward together
Booklet in May – including that is in our best long- Next steps for consultation
adjusting the proposed “We also want to term interests.”
minimum shareholding Fonterra is committed to
acknowledge the uncertainty
requirement for farmers A summary of the feedback moving as quickly as it can
that comes along with us
and enabling sharemilkers is available here, while through the capital structure
considering changes to
and contract milkers to a high-level overview review while also taking the
our capital structure and
own shares. of alternative proposals time needed to consider
the significant challenges
submitted by farmers is all views.
“It’s a good time for the that it’s creating for some
farmers. The best way to available here. Over the next couple of
Board to step back and
reflect on the feedback as give certainty is to ensure months, the Co-op plans
we have a full discussion Proposed areas for change to do surveys and hold
most farmers will now be
busy with calving. Once as a Co-op and get to a The Board is considering focus groups to ask farmers
they’ve come through this quality outcome. a number of changes as it specific questions and test
particularly busy time of thinks about what a final different aspects of the
“The Board maintains
the season, we’ll be ready proposal could look like. potential changes.
its belief that, in a flat or
to consult on the updated potentially declining milk These include: “This will help us as we
proposal,” says Chairman environment, making continue to develop a
Peter McBride. • Setting the minimum
changes early will put us more detailed proposal to
shareholding requirement
Consultation has been in the best position to present to farmers around
at 33% of milk supply (or
extensive to date, provide farmers with more the time of our annual
1 share per 3 kgMS), rather
starting with the initial flexibility while protecting results in late September for
than 25% (or 1 share per
communication on 6 May farmer ownership and further consultation. At this
4 kgMS) as originally set
and the Consultation Booklet strengthening our Co-op’s stage, we are still aiming for
out in the preferred option.
being sent to every farmer financial sustainability.” a farmer vote at our Annual
owner. Since then: • Enabling sharemilkers Meeting, which will be
Summary of farmer and contract milkers to held in December.”
• Directors have held 90 feedback hold shares if the Co-op
farmer meetings, attended moved permanently to a
Many farmers said that
events such as the My farmer‑only market.
additional information For further information –
Connect conference on the Co-op’s business • Extending the entry time-
and Field Days as well strategy and future frame from five to six years.
as leading seven online
webinars and speaking with
performance would help
• Extending exit time-frames CLICK HERE
them form a clearer view on
many farmers directly. for all farmer owners on the
capital structure.
date of the vote to up to 10
• Over 5,000 farmers have “In August and September, or 15 years, including those
directly engaged through we will provide further who have already ceased
feedback channels, in information on our long- in the past few seasons but
addition to discussing the term strategy including the who still hold shares.
options with each other. types of activities we will
• Reviewing the market
• Members of Fonterra’s invest in, the returns we are
maker role and looking
Board and management targeting, and the measures
further at how potential
7Our Co-op
Cow manure to fire up A study between Fonterra,
the barbecue Beca, Firstgas Group and
EECA has found using
organic waste is a viable,
untapped solution to
provide an alternative to
New Zealand’s current
residential gas supplies,
with the potential to replace
nearly 20% of the country’s
total gas usage by 2050.
Biogas is created by
anaerobic digestion, where
bacteria breaks down organic
matter (such as food waste Biodigester at Fonterra’s Darfield site
or cow manure) to create a
gas, which, once cleaned, can 2050 “We’re committed to of 28 currently use coal, with
be used in existing pipeline playing our part to help the Te Awamutu being converted
networks, appliances and country transition to a low to wood pellets last season
equipment, while saving up carbon future. to reduce Fonterra’s coal
to 19 times the emissions. use by around 10 per cent,
“We know the more
the equivalent of taking
Fonterra already has alternative energy sources
32,000 cars off the road.
biodigesters at its Tirau we have, the faster we will
and Darfield sites where be able to transition our
bugs work to process fats manufacturing operations
and proteins in wastewater, onto renewable energy
cleaning the wastewater and sources and off coal. This
creating a gas. As well as study is a good example
creating a gas there’s also a of how government and
nutrient dense product that industry can work together To read the Executive
can be spread to paddocks – sharing science, expertise Summary –
and crops as fertiliser. and experience – we can find
solutions for the good of CLICK HERE
Fonterra Head of Energy
New Zealand.”
and Climate, Linda Mulvihill
says the study provides The Co-op recently To read the full study –
another potential option to committed to getting out
help the Co-operative get of coal at its manufacturing
to net zero emissions by sites by 2037. Nine sites out CLICK HERE
8Supplementary Information
Global Dairy Market PRODUCTION
The charts on the right 800
illustrate the year-on-year
600
changes in imports, exports
and production for a range of 400
LIQUID MILK (M LITRES)
countries that are important
players in global dairy trade. 200
The absolute size of 0
the bars represents the
change in imports, exports -200
or production, relative
-400
to the same period the
previous year. -600
JUL 20 AUG 20 SEP 20 OCT 20 NOV 20 DEC 20 JAN 21 FEB 21 MAR 21 APR 21 MAY 21 JUN 21
Averages are shown where
NEW ZEALAND EU UNITED STATES AUSTRALIA AVERAGE
data is complete for the
regions presented. NOTE: Data for EU and Australia to May; New Zealand and US to June.
BACK TO SUMMARY EXPORTS
200
160
120
MT (000s)
80
40
0
-40
-80
JUL 20 AUG 20 SEP 20 OCT 20 NOV 20 DEC 20 JAN 21 FEB 21 MAR 21 APR 21 MAY 21 JUN 21
NEW ZEALAND EU UNITED STATES AUSTRALIA AVERAGE
BACK TO SUMMARY NOTE: Data for EU to April; US and Australia to May; New Zealand to June.
IMPORTS
300
240
180
MT (000s)
120
60
0
-60
JUL 20 AUG 20 SEP 20 OCT 20 NOV 20 DEC 20 JAN 21 FEB 21 MAR 21 APR 21 MAY 21 JUN 21
ASIA CHINA MIDDLE EAST & AFRICA LATIN AMERICA AVERAGE
NOTE: Data for Asia, Middle East & Africa and Latin America to April; China to June.
BACK TO SUMMARY
SOURCE: Government milk production statistics/GTIS trade data/Fonterra analysis.
9Supplementary Information
Fonterra milk MILK COLLECTION JUNE JUNE MONTHLY SEASON- SEASON- SEASON-
(MILLION KGMS) 2021 2020 CHANGE TO-DATE TO-DATE TO-DATE
production 2021/22 2020/21 CHANGE
The table on the right
Total Fonterra 14.6 14.8 (0.9%) 14.6 14.8 (0.9%)
shows Fonterra milk solids
New Zealand
collected in New Zealand
and Australia compared North Island 12.0 11.0 9.2% 12.0 11.0 9.2%
to the previous season.
South Island 2.6 3.8 (30.1%) 2.6 3.8 (30.1%)
BACK TO SUMMARY
MILK COLLECTION JUNE JUNE MONTHLY SEASON- SEASON- SEASON-
(MILLION KGMS) 2021 2020 CHANGE TO-DATE TO-DATE TO-DATE
2020/21 2019/20 CHANGE
Australia 5.9 6.8 (13.7%) 105.8 107.8 (1.8%)
Fonterra GDT results LAST TRADING EVENT YEAR-TO-DATE
(20 JULY 2021) (FROM 1 AUGUST 2020)
This table provides more
information on the latest Quantity Sold on GDT 21,588 667,393
results, including a snapshot (Winning MT)
of the year-to-date results.
Change in Quantity Sold on GDT (7.3%) (3.0%)
over same period last year
Weighted Average Product Price 3,896 3,562
(USD/MT)
Change in Weighted Average 20.5% 9.0%
Product Price over same period
last year
Change in Weighted Average (2.2%) –
Product Price from previous event
Fonterra GDT results 4,500 39,000
WEIGHTED AVERAGE PRICE (USD/MT)
This chart shows Fonterra
GDT prices and volumes over 4,100 34,000
QUANTITY SOLD ( MT)
the past 12 months.
3,700 29,000
3,300 24,000
BACK TO SUMMARY 2,900 19,000
2,500 14,000
AUG 20 SEP 20 OCT 20 NOV 20 DEC 20 JAN 21 FEB 21 MAR 21 APR 21 MAY 21 JUN 21 JUL 21
WEIGHTED AVERAGE PRICE QUANTITY SOLD
10Glossary
AMENA kgMS Season
Africa, Middle East, Europe, Kilogram of milk solids, the New Zealand: A period
North Asia, Americas. measure of the amount of of 12 months to 31 May
fat and protein in the milk in each year.
AMF supplied to Fonterra.
Australia: A period of
Anhydrous Milk Fat.
MPC 12 months to 30 June
BMP in each year.
Milk Protein Concentrate.
Butter Milk Powder. SMP
Non-Reference Products
DIRA Skim Milk Powder.
All dairy products, except
Dairy Industry Restructuring for Reference Products, WMP
Act 2001 (New Zealand). produced by the NZ
Whole Milk Powder.
Ingredients business.
Farmgate Milk Price WPC
The price for milk supplied in
NZMP
Whey Protein Concentrate
New Zealand to Fonterra by New Zealand Milk Products.
farmer shareholders.
Reference Products
Fluid Products The dairy products used
The Fonterra grouping in the calculation of the
of fluid milk products Farmgate Milk Price, which
(skim milk, whole milk are currently WMP, SMP,
and cream – pasteurised BMP, butter and AMF.
or UHT processed),
concentrated milk products
(evaporated milk and
sweetened condensed milk)
and yoghurt.
GDT
Global Dairy Trade, the
online provider of the twice
monthly global auctions of
dairy ingredients.
11You can also read