Global Patterns of Coastal Cephalopod Diversity Under Climate Change
←
→
Page content transcription
If your browser does not render page correctly, please read the page content below
ORIGINAL RESEARCH
                                                                                                                                           published: 28 January 2022
                                                                                                                                     doi: 10.3389/fmars.2021.740781

                                            Global Patterns of Coastal
                                            Cephalopod Diversity Under Climate
                                            Change
                                            Joana Boavida-Portugal 1,2* , François Guilhaumon 3 , Rui Rosa 4,5 and Miguel B. Araújo 1,6
                                            1
                                              “Rui Nabeiro” Biodiversity Chair, MED Institute, University of Évora, Évora, Portugal, 2 MARE – Marine and Environmental
                                            Sciences Centre, University of Évora, Évora, Portugal, 3 IRD, UMR 5119, University of Montpellier 2, Montpellier, France,
                                            4
                                              MARE – Marine and Environmental Sciences Centre, Laboratório Marítimo da Guia, Faculdade de Ciências da Universidade
                                            de Lisboa, Lisboa, Portugal, 5 Departamento de Biologia Animal, Faculdade de Ciências da Universidade de Lisboa, Lisboa,
                                            Portugal, 6 Department of Biogeography and Global Change, National Museum of Natural Sciences, CSIC, Madrid, Spain

                                            Coastal marine ecosystems are currently being exposed to climate change at a much
                                            faster rate than many other ecosystems, with coastal species being exposed to multiple
                                            stressors. Cephalopod mollusks play a pivotal role in marine trophic webs, and most
                                            are “keystone” species due to their influence on ecosystem dynamics. In this study,
                                            we characterized the global patterns of coastal cephalopod diversity and present, for
                                            the first time, a global forecast of potential changes in richness, mean body size, and
                                            assemblage composition (i.e., species replacement, nestedness, and combinations of
                                            both) for 161 coastal cephalopod species under climate change, using an ensemble of
                                            ecological niche models (ENMs) for an end of the century mitigation scenario. We have
                           Edited by:       shown that, for the baseline period, coastal cephalopod diversity is higher in the Central
        Tito Monteiro da Cruz Lotufo,
                                            Indo-Pacific area and that body size patterns follow the temperature-size rule, with larger
        University of São Paulo, Brazil
                                            animals occurring at higher latitudes. The end-century projections of habitat suitability
                       Reviewed by:
                    Elaina Jorgensen,       show a different picture, with 96% of cephalopod species predicted to experience
      NOAA Alaska Fisheries Science         range contraction and 15% completely losing their environmental space. Nestedness
               Center, United States
                     Jarno Vanhatalo,
                                            is projected to be the main effect of species compositional change. Maximum body size
        University of Helsinki, Finland     is projected to increase in 44% of the pixels and decrease in 37%. Regarding fisheries,
                 *Correspondence:           the projected changes are more favorable to the countries at higher latitudes, although
              Joana Boavida-Portugal
                                            the search for refugia of smaller tropical species might potentially lead to a mitigation of
                      jbp@uevora.pt
                                            the negative effects of climate change in these areas, as measured by the total capture
                  Specialty section:        (ton). While the model has limitations, our findings reflect major climatic drivers of change
        This article was submitted to
                                            and highlight the idea that even though cephalopod species seem good candidates to
        Marine Evolutionary Biology,
 Biogeography and Species Diversity,        replace overexploited fish stocks in the near future, they may not have the environmental
              a section of the journal      space to do so.
         Frontiers in Marine Science
           Received: 13 July 2021           Keywords: climate change, cuttlefish, squid, octopus, body size, ecological niche models (ENMs), ensemble
                                            forecast, species temporal turnover
      Accepted: 16 November 2021
       Published: 28 January 2022
                             Citation:
                  Boavida-Portugal J,
                                            INTRODUCTION
Guilhaumon F, Rosa R and Araújo MB
     (2022) Global Patterns of Coastal
                                            Climate change scenarios predict global sea surface temperature (SST) to rise throughout the 21st
 Cephalopod Diversity Under Climate         century (IPCC, 2013), and marine biota is expected to respond to this warming trend by shifting
  Change. Front. Mar. Sci. 8:740781.        their geographical (Pinsky et al., 2013; Jones and Cheung, 2014) and bathymetric ranges (Dulvy
     doi: 10.3389/fmars.2021.740781         et al., 2008). Coastal marine systems are currently exposed to warming at a much faster rate than

Frontiers in Marine Science | www.frontiersin.org                                 1                                          January 2022 | Volume 8 | Article 740781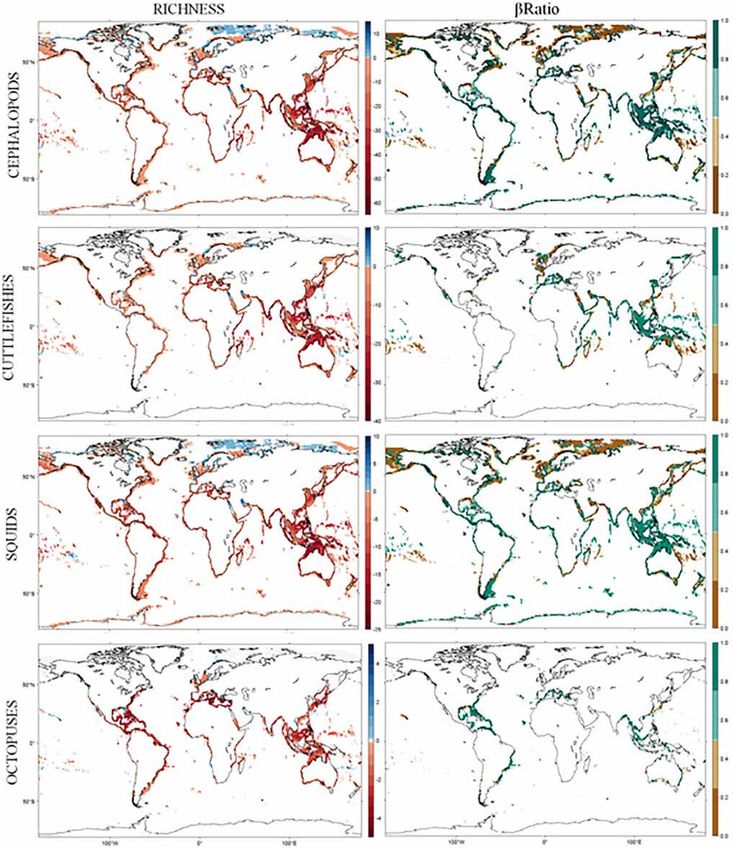
Boavida-Portugal et al.                                                                                                 Cephalopod Under Climate Change

many other ecosystems (Harley et al., 2006) and as several species               mapping strategy to picture simultaneously the spatiotemporal
already live close to their thermal tolerance limits (Rosa et al.,               trend of both processes.
2014), an increase in extinction rates of many marine organisms                     Beyond species composition, another important issue is
is expected (Lasram et al., 2010).                                               how to account for functional and phenotypic differences in
    Cephalopods are known to play an important ecological                        multispecies assemblages. Quantifying the distribution of traits
role in marine trophic webs (both as prey and as predators),                     in a community or the relative magnitude of species similarities
and many species are commonly defined as “keystone” species                      can give us a good measure of the assemblage functional
due to their strong influence on ecosystem dynamics (Rosa                        diversity (Cadotte et al., 2011). Body size is considered a
et al., 2013a,b). Thus, changes in cephalopod abundance can                      fundamental species trait and a good indicator of ecosystem
have a mixed impact on marine communities and fisheries,                         functioning due to its relationship to several functional traits
contributing to changes in their predators and prey abundance                    such as growth, reproduction, and mortality (Brown et al.,
(André et al., 2010). In addition, given their short life spans                  2004). Also, the body size is an easy and cheap way to
and rapid growth rates, cephalopods are expected to respond                      translate several covarying traits into a single one (Woodward
faster than other marine species to changes in environmental                     et al., 2005). Commercial fishing is known to constrain the
conditions, making them good indicators of environmental                         body size distributions of marine populations, as most fishing
change (Pierce et al., 2010). It is also important to note that                  gear is size-selective and preferentially targets large-bodied
these mollusks are a significantly growing component of global                   organisms (Myers and Worm, 2003). The increased temperatures
fisheries, with landings increasing steadily from the 1950s to                   associated with climate change are expected to disrupt large-
reach about four million tons annually over the last decade                      scale patterns in body size distributions (Sheridan and Bickford,
(Doubleday et al., 2016).                                                        2011; Cheung et al., 2012) and ecosystem functioning (Fisher
    The productivity of marine fisheries is likely to be affected                et al., 2010). Still, the effect of climate change on marine
by the alteration of ocean conditions such as water temperature,                 populations is less studied than the effects of fishing, so the
ocean currents, and coastal upwelling, as a result of climate                    large-scale projections of climate-mediated changes in body size
change (e.g., IPCC, 2014; Lam et al., 2016). Such changes in ocean               distribution are urgent.
conditions may affect primary productivity, species distribution,                   In this study, we provided the first forecast of global changes
community, and food web structure, which have direct and                         in coastal cephalopod species richness under projected climate
indirect impacts on the goods and services provided by marine                    change. Using an ensemble of ecological niche models (ENMs)
ecosystems, which will have direct implication for the welfare of                (Diniz-Filho et al., 2009), we projected changes in habitat
human society (FAO, 2018).                                                       suitability for 161 coastal cephalopod species to an end-century
    A central question in studies exploring the effects of climate               stabilization scenario. We then examined how spatial and
change on biodiversity is how will changes be measured and                       temporal components of coastal cephalopod assemblage diversity
characterized. We assumed that species respond individually to                   are projected to change toward the end of the century. Finally, we
environmental changes and model distributions of individual                      inferred the potential effects on body size distributions and their
species one at a time (Guisan and Thuiller, 2005) or that                        potential impacts in global cephalopod fisheries.
the distribution of species can potentially be influenced by
the distribution of other taxa, using community-level modeling
strategies instead (Gotelli et al., 2010). Beta diversity describes the          MATERIALS AND METHODS
extent of compositional change in the community between sites
and also helps to reveal the assembly mechanisms that drive these                Species and Climate Data
differences (Bishop et al., 2015). Most studies examine species                  We obtained polygons of the extent of occurrence (range filling)
temporal turnover (STT) (Hillebrand et al., 2010; Poloczanska                    for 161 coastal cephalopod species (79 cuttlefishes, 71 squids, and
et al., 2013; Cheung et al., 2015; Pecl et al., 2017; Lotze et al., 2019),       11 octopus species; refer to the list of species in Supplementary
but frameworks exist to assess changes in species turnover both                  Table 1) from the Food and Agriculture Organization of the
in time and space (Almeida-Neto et al., 2011; Baselga, 2012). STT                United Nations (FAO) (Jereb and Roper, 2005, 2010; Jereb
is a widely used metric to assess these changes in composition                   et al., 2016) and converted them to presence point data in a
(e.g., Almeida-Neto et al., 2011; Baselga, 2012); however, as a                  1◦ ×1◦ latitude/longitude grid using ArcGIS (ESRI, 2006). We
measure of beta diversity equivalent to the Jaccard’s dissimilarity              found limitations in the number of octopus species available
index (Anderson et al., 2011), it mixes two components in                        to use in this study, as there were several important species
one metric: changes in assemblage composition caused by a                        (especially in the Southern Ocean) that were not included, due
process of species loss or gain (i.e., the nestedness component                  to the lack of accurate distribution information. Also, from a
of beta diversity) and changes in assemblage composition caused                  methodological point of view, we decided to restrict our analyses
by a process of species replacement (i.e., the pure turnover                     to the continental shelf (200-m depth limit), as we assumed that
component of beta diversity). Following the study by Baselga                     surface conditions provided by the climatic models were not
(2010, 2012), Albouy et al. (2012a) proposed a strategy to fully                 maintained at deeper depths. In addition, species associated with,
comprehend the potential effects of climate change on species                    but not restricted to, the continental shelf are more likely to be
assemblages by analyzing changes in species richness and changes                 affected by climate change (Rosa et al., 2012b). To avoid statistical
in species composition together and highlighted a bivariate                      bias in ENM fitting, 5 species were excluded from the analyses,

Frontiers in Marine Science | www.frontiersin.org                            2                                     January 2022 | Volume 8 | Article 740781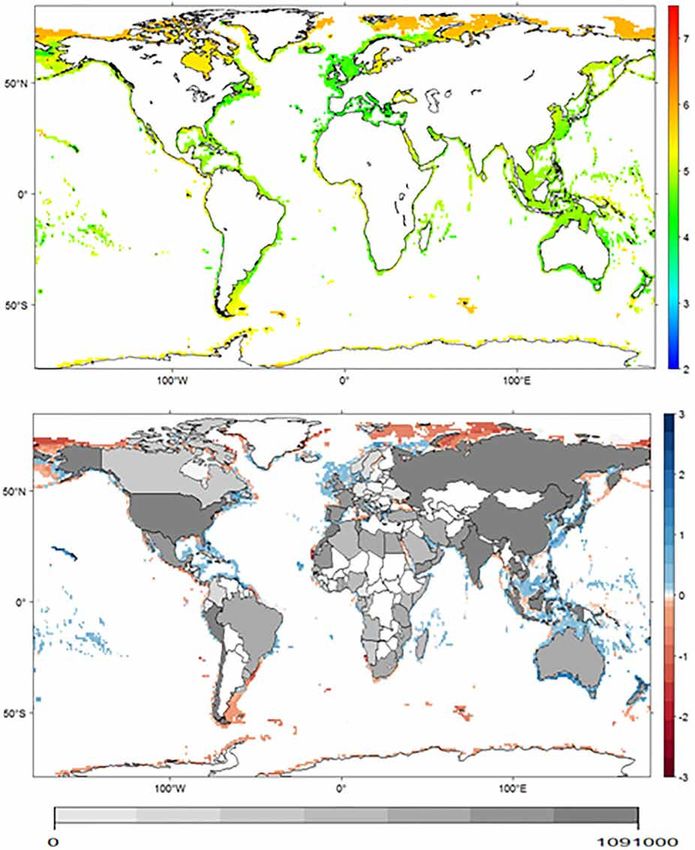
Boavida-Portugal et al.                                                                                           Cephalopod Under Climate Change

corresponding to those with fewer than 20 record points over the             Ecological Niche Models
study area (Wisz et al., 2008).                                              To constrain algorithmic uncertainty associated with ENMs,
    The patterns of marine species distribution are strongly                 we implemented an ensemble forecasting method (Araújo and
influenced by bathymetry (Dambach and Roedder, 2011), so to                  New, 2007). Models were fitted using seven different modeling
reduce false positives in the presence data, we refined the extent of        techniques implemented in BioEnsembles (Diniz-Filho et al.,
occurrence maps by clipping off areas with depths falling outside            2009): (1) BIOCLIM, (2) Genetic Algorithm for Rule-Set
the bathymetric range of the species (Jereb and Roper, 2005,                 Prediction (GARP), (3) Generalized Linear Model (GLM), (4)
2010). The bathymetry of the ocean was obtained from ETOPO2                  Generalized Additive Model (GAM), (5) Multivariate Adaptive
(2010) and resampled to a 1◦ ×1◦ latitude/longitude grid.                    Regression Splines (MARS), (6) Maximum Entropy (MaxEnt),
    We used 30-year averages of 5 climate variables (i.e., SST, sea          and (7) Neural Network (NNET).
surface salinity, total chlorophyll mass concentration at surface,               For each species, data were randomly partitioned into
dissolved oxygen concentration at surface, and ocean surface pH)             calibration (75%) and validation (25%) dataset, the procedure
from Earth System Models (ESM) developed for coupled model                   was repeated five times, maintaining the observed prevalence
intercomparison project - phase 5 (CMIP5). There were 21 ESMs                of species in each partition, and models for each species were
from 15 climate centers in 9 countries that modeled at least one of          fit and evaluated using the True Skill Statistic (TSS) (Allouche
the variables analyzed (Supplementary Table 2). For each model               et al., 2006). The TSS is defined as sensitivity + specificity
and variable, we used the period 1976–2005 from the historical               −1 and ranges from −1 to +1, where +1 indicates perfect
experiment, to establish the baseline period, and the period 2071–           agreement, and values of zero or less indicate a performance
2100, to define our future scenarios. A stabilization scenario               no better than random. It is a simple and intuitive alternative
was used in this study (Representative Concentration Pathway,                to area under the curve (AUC) in measuring the accuracy of
RCP4.5), with CO2 concentrations projected to increase up to                 species distribution models (Shabani et al., 2018). Randomly
650 ppm by 2100 (Vuuren et al., 2011). This scenario was chosen              selected pseudo-absence locations from the background data
as it is the one that projected the rise in surface temperature by the       were used with equal weighting for presences to maintain
end-century closer to the +1.5◦ C increase targeted by the Paris             prevalence (Barbet-Massin et al., 2012). Numerous techniques
Agreement (United Nations, 2016), so we considered it the most               for pseudo-absence selection have been developed over the
realistic at present.                                                        years, and the reports of their effectiveness vary. In this study,
    Climate data were publicly available from the World Climate              we used an ensemble of seven different algorithms, which
Research Programme (WCRP).1 SST and surface seawater salinity                have different theoretical approaches and data requirements,
have monthly frequency while the other three variables have                  so random pseudo-absences are interpreted as real absences,
annual data. We only extracted the first layer (i.e., surface)               pseudo-absences, or background depending on the algorithm.
for chlorophyll, dissolved oxygen, and pH. All variables were                This is a simple and widely used approach in ENM studies, but
interpolated into a common 1◦ ×1◦ grid prior to calculating                  methods that include environmental profiling in a previous step
multi-model means (for more on the methods and uncertainty                   have been receiving positive feedbacks (e.g., Senay et al., 2013;
associated with the ensemble, refer to Mora et al., 2013). We                Iturbide et al., 2015). Weighted median consensus forecasts were
estimated the multi-model variability by calculating the SD                  computed (Marmion et al., 2009), and models performing poorly
of model means among ESM per variable and time period                        (with TSS values ≤ 0.5) were excluded from the final ensemble
(Supplementary Figure 1). There are several methods to                       (Supplementary Figure 3). The TSS scores were interpreted
ensemble ESMs, but the average of several coupled climate                    according to the accuracy classification scheme described by
models is usually found to agree better with observations than               Landis and Koch (1977): TSS > 0.8 excellent; 0.6
Boavida-Portugal et al. Cephalopod Under Climate Change
used in this study). We also imposed bathymetric limitations so performed at “excellent” levels with a TSS of 0.81 ± 0.11
that species would not be allowed to colonize a cell if it fell outside (Supplementary Figure 3).
the bathymetric range of species (Albouy et al., 2012b). The variable responsible for the highest percentage (55%)
We calculated the potential distribution of each species of environmental space that was not observed under the
for each time period and calculated the coastal cephalopod baseline scenario was pH (i.e., ocean acidification). Chlorophyll
diversity by stacking individual distributional maps on top of was responsible for 21% of new environmental space, SST
each other and inferring species richness in each grid cell. for 13%, oxygen for 8%, and sea surface salinity for 3%
We projected diversity for coastal cephalopods as a whole and (Supplementary Figure 2).
individually for its three main groups, namely, cuttlefishes,
squids, and octopuses. We then quantified the potential changes
in cephalopod species richness as the difference between the Cephalopod Hot Spots and Projected
future and the baseline period. Changes in Richness
Then, we analyzed potential changes in cephalopod From the latitudinal gradient analysis, we identified the zeniths
assemblage composition (species replacement vs. nestedness) of coastal cephalopod diversity for the baseline period at 8◦ N and
between the two time periods. Using SST (as described in Albouy 9.5◦ S latitude (in the Western/Central Indo-Pacific area), with a
et al., 2012a) and its decomposition, we chose beta ratio (βratio) mean richness of 39 ± 15 species and 38 ± 13 species, respectively
as a useful index to describe the relative contribution of each (Figure 1A). When looking at the major coastal cephalopod
component (species replacement vs. nestedness) in the overall families, we identified a hot spot of cuttlefish richness around
amount of STT. βratio values smaller than 0.5 indicate that 12◦ N (19 ± 8 species), in the Bay of Bengal area (Figure 1C).
species replacement is the main driver of STT, whereas values Squid diversity peaks around 7.5◦ S (19 ± 4 species), in the central
greater than 0.5 indicate that STT is mostly caused by nestedness Indo-Pacific (Figure 1E). Finally, octopus diversity zeniths are
(if βratio = 1, i.e., nestedness is the sole driver of STT; if βratio = 0, identified around 40◦ N (3 ± 2 species) in the Mediterranean
i.e., only replacement explains STT). In this study, we determined Sea and around 17◦ N (2 ± 1 species) on the wider Caribbean
βratio as the ratio between the nestedness component of the region (Figure 1G).
Jaccard’s dissimilarity index (βjne) and Jaccard’s dissimilarity Hot spots in the future scenario are projected to shift
index (βjac) (Dobrovolski et al., 2011). toward higher latitudes and present less diverse assemblages.
We also projected the changes in the distribution of mean Future coastal cephalopod richness zeniths are projected around
body size of assemblages using the measurements of the 21◦ N latitude (Figure 1B; 13 ± 11 species) at the Bay of
maximum body size of species provided by FAO (Jereb and Bengal and the China Sea area and around 18◦ S (13 ± 6
Roper, 2005, 2010; Jereb et al., 2016), by comparing current and species) in the Madagascar coast area. These latitudinal patterns
projected future distributions of mean body size, under climate are driven mostly by cuttlefish [Figure 1D; zeniths at 21◦ N
change. To limit the effect of extremely large body sizes and (5 ± 6 species) and 19.5◦ S latitudes (4 ± 3 species)] and
account for non-normal distributions, we used the logarithm of squid [zeniths at 20◦ N (8 ± 5 species) and 18◦ S latitudes
body size and applied the geometric rather than the arithmetic (8 ± 3 species)] diversity, despite the high diversity of this
mean (Fisher et al., 2010). Body size analyses were averaged last group all throughout the Indo-Pacific area [Figure 1F;
at the level of Exclusive Economic Zone (EEZ), so they can zenith around 1◦ S (8 ± 5 species)]. Octopus hot spots are
relate with the potential economic impacts of climate change on projected to slightly shift North but remaining in the same
cephalopod fisheries [cephalopod global capture production per areas (the Mediterranean Sea and the Caribbean region), and
country (FAO, 2016) was used as a proxy for countries depend still, they are projected to suffer a threefold decrease in
on the resource]. richness (Figure 1H).
In addition, we quantified the potential effect of climate By the end of the century, 69% of the continental shelf is
change on species range sizes by calculating the relative loss or predicted to experience some loss in adequate environmental
gain (0.5 threshold in the probability of occurrence) of the sizes of niches, whereas only 12% is predicted to gain (Figure 2, right
the potential geographic ranges (measured as the number of cells panels). Habitat loss for coastal cephalopods is predicted to occur
occupied by a species) between the future and baseline period. mostly in the tropics, with peaks at 10.5◦ S and 8◦ N latitudes, with
a mean loss of up to 39 ± 15 species. The gains in habitat are
predicted only for the northern latitudes above 70◦ N but with
RESULTS much less intensity than losses (1 ± 1 species).
Under the future climate change scenario, the potential
Model Prediction Accuracy and geographic range sizes of coastal cephalopods are projected to
Environmental Variable Importance decrease for 149 species (95%), of which 24 (15%) are projected to
The predictive accuracy of the seven ENMs used in these analyses completely lose their suitable environmental space, and increase
was classified from “fair” to “excellent” (according to the study only for 7 species (5%). The same trend is true for the main
by Landis and Koch, 1977 classification scheme), with a mean groups within Cephalopoda, with cuttlefishes shrinking their
TSS criterion of 0.69 ± 0.08. The model with the lowest TSS was potential range in 95% of the species (with 15% projected to
GARP (TSS = 0.45 ± 0.34), and the highest TSS was obtained completely lose their suitable habitat), squids in 96% of the
with GAM, with TSS = 0.84 ± 0.09. The remaining ensembles species (of which 14% are projected to disappear), and octopuses
Frontiers in Marine Science | www.frontiersin.org 4 January 2022 | Volume 8 | Article 740781Boavida-Portugal et al. Cephalopod Under Climate Change
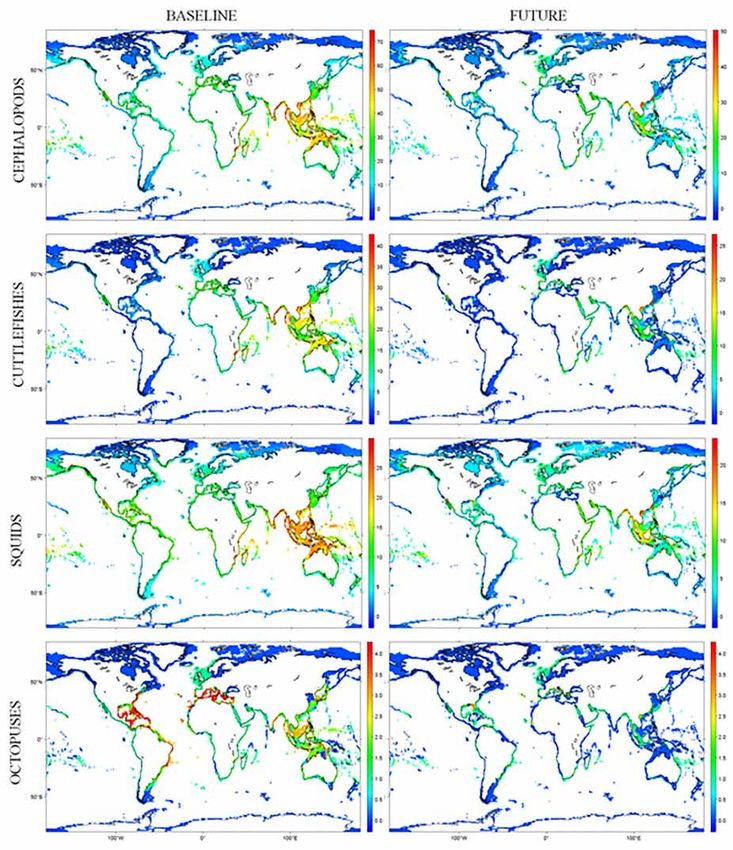
FIGURE 1 | (A–H) Projected richness for the baseline and the end-of-century period, under IPCC AR5 RCP4.5 scenario, for coastal cephalopods and its main
groups [cuttlefishes (n = 76), squids (n = 69), and octopuses (n = 11)].
in 100% of the species are projected to reduce geographic range ratio = 0.64 ± 0.41). It was also the key contributor to the total
(with 30% projected to completely lose adequate environment). amount of STT in 48% of cells (mean β ratio = 0.95 ± 0.13). The
replacement was the key contributor in only 32% of cells (mean
Projected Changes in Cephalopod β ratio = 0.13 ± 0.14). For the remaining cells in the continental
Composition shelf, the βratio was not calculated since there were no changes
Nestedness contributed more than replacement in explaining the in predicted habitat suitability for all occurring species between
temporal pattern of cephalopod turnover (Figure 2B, mean β periods. When looking at the latitudinal patterns of STT, the
Frontiers in Marine Science | www.frontiersin.org 5 January 2022 | Volume 8 | Article 740781Boavida-Portugal et al. Cephalopod Under Climate Change FIGURE 2 | (A–H) Predicted changes in richness and composition between the baseline and the end-of-century period, under IPCC AR5 RCP4.5 scenario, for the coastal cephalopod assemblages. Changes in diversity are quantified using delta richness (DRS) and changes in composition using the βratio index. Frontiers in Marine Science | www.frontiersin.org 6 January 2022 | Volume 8 | Article 740781
Boavida-Portugal et al.                                                                                           Cephalopod Under Climate Change

replacement is more intense in the northern latitudes, above               warmer temperatures. In terrestrial organisms, the physiological
50◦ N, with squids being the main driver of this pattern. In all the       adaptation to heat seems to be generally impaired (Araújo
remaining latitudes, nestedness is the main component of SST,              et al., 2013), although these patterns have not been fully
with the highest values in the equatorial latitudes, driven both by        explored in marine environments. If the pattern is true for
the patterns of cuttlefishes and squids (Figure 2, left panels).           marine organisms, then moving to cooler habitats at higher
                                                                           latitudes would constitute the more viable adaptive strategy.
Current Patterns and Projected Changes                                     Another alternative is for animals to seek deeper colder water
in Body Size Distributions                                                 in response to environmental warming (Dulvy et al., 2008).
Species body size patterns in the baseline scenario present a              However, moving toward the deep ocean might be unsuitable for
general trend of higher values toward higher latitudes, with a             coastal cephalopods, since most of them are highly dependent on
maximum mean body size of 5.91 ± 0.26 (log) cm around                      the complexity and diversity of neritic habitats for reproduction
53◦ S. Our models project decreases in maximum mean body                   (Boyle and Rodhouse, 2005).
size to occur in 37% of the globe, mainly in the higher latitudes              The predicted range shifts in cephalopod distribution
above 50◦ N, and to increase in 44%, mostly in the intermediate            combined with the range contractions projected for most species
latitudes (between 50◦ N and 30◦ N). Some of the areas projected           will result in drastic changes in species composition. Our results
to suffer a reduction in maximum mean body size are located near           point to nestedness being the main component of cephalopod
countries with higher dependency on the resource (e.g., Russia,            temporal turnover, with species replacement only predicted to
USA, Chile, and Italy).                                                    occur in a few areas (mainly in the higher latitudes; Figure 2, left
                                                                           panels). These changes in species composition will result in a less
                                                                           diverse assemblage, as they are projected to occur mainly due to
DISCUSSION                                                                 the loss of species, but it is also vital to understand the degree
                                                                           of functional redundancy maintained and to better predict the
In this study, we provided a first attempt to understand the               consequences on ecosystem functioning and resilience (Albouy
global patterns of cephalopod diversity within the neritic realm           et al., 2012a). This is particularly important in coastal ecosystems
and explore changes projected to happen due to climate change.             since anthropogenic pressure may act in synergy with climate
We have shown that, in the baseline scenario, the hot spot of              change intensifying local extinctions (Crain et al., 2009).
coastal cephalopod richness is found in the Central Indo-Pacific               The distribution of maximum body size observed in the
region, particularly in the East China Sea and in the Eastern              baseline scenario is consistent with the temperature-size rule
Philippines ecoregions (Figure 1, left panels). Given the limiting         (Atkinson, 1994), with larger animals occurring at higher
number of octopus occurrence data obtained for this study (10              latitudes (and lower temperatures). Rosa et al. (2012a) already
species), it might seem that these coastal cephalopod hot spots            reported this pattern for the same taxonomic group in the
are driven mainly by the high diversity of squids and cuttlefish;          Atlantic Ocean, and in this study, we observed it across the globe.
nevertheless, this may not be true as it is known that many                According to model projections, there is a tendency of a slight
octopus species are endemic in this region (Jereb et al., 2016).           increase in mean body size toward areas with higher losses in
The Central Indo-Pacific region is described as a biodiversity hot         projected richness (Figure 3), suggesting that these losses are
spot for many marine taxa (Roberts et al., 2002; Tittensor et al.,         affecting predominantly the smaller species (better represented
2010), and several authors have suggested different hypotheses,            in tropical latitudes). This trend can mean good news for fisheries
based on particularly rich environmental conditions or historical          in these areas, as this might potentially lead to a mitigation of the
geological events, that might have promoted speciation processes           negative effects of climate change as measured by the total capture
and/or refuge in this area (Renema et al., 2008; Cowman and                (ton). In contrast, for higher latitudes, the tendency seems to be
Bellwood, 2013; Leprieur et al., 2016). Our projections are in line        the opposite. Projected changes are more favorable to countries
with the results of a recent study (Rosa et al., 2019) exploring for       at higher latitudes since their fisheries are expected to benefit
the first time the global patterns of species richness in coastal          from the predicted poleward shifts in species richness. Despite the
cephalopods, showing that despite the lack of data for some                projected gain in cephalopod diversity toward the poles, fisheries
groups or geographic areas (e.g., octopuses), our models provide           may need to adjust to the predicted reduction in mean body size.
a consistent picture of the current global patterns.                           The effects of ecological change on cephalopod populations
   Regarding changes in cephalopod diversity, we found that                driven by overexploitation of fishery resources are still to be fully
projected losses of habitat suitability for species were more              understood. Yet, one might argue that under the combined effects
important within the tropical areas whereas gains were greater             of intense fishing pressure and climate change, fish are likely to
toward the poles (Figure 2, right panels). These findings are              be poor competitors in relation to cephalopods since the latter
consistent with studies that revealed poleward shifts in species           display faster growth, higher reproductive rates, short life cycles,
distribution within the 21st century (Burrows et al., 2011;                and voracious opportunistic predatory habits (Rodhouse, 2008;
Poloczanska et al., 2013), as well as predictions of shifts in the         Rosa et al., 2013a,b). Cephalopod biomass has not yet replaced
21st century (Pereira et al., 2010; Jones and Cheung, 2014).               fish biomass in the landings, but looking at the continuing
In the tropics, marine animals tend to have their critical                 growing trend (Doubleday et al., 2016), this hypothesis has
thermal tolerances close to environmental temperature limits               to be considered. However, within the global climate change
(Tewksbury et al., 2008), making them highly sensitive to                  context, our results show that there might not be suitable

Frontiers in Marine Science | www.frontiersin.org                      7                                     January 2022 | Volume 8 | Article 740781
Boavida-Portugal et al. Cephalopod Under Climate Change FIGURE 3 | (A) Distribution of geometric mean body size (log) projected for the cephalopod group, in the baseline period. Lateral panel represents the mean body size predicted for the baseline (blue line) and for the future (red line) period. (B) Net differences in geometric mean body size predicted between the two periods. Inland shades of gray represent cephalopod global capture production per country (ton) [2016 data – FAO (2016)]. environmental space for cephalopod species to do so. However, Given the increasing number of cross-factorial studies our models do not consider the potential for rapid acclimation showing the deleterious interacting effects of ocean warming and adaptation (Munday, 2014), which could give cephalopods and acidification on the development and physiology of time and evolutionary opportunities to adapt to future changes. marine invertebrates (Portner, 2008; Findlay et al., 2010; Frontiers in Marine Science | www.frontiersin.org 8 January 2022 | Volume 8 | Article 740781
Boavida-Portugal et al.                                                                                       Cephalopod Under Climate Change

Byrne and Przeslawski, 2013), such as cephalopods (Rosa et al.,         correlative ENMs that allow multiple species to be modeled
2014), together with the availability of several new marine             simultaneously while accounting for species correlations not
variables in the IPCC (2013), pH was included in our models.            explained by available environmental predictors. By accounting
It proved to have a great impact on species distribution,               for interactions between multiple species, the expectation is that
as pH was the climatic factor responsible for unsuitable                JSDMs might allow for more accurate predictions and are being
environmental space in 55% of the times, whereas SST was                increasingly adopted in the literature (Wilkinson et al., 2021).
only in 13%. This led to more pessimistic results, in terms of              The global scale and complexity of climate change impacts,
range contraction due to loss of environmental space, when              and the uncertainty in regional climate and earth system
compared with other similar studies (e.g., Cheung et al., 2009;         projections (Frölicher et al., 2016) calls for improved resolution
Poloczanska et al., 2013). Also, our assumption of limited              of regional climate processes. Recent high-resolution climate
dispersal and the fact that ENMs only take climatic variables           models have allowed coastal processes to be better resolved
into account, when characterizing the habitat suitability, should       and, in some cases, to reduce regional model biases (Saba
be taken into considerations when interpreting the results.             et al., 2016), but more needs to be done in the terms of data
Furthermore, ENMs predict potential niches, not the actual              collection and in the integration of biotic processes in more
distributions (Peterson et al., 2011), so it is likely that many        refined models. The use of these data in a “hybrid” mechanistic-
areas projected to be occupied in the present and in the                empirical approach (as proposed by Robinson et al., 2011) could
future might actually not be. These assumptions and limitations         give us more accurate predictions of what will happen in the
call for careful interpretation of the projected changes in             ocean of tomorrow.
species richness and composition. Also, the underrepresentation
of octopus species in this study, due to both bathymetric
limitation imposed and lack of high-quality occurrence data             DATA AVAILABILITY STATEMENT
for this group, makes the representativeness of the Southern
Ocean incomplete.                                                       The original contributions presented in the study are included
   Other important factor when interpreting the projections             in the article/Supplementary Material, further inquiries can be
made in this study is taking into considerations that the               directed to the corresponding author.
projections made in the areas with new environmental space
(Supplementary Figure 2) or high disagreement between
models (higher SD in Supplementary Figure 4) call for                   AUTHOR CONTRIBUTIONS
ponderation. There are several sources of uncertainty when
dealing with ENMs projections: the uncertainty introduced               JB-P and RR conceived the manuscript. JB-P and FG analyzed
by the data, which in this case has to be taken into account            the data. JB-P wrote the first draft. All authors contributed to the
as the representativeness of one of the groups is incomplete;           final manuscript.
the uncertainty linked with statistical algorithms, reduced
in this study by the use of ensemble forecasting approach
(Araújo and New, 2007) and exclusion of low-performance
                                                                        FUNDING
models, as evidenced in Supplementary Figures 3, 4 and                  This study was supported by the Portuguese Foundation
finally the uncertainty related to climate projections, also            for Science and Technology (FCT) through a Ph.D. grant
addressed by the use of multi-model ensemble (Mora et al.,              (SFRH/BD/51514/2011) to JB-P, project grants PTDC/BIA-
2013) and represented in Supplementary Figure 1. Despite                BEC/103266/2008 and PTDC/MAR/0908066/2008 to RR, and
these methodological limitations, the efforts to reduce                 PTDC/AAC-AMB/98163/2008 to MA and FG.
and access uncertainty were made and can be observed
that the disagreements between model projections are
higher for baseline scenario than for future scenario, which            ACKNOWLEDGMENTS
derive from the consistency across projections made for
the future, i.e., a loss of habitat suitability in the tropical         We would like to thank the Food and Agriculture Organization of
area and a gain in the higher latitudes, pointing that the              the United Nations (FAO) for providing the spatial data of species
projected changes due to new climatic conditions are                    and Dora Neto for the help with spatial data processing. We
likely to occur. Nevertheless, the first-order geographical             also thank Camilo Mora and Rollan Geronimo for providing the
tendencies of these projections reflect major climatic drivers          climatic data. MA also acknowledges the Integrated Program of
of change thus being likely to be ecologically meaningful               IC&DT Call No 1/SAESCTN/ALENT-07-0224-FEDER-001755.
(Garcia et al., 2015).
   In this study, we used stacked multiple single-species ENMs
to estimate community structure and species richness. Yet, it has       SUPPLEMENTARY MATERIAL
been suggested that, because they do not account for species
interactions, these models tend to overpredict species richness         The Supplementary Material for this article can be found online
(e.g., Guisan and Rahbek, 2011; Calabrese et al., 2014). Joint          at:    https://www.frontiersin.org/articles/10.3389/fmars.2021.
species distribution models (JSDMs) are an extension of standard        740781/full#supplementary-material

Frontiers in Marine Science | www.frontiersin.org                   9                                    January 2022 | Volume 8 | Article 740781
Boavida-Portugal et al. Cephalopod Under Climate Change
REFERENCES macroecological models. Glob. Ecol. Biogeogr. 23, 99–112. doi: 10.1111/geb.
12102
Albouy, C., Guilhaumon, F., Araújo, M. B., Mouillot, D., and Leprieur, F. (2012a). Cheung, W. W. L., Brodeur, R. D., Okey, T. A., and Pauly, D. (2015).
Combining projected changes in species richness and composition reveals Projecting future changes in distributions of pelagic fish species of Northeast
climate change impacts on coastal Mediterranean fish assemblages. Glob. Pacific shelf seas. Prog. Oceanogr. 130, 19–31. doi: 10.1016/j.pocean.2014.
Change Biol. 18, 2995–3003. doi: 10.1111/j.1365-2486.2012.02772.x 09.003
Albouy, C., Guilhaumon, F., Leprieur, F., Lasram, F. B. R., Somot, S., Aznar, R., et al. Cheung, W. W. L., Lam, V. W. Y., Sarmiento, J. L., Kearney, K., Watson, R., and
(2012b). Projected climate change and the changing biogeography of coastal Pauly, D. (2009). Projecting global marine biodiversity impacts under climate
Mediterranean fishes. J. Biogeography 40, 534–547. doi: 10.1111/jbi.12013 change scenarios. Fish Fish. 10, 235–251. doi: 10.1111/j.1467-2979.2008.00315.
Allouche, O., Tsoar, A., and Kadmon, R. (2006). Assessing the accuracy of species x
distribution models: prevalence, kappa and the true skill statistic (TSS). J. Appl. Cheung, W. W. L., Sarmiento, J. L., Dunne, J., Frölicher, T. L., Lam, V. W. Y.,
Ecol. 43, 1223–1232. doi: 10.1111/j.1365-2664.2006.01214.x Palomares, M. L. D., et al. (2012). Shrinking of fishes exacerbates impacts of
Almeida-Neto, M., Frensel, D. M. B., and Ulrich, W. (2011). Rethinking the global ocean changes on marine ecosystems. Nat. Clim. Change 3, 254–258.
relationship between nestedness and beta diversity: a comment on Baselga doi: 10.1038/nclimate1691
(2010). Glob. Ecol. Biogeogr. 21, 772–777. doi: 10.1111/j.1466-8238.2011.0 Cowman, P., and Bellwood, D. (2013). Vicariance across major marine biogeo-
0709.x graphic barriers: temporal concordance and the relative intensity of hard versus
Anderson, M. J., Crist, T. O., Chase, J. M., Vellend, M., Inouye, B. D., Freestone, soft barriers. Proc. R. Soc. B Biol. Sci. 280:20131541. doi: 10.1098/rspb.2013.
A. L., et al. (2011). Navigating the multiple meanings of beta diversity: a 1541
roadmap for the practicing ecologist. Ecol. Lett. 14, 19–28. doi: 10.1111/j.1461- Crain, C. M., Halpern, B. S., Beck, M. W., and Kappel, C. V. (2009). Understanding
0248.2010.01552.x and managing human threats to the coastal marine environment. Ann. N.Y.
André, J., Haddon, M., and Pecl, G. T. (2010). Modelling climate-change-induced Acad. Sci. 1162, 39–62. doi: 10.1111/j.1749-6632.2009.04496.x
nonlinear thresholds in cephalopod population dynamics. Glob. Change Biol. Dambach, J., and Roedder, D. (2011). Applications and future challenges in
16, 2866–2875. doi: 10.1111/j.1365-2486.2010.02223.x marine species distribution modeling. Aquat. Conserv. Mar. Freshw. Ecosyst. 21,
Araújo, M. B., Ferri-Yáñez, F., Bozinovic, F., Marquet, P., Valladares, F., and 92–100. doi: 10.1002/aqc.1160
Chown, S. (2013). Heat freezes niche evolution. Ecol. Lett. 16, 1206–1219. Diniz-Filho, J. F., Bini, L. M., Rangel, T. F., Loyola, R. D., Hof, C., Nogueñs-
doi: 10.1111/ele.12155 Bravo, D., et al. (2009). Partitioning and mapping uncertainties in ensembles
Araújo, M. B., and New, M. (2007). Ensemble forecasting of species distributions. of forecasts of species turnover under climate change. Ecography 32, 897–906.
Trends Ecol. Evol. 22, 42–47. doi: 10.1016/j.tree.2006.09.010 doi: 10.1111/j.1600-0587.2009.06196.x
Araújo, M. B., Thuiller, W., and Yoccoz, N. G. (2009). Reopening the climate Dobrovolski, R., Melo, A., Cassemiro, F., and Jaf, D. F. (2011). Climatic history
envelope reveals macroscale associations with climate in European birds. and dispersal ability explain the relative importance of turnover and nestedness
Proc. Natl. Acad. Sci. U.S.A. 106, E45–E46. doi: 10.1073/pnas.081329 components of beta diversity. Glob. Ecol. Biogeogr. 21, 191–197. doi: 10.1111/j.
4106 1466-8238.2011.00671.x
Atkinson, D. (1994). Temperature and organism size – a biological law for Doubleday, Z. A., Prowse, T. A., Arkhipkin, A., Pierce, G. J., Semmens, J. M.,
ectotherms? Adv. Ecol. Res. 25, 1–58. doi: 10.1016/S0065-2504(08)60212-3 Steer, M. A., et al. (2016). Global proliferation of cephalopods. Curr. Biol. 26,
Barbet-Massin, M., Jiguet, F., Albert, C. H., and Thuiller, W. (2012). Selecting R406–R407. doi: 10.1016/j.cub.2016.04.002
pseudo-absences for species distribution models: how, where and how many? Dulvy, N. K., Rogers, S. I., Jennings, S., Stelzenmüller, V., Dye, S. R., and Skjoldal,
Methods Ecol. Evol. 3, 327–338. doi: 10.1111/j.2041-210X.2011.00172.x H. R. (2008). Climate change and deepening of the North Sea fish assemblage:
Barbosa, A. M., Brown, J. A., Jimenez-Valverde, A., and Real, R. (2014). modEvA: a biotic indicator of warming seas. J. Appl. Ecol. 45, 1029–1039. doi: 10.1111/j.
Model Evaluation and Analysis. R package V. 2.0. 1365-2664.2008.01488.x
Barbosa, A. M., Jimenez-Valverde, A., and Real, R. (2009). Transferability of Elith, J., Kearney, M., and Phillips, S. (2010). The art of modelling range-shifting
environmental favourability models in geographic space: the case of the Iberian species. Methods Ecol. Evol. 1, 330–342. doi: 10.1111/j.2041-210X.2010.00036.x
desman (Galemys pyrenaicus) in Portugal and Spain. Ecol. Model. 220, 747–754. ESRI (2006). ArcGIS. Redlands, CA: Environmental Systems Research Institute
doi: 10.1016/j.ecolmodel.2008.12.004 (ESRI).
Baselga, A. (2010). Partitioning the turnover and nestedness components of beta ETOPO2 (2010). Global Gridded 2-minute Database. New York, NY: National
diversity. Glob. Ecol. Biog. 19, 134–143. doi: 10.1111/j.1466-8238.2009.00490.x Geophysical Data Center, National Oceanic and Atmospheric Administration,
Baselga, A. (2012). The relationship between species replacement, dissimilarity US Department of Commerce, USA.
derived from nestedness, and nestedness. Glob. Ecol. Biogeogr. 21, 1223–1232. FAO (2016). Universal Software for Fishery Statistical Time Series. Available at http:
doi: 10.1111/j.1466-8238.2011.00756.x //www.fao.org/fishery/statistics/software/fishstatj/en (accessed June 6, 2017).
Bishop, T. R., Robertson, B. J., and Parr, C. L. (2015). Macroecological signals of FAO (2018). “Impacts of climate change on fisheries and aquaculture: synthesis
species interactions in the Danish avifauna. Proc. Natl. Acad. Sci. U.S.A. 107, of current knowledge, adaptation and mitigation options,” in Fisheries and
5030–5035. doi: 10.1073/pnas.0914089107 Aquaculture Technical Paper: 627, eds M. Barange, T. Bahri, and M. C. M.
Boyle, P., and Rodhouse, P. G. (2005). Cephalopods Ecology and Fisheries. Oxford: Beveridge (Rome: FAO).
Blackwell Science, 452. doi: 10.1002/9780470995310 Findlay, H. S., Kendall, M. A., Spicer, J. I., and Widdicombe, S. (2010). Relative
Brown, J. H., Gillooly, J. F., Allen, A. P., Savage, V. M., and West, G. B. (2004). influences of ocean acidification and temperature on intertidal barnacle post-
Toward a metabolic theory of ecology. Ecology 85, 1771–1789. doi: 10.1890/03- larvae at the northern edge of their geographic distribution. Estuar. Coast. Shelf
9000 Sci. 86, 675–682. doi: 10.1016/j.ecss.2009.11.036
Burrows, M. T., Schoeman, D. S., Buckley, L. B., Moore, P., Poloczanska, Fisher, J. A. D., Frank, K. T., and Leggett, W. C. (2010). Global variation in marine
E. S., Brander, K. M., et al. (2011). The pace of shifting climate in marine fish body size and its role in biodiversity-ecosystem functioning. Mar. Ecol.
and terrestrial ecosystems. Science 334, 652–655. doi: 10.1126/science.121 Prog. Ser. 405, 1–13. doi: 10.3354/meps08601
0288 Frölicher, T. L., Rodgers, K. B., Stock, C. A., and Cheung, W. W. L. (2016). Sources
Byrne, M., and Przeslawski, R. (2013). Multistressor impacts of warming and of uncertainties in 21st century projections of potential ocean ecosystem
acidification of the ocean on marine invertebrates’ life histories. Integr. Comp. stressors. Glob. Biogeochem. Cycles 30, 1224–1243. doi: 10.1002/2015GB005338
Biol. 53, 582–596. doi: 10.1093/icb/ict049 Garcia, R. A., Cabeza, M., Altwegg, R., and Araújo, M. B. (2015). Do projections
Cadotte, M. W., Carscadden, K., and Mirotchnick, N. (2011). Beyond species: from bioclimatic envelope models and climate change metrics match? Glob.
functional diversity and the maintenance of ecological processes and services. Ecol. Biogeogr. 25, 65–74. doi: 10.1111/geb.12386
J. Appl. Ecol. 48, 1079–1087. doi: 10.1111/j.1365-2664.2011.02048.x Gotelli, N. J., Graves, G. R., and Rahbek, C. (2010). Contrasting species and
Calabrese, J. M., Certain, G., Kraan, C., and Dormann, C. F. (2014). functional beta diversity in montane ant assemblages. J. Biogeogr. 42, 1776–
Stacking species distribution models and adjusting bias by linking them to 1786. doi: 10.1111/jbi.12537
Frontiers in Marine Science | www.frontiersin.org 10 January 2022 | Volume 8 | Article 740781Boavida-Portugal et al. Cephalopod Under Climate Change Guisan, A., and Rahbek, C. (2011). SESAM - a new framework integrating ecosystems and human well-being. Science 355:eaai9214. doi: 10.1126/science. macroecological and species distribution models for predicting spatio-temporal aai9214 patterns of species assemblages. J. Biogeogr. 38, 1433–1444. doi: 10.1111/j.1365- Pereira, H. M., Leadley, P. W., Proenca, V., Alkemade, R., Scharlemann, J. P., 2699.2011.02550.x Fernandez-Manjarrés, J. F., et al. (2010). Scenarios for global biodiversity in the Guisan, A., and Thuiller, W. (2005). Predicting species distribution: offering more 21st century. Science 330, 1496–1501. doi: 10.1126/science.1196624 than simple habitat models. Ecol. Lett. 8, 993–1009. doi: 10.1111/j.1461-0248. Peterson, A. T., Soberón, J., Pearson, R. G., Anderson, R. P., Martínez- 2005.00792.x Meyer, E., Nakamura, M., et al. (2011). Ecological Niches and Geographic Harley, C. D. G., Hughes, A. R., Hultgren, K. M., Miner, B. G., Sorte, C. J., Distributions. New Jersey: Princeton University Press, 280. doi: 10.23943/ Thornber, C. S., et al. (2006). The impacts of climate change in coastal princeton/9780691136868.001.0001 marine systems. Ecol. Lett. 9, 228–241. doi: 10.1111/j.1461-0248.2005.00 Pierce, G. J., Allcock, L., Bruno, I., Jereb, P., Lefkaditou, E., Malham, S., et al. (2010). 871.x Cephalopod Biology and Fisheries in Europe. ICES Cooperative Research Report Hillebrand, H., Soininen, J., and Snoeijs, P. (2010). Warming leads to higher No. 303. London: ICES. species turnover in a coastal ecosystem. Glob. Change Biol. 16, 1181–1193. Pinsky, M. L., Worm, B., Fogarty, M. J., Sarmiento, J. L., and Levin, S. A. (2013). doi: 10.1111/j.1365-2486.2009.02045.x Marine taxa track local climate velocities. Science 341, 1239–1242. doi: 10.1126/ IPCC (2013). “Climate change 2013: the physical science basis,” in Contribution of science.1239352 Working Group I to the Fifth Assessment Report of the Intergovernmental Panel Poloczanska, E. S., Brown, C. J., Sydeman, W. J., Kiessling, W., Schoeman, D. S., on Climate Change, eds T. F. Stocker, D. Qin, and G. K. Plattner (Cambridge, Moore, P. J., et al. (2013). Global imprint of climate change on marine life. Nat. MA: Cambridge University Press). Clim. Change 3, 919–925. doi: 10.1038/nclimate1958 IPCC (2014). Climate Change 2014: Synthesis Report. Contribution of Working Portner, H. O. (2008). Ecosystem effects of ocean acidification in times of ocean Groups I, II and III to the Fifth Assessment Report of the Intergovernmental Panel warming: a physiologist’s view. Mar. Ecol. Prog. Ser. 373, 203–217. doi: 10.3354/ on Climate Change, eds Core Writing Team, R. K. Pachauri, and L. A. Meyer meps07768 (Geneva: IPCC), 151. R Development Core Team (2010). R: A Language and Environment for Statistical Iturbide, M., Bedia, J., Herrera, S., Oscar djel Hierro, M., Pinto, J. M., and Computing. Vienna: R Foundation for Statistical Computing. Gutierrez, A. (2015). A framework for species distribution modelling with Renema, W., Bellwood, D. R., Braga, J. C., Bromfield, K., Hall, R., Johnson, K. G., improved pseudo-absence generation. Ecol. Model. 312, 166–174. doi: 10.1016/ et al. (2008). Hopping hotspots: global shifts in marine biodiversity. Science 321, j.ecolmodel.2015.05.018 654–657. doi: 10.1126/science.1155674 Jereb, P., and Roper, C. F. E. (2005). Cephalopods of The World: An Annotated Roberts, C. M., Mcclean, C. J., Veron, J. E. N., Hawkins, J. P., Allen, G. R., and Illustrated Catalogue of Cephalopod Species Known to Date. Volume 1. McAllister, D. E., et al. (2002). Marine biodiversity hotspots and conservation Chambered Nautiluses and Sepioids. Rome: FAO. priorities for tropical reefs. Science 295, 1280–1284. doi: 10.1126/science. Jereb, P., and Roper, C. F. E. (2010). Cephalopods of the World. An Annotated and 1067728 Illustrated Catalogue of Cephalopod Species Known to Date. Volume 2. Myopsid Robinson, L. M., Elith, J., Hobday, A. J., Pearson, R. G., Kendall, B. E., and Oegopsid Squids. Rome: FAO. Possingham, H. P., et al. (2011). Pushing the limits in marine species Jereb, P., Roper, C. F. E., Norman, M. D., and Finn, J. K. (2016). Cephalopods of the distribution modelling: lessons from the land present challenges and World. An Annotated and Illustrated Catalogue of Cephalopod Species Known to opportunities. Glob. Ecol. Biogeogr. 20, 789–802. doi: 10.1111/j.1466-8238.2010. Date. Volume 3. Octopods and Vampire Squids. Rome: FAO. 00636.x Jones, M. C., and Cheung, W. W. L. (2014). Multi-model ensemble projections of Rodhouse, P. G. (2008). Large-scale range expansion and variability in climate change effects on global marine biodiversity. ICES J. Mar. Sci. J. Conseil. ommastrephid squid populations: a review of environmental links. Calif. 72, 741–752. doi: 10.1093/icesjms/fsu172 Cooperat. Ocean. Fish. Investig. Rep. 49, 83–89. Lam, V., Cheung, W., Reygondeau, G., and Sumaila, U. R. (2016). Projected Rosa, R., Gonzalez, L., Dierssen, H. M., and Seibel, B. A. (2012a). Environmental change in global fisheries revenues under climate change. Sci. Rep. 6:32607. determinants of latitudinal size-trends in cephalopods. Mar. Ecol. Prog. Ser. 464, doi: 10.1038/srep32607 153–165. doi: 10.3354/meps09822 Landis, J. R., and Koch, G. G. (1977). The measurement of observer agreement for Rosa, R., Gonzalez, L., Hm, D., and Ba, S. (2012b). Environmental determinants categorical data. Biometrics 33, 159–174. doi: 10.2307/2529310 of latitudinal size-trends in cephalopods. Mar. Ecol. Prog. Ser. 464, Lasram, F. B. R., Guilhaumon, F., Albouy, C., Somot, S., Thuiller, W., and 153–165. Mouillot, D. (2010). The Mediterranean Sea as a ‘cul-de-sac’ for endemic fishes Rosa, R., Pierce, G. J., and O’dor, R. (2013a). Advances in Squid Biology, Ecology facing climate change. Glob. Change Biol. 16, 3233–3245. doi: 10.1111/j.1365- and Fisheries. Part I, Myopsid Squids. New York, NY: Nova Publishers. 2486.2010.02224.x Rosa, R., Pierce, G. J., and O’dor, R. (2013b). Advances in Squid Biology, Ecology Leprieur, F., Descombes, P., Gaboriau, T., Cowman, P. F., Parravicini, V., and Fisheries. Part II, Oegopsid Squids. New York, NY: Nova Publishers. Kulbicki, M., et al. (2016). Plate tectonics drive tropical reef biodiversity Rosa, R., Pissarra, V., Borges, F. O., Xavier, J., Gleadall, I. G., Golikov, A., et al. dynamics. Nat. Commun. 7:11461. doi: 10.1111/j.1365-2486.2010.02 (2019). Global patterns of species richness in costal cephalopods. Front. Mar. 224.x Sci. 6:469. doi: 10.3389/fmars.2019.00469 Lotze, H. K., Tittensor, D. P., Bryndum-Buchholz, A., Eddy, T. D., Cheung, W. W. Rosa, R., Truebenbach, K., Pimentel, M. S., Boavida-Portugal, J., Faleiro, F., L., Galbraith, E. D., et al. (2019). Global ensemble projections reveal trophic Baptista, M., et al. (2014). Differential impacts of ocean acidification and amplification of ocean biomass declines with climate change. Proc. Natl. Acad. warming on winter and summer progeny of a coastal squid (Loligo vulgaris). Sci. U.S.A. 116, 12907–12912. doi: 10.1073/pnas.1900194116 J. Exp. Biol. 217, 518–525. doi: 10.1242/jeb.096081 Marmion, M., Parviainen, M., Luoto, M., Heikkinen, R. K., and Thuiller, W. (2009). Saba, V., Griffies, S., Anderson, W., Winton, M., Alexander, M. A., Delworth, Evaluation of consensus methods in predictive species distribution modelling. T. L., et al. (2016). Enhanced warming of the Northwest Atlantic Ocean under Divers. Distrib. 15, 59–69. doi: 10.1111/j.1472-4642.2008.00491.x climate change. J. Geophys. Res. Oceans 121, 118–132. doi: 10.1002/2015JC0 Mora, C., Wei, C. L., Rollo, A., Amaro, T., Baco, A. R., Billett, D., et al. (2013). 11346 Biotic and human vulnerability to projected changes in ocean biogeochemistry Senay, S. D., Worner, S. P., and Ikeda, T. (2013). Novel three-step pseudo-absence over the 21st Century. PLoS Biol. 11:e1001682. doi: 10.1371/journal.pbio.100 selection technique for improved species distribution modelling. PLoS One 1682 8:e71218. doi: 10.1371/journal.pone.0071218 Munday, P. L. (2014). Transgenerational acclimation of fishes to climate change Shabani, F., Kumar, L., and Ahmadi, M. (2018). Assessing accuracy methods and ocean acidification. F1000Prime Rep. 6:99. doi: 10.12703/P6-99 of species distribution models: AUC, specificity, sensitivity and the true skill Myers, R. A., and Worm, B. (2003). Rapid worldwide depletion of predatory fish statistic. Glob. J. Hum. Soc. Sci. B 18:249. communities. Nature 423, 280–283. doi: 10.1038/nature01610 Sheridan, J. A., and Bickford, D. (2011). Shrinking body size as an ecological Pecl, G. T., Araújo, M. B., Bell, J. D., Blanchard, J., Bonebrake, T. C., Chen, I. response to climate change. Nat. Clim. Change 1, 401–406. doi: 10.1038/ C., et al. (2017). Biodiversity redistribution under climate change: impacts on nclimate1259 Frontiers in Marine Science | www.frontiersin.org 11 January 2022 | Volume 8 | Article 740781
Boavida-Portugal et al.                                                                                                                        Cephalopod Under Climate Change

Spalding, M. D., Fox, H. E., Allen, G. R., Davidson, N., Ferdaña, Z. A., Finlayson,            Woodward, G., Ebenman, B., Emmerson, M., Montoya, J., Olesen, J., Valido, A.,
    M., et al. (2007). Marine ecoregions of the world: a bioregionalization of coastal           et al. (2005). Body size in ecological networks. Trends Ecol. Evol. 20, 402–409.
    and shelf areas. Bioscience 57, 573–583. doi: 10.1641/B570707                                doi: 10.1016/j.tree.2005.04.005
Tebaldi, C., and Knutti, R. (2007). The use of the multi-model ensemble in
    probabilistic climate projections. Proc. R. Soc. A Math. Phys. Eng. Sci. 365,              Conflict of Interest: The authors declare that the research was conducted in the
    2053–2075. doi: 10.1098/rsta.2007.2076                                                     absence of any commercial or financial relationships that could be construed as a
Tewksbury, J. J., Huey, R. B., and Deutsch, C. A. (2008). Putting the heat on tropical         potential conflict of interest.
    animals. Science 320, 1296–1297. doi: 10.1126/science.1159328
Tittensor, D. P., Mora, C., Jetz, W., Lotze, H. K., Ricard, D., Berghe, E. V.,                 Publisher’s Note: All claims expressed in this article are solely those of the authors
    et al. (2010). Global patterns and predictors of marine biodiversity across taxa.          and do not necessarily represent those of their affiliated organizations, or those of
    Nature 466, 1098–U1107. doi: 10.1038/nature09329                                           the publisher, the editors and the reviewers. Any product that may be evaluated in
United Nations (2016). Paris Agreement. Paris: United Nations.                                 this article, or claim that may be made by its manufacturer, is not guaranteed or
Vuuren, D. P., Edmonds, J., Kainuma, M., Riahi, K., Thomson, A., Hibbard, K.,                  endorsed by the publisher.
    et al. (2011). The representative concentration pathways: an overview. Clim.
    Change 109, 5–31. doi: 10.1007/s10584-011-0148-z                                           Copyright © 2022 Boavida-Portugal, Guilhaumon, Rosa and Araújo. This is an
Wilkinson, D. P., Golding, N., Guillera-Arroita, G., Tingley, R., and McCarthy,                open-access article distributed under the terms of the Creative Commons Attribution
    M. A. (2021). Defining and evaluating predictions of joint species distribution            License (CC BY). The use, distribution or reproduction in other forums is permitted,
    models. Methods Ecol. Evol. 12, 394–404. doi: 10.1111/2041-210X.13518                      provided the original author(s) and the copyright owner(s) are credited and that the
Wisz, M. S., Hijmans, R. J., Li, J., Peterson, A. T., Graham, C. H., Guisan, A., et al.        original publication in this journal is cited, in accordance with accepted academic
    (2008). Effects of sample size on the performance of species distribution models.          practice. No use, distribution or reproduction is permitted which does not comply
    Divers. Distrib. 14, 763–773. doi: 10.1111/j.1472-4642.2008.00482.x                        with these terms.

Frontiers in Marine Science | www.frontiersin.org                                         12                                             January 2022 | Volume 8 | Article 740781
You can also read