Monthly Highlights - EUMOFA
←
→
Page content transcription
If your browser does not render page correctly, please read the page content below
Monthly Highlights
No. 6 / 2021

                                                             As of this issue, the Monthly Highlights
  In this issue                                              include Cyprus among surveyed countries.

  According to data collected by EUMOFA from
  14 EU Member States, in March 2021 European
  flounder and megrim together accounted for 16% of
                                                             Contents
  the total first-sales value of the commodity group
  “flatfish”.                                                      First sales in Europe
                                                                   European flounder (Denmark, Poland,
  From January to mid-April 2021, the EU import price              the Netherlands) and megrim
  of fresh or chilled Atlantic halibut from Norway                 (Denmark, France, Spain)
  remained stable and ranged from 6,59 to 8,49
  EUR/kg. Volume of supply ranged from 12,8 to 28,6                Extra-EU imports
                                                                   Weekly average EU import prices of
  tonnes.
                                                                   selected products from
  In March 2021, consumption of fresh fisheries and                selected countries of origin
  aquaculture products increased in both volume and
                                                                   Consumption
  value compared to March 2020 in almost all                       Miscellaneous shrimps in Germany,
  Member States, with Germany seeing the highest                   Ireland, Netherlands, and Portugal
  increases driven primarily by salmon and trout
  consumption.                                                     Case studies
                                                                   EU trade in 2020
  International trade is significant for the EU, being the
                                                                   Whelks in the EU
  largest global importer of fish and shellfish,
  accounting for 34% of the total world import value.
                                                                   Global highlights
  The EU was responsible for 70% of global whelk
  production in 2018, comprising two species, the                  Macroeconomic context
  common whelk and the veined rapa whelk, with                     Marine fuel, consumer prices, and
  exports mainly destined for Asian markets.                       exchange rates

  The European Commission adopted new strategic
  guidelines for a more sustainable and competitive
  EU aquaculture industry.

                                                               Find all data, information, and more at:
                                                                          www.eumofa.eu

                                                                      @EU_MARE #EUMOFA
European Market Observatory for                                                                                 MONTHLY HIGHLIGHTS | NO.6/2021
  Fisheries and Aquaculture Products                                                                                         FIRST SALES IN EUROPE

 1. First sales in Europe
 During January–March 2021, 14 EU Member States (MS), Norway, and the United Kingdom reported
 first-sales data for 10 commodity groups 1. First-sales data are based on sales notes and data collected from auction
 markets. First-sales data analysed in the section “First sales in Europe” are extracted from EUMOFA 2 as collected from
 national administrations.

 1.1. January-March 2021 compared to the same period in 2020

 Increases in value and volume: Cyprus, Estonia, France, Latvia, Lithuania, and Portugal were the countries that
 recorded an increase in both first-sales value and volume. In Lithuania and Estonia, a higher supply of herring led to a
 sharp increase.

 Decreases in value and volume: The Netherlands, Poland, Spain, and the United Kingdom recorded decreases in first-
 sales value and volume. Poland stood out with the most significant decrease, which was due to a lower supply of herring
 and sprat.

 Table 1.      JANUARY-MARCH OVERVIEW OF FIRST SALES FROM THE REPORTING COUNTRIES
               (volume in tonnes and value in million EUR) *

                                                                                                                                 Change from
                         January - March                    January - March                  January - March
                                                                                                                               January - March
                              2019                               2020                             2021
                                                                                                                                    2020
Country                Volume              Value          Volume            Value          Volume             Value           Volume           Value
Belgium                      3.541              14,4           3.341            16,2            3.352              12,8             0%           -21%
Bulgaria                        324             0,27             136            0,28              179              0,27           31%              -1%
Cyprus                          100             0,74               78           0,59                89             0,62           14%               5%
Denmark                   283.313             122,5        159.598              90,0        184.633                85,8           16%              -5%
Estonia                     18.381               3,9         16.966               4,5         24.481                 5,4          44%              20%
France                      46.197            154,2          38.744           131,2           42.689             141,4            10%               8%
Italy                       17.911              74,9         16.610             64,8          16.629               69,5             0%              7%
Latvia                      16.066               2,7         13.380               2,6         16.227                 3,4          21%              30%
Lithuania                       341              0,4             648              0,3           1.023                0,6          58%              73%
Netherlands                 50.504              85,4         54.244             81,8          45.868               63,1          -15%            -23%
Poland                      39.834              10,1         40.853               9,7         15.659                 3,7         -62%            -61%
Portugal                    20.965              57,5         14.006             47,7          14.150               51,6             1%              8%
Spain                     115.340             344,5        115.376            313,1         103.911              292,4           -10%              -7%
Sweden                      78.389              27,1         41.718             18,1          47.483               18,1           14%               0%
Norway                    917.712             825,4        925.199            898,0         964.737              822,1              4%             -8%
United                      72.937            148,7          86.112           140,6           83.285             121,8             -3%           -13%
Kingdom
   Possible discrepancies in % changes are due to rounding.
 * Volumes are reported in net weight for EU Member States, and in live weight equivalent (LWE) for Norway. Prices are reported in EUR/kg (without VAT). For
 Norway, prices are reported in EUR/kg of live weight.

 1
   Bivalves and other molluscs and aquatic invertebrates, cephalopods, crustaceans, flatfish, freshwater fish, groundfish, salmonids, small pelagics, tuna and
 tuna-like species, and other marine fish.
 2
   First sales data updated on 17.05.2021.

                                    Overview | 1. First sales in Europe | 2. Extra-EU imports | 3. Consumption
                                                                                                                                                                 2
                             | 4.    EU trade in 2020 | 5. Whelks in the European market | 6. Global highlights                      |
                                                             7. Macroeconomic context
European Market Observatory for                                                                              MONTHLY HIGHLIGHTS | NO.6/2021
  Fisheries and Aquaculture Products                                                                                      FIRST SALES IN EUROPE

 1.2. March 2021 compared to March 2020

 Increases in value and volume: First sales increased in Bulgaria, Cyprus, Estonia, France, Italy, Latvia, Portugal, and
 Spain. Sprat and clam were responsible for the sharp increases in Bulgaria, while picarel was the main species
 responsible for increases in Cyprus. Small pelagic species were responsible for increases in Italy (anchovy and sardine)
 and Portugal (horse mackerel species).

 Decreases in value and volume: First sales decreased in Denmark, the Netherlands, Poland, and Sweden. Poland and
 Sweden recorded the sharpest decreases due to lower sales of sprat and herring.

 Table 2.      MARCH OVERVIEW OF FIRST SALES FROM THE REPORTING COUNTRIES
               (volume in tonnes and value in million EUR) *

                             March 2019                      March 2020                      March 2021                 Change from March
                                                                                                                              2020
Country                  Volume           Value          Volume           Value          Volume          Value          Volume             Value
Belgium                        952              4,8          1.095              5,5          1.231             5,2           12%               -6%
Bulgaria                       203            0,13               43            0,06            126            0,16         193%             157%
Cyprus                           46           0,32               29            0,20             42            0,25           43%              29%
Denmark                  130.201              45,3        102.441              39,1        83.497             33,6         -18%              -14%
Estonia                      7.145              1,4          6.754              1,5          7.383             1,5            9%                3%
France                     13.903             48,0          11.183             34,7        15.264             50,7           36%              46%
Italy                        6.244            26,6           3.628             14,6         6.459             28,3           78%              94%
Latvia                       6.123              1,0          5.672              1,2          6.843             1,4           21%              15%
Lithuania                      108              0,1             323             0,1            298             0,2           -8%              36%
Netherlands                19.484             31,5          20.381             29,5        19.010             26,7           -7%               -9%
Poland                     17.933               4,4         20.968              4,9         1.244              0,3         -94%              -93%
Portugal                     6.528            19,9           4.381             13,7          6.350            23,0           45%              68%
Spain                      48.811           132,2           53.646           110,4         55.579           129,1             4%              17%
Sweden                     24.127               8,3         19.719              7,3          2.998             3,6         -85%              -51%
Norway                    392.180            344,4         358.656            305,3       377.603            295,7            5%               -3%
United Kingdom              11.859            28,5           23.343            28,3         20.874            32,6         -11%               15%
 Possible discrepancies in % changes are due to rounding.
 * Volumes are reported in net weight for EU Member States and the UK, and in live weight equivalent (LWE) for Norway. Prices are reported in EUR/kg (without
 VAT). For Norway, prices are reported in EUR/kg of live weight.

The most recent weekly first-sales data (up to week 26 of 2021) are available via the EUMOFA website, and can
be accessed here.

The most recent monthly first-sales data for April 2021 are available via the EUMOFA website, and can be
accessed here.

                                    Overview | 1. First sales in Europe | 2. Extra-EU imports | 3. Consumption
                                                                                                                                                                3
                             | 4.    EU trade in 2020 | 5. Whelks in the European market | 6. Global highlights                   |
                                                             7. Macroeconomic context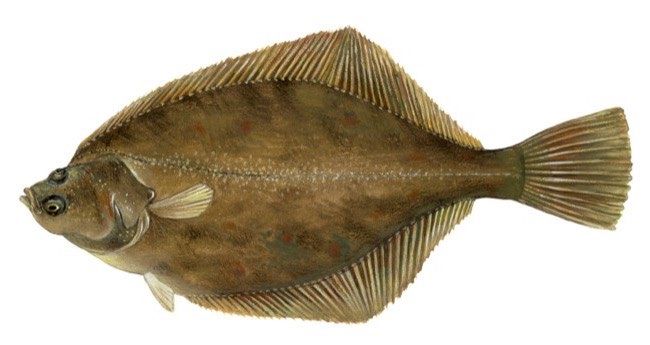
European Market Observatory for                                                                           MONTHLY HIGHLIGHTS | NO.6/2021
    Fisheries and Aquaculture Products                                                                                   FIRST SALES IN EUROPE

        1.3. First sales in selected countries
First sales data analysed in this section are extracted from EUMOFA 3.

Table 3.        FIRST SALES OF THE MAIN COMMERCIAL SPECIES 4 IN BELGIUM
                              First-sales                First-sales         Main contributing species
                              value / trend %            volume /
           Belgium                                       trend %

    Jan-Mar 2021 vs           EUR 12,8 million,          3.352 tonnes,       Value: common sole, squid, megrim.
    Jan-Mar 2020              -21%                       0%                  Volume: common sole, European plaice, cuttlefish, gurnard.
    Mar 2021 vs               EUR 5,2 million,           1.231 tonnes,       Value: common sole.
    Mar 2020                  -6%                        +12%                Volume: gurnard, ray, monk.

Figure 1.       FIRST SALES OF THE MAIN COMMERCIAL SPECIES IN BELGIUM, MARCH 2021

               -9%       -34%
     250                                                                                                                                    2.000
     200                                                                                                                                    1.500
                                                +46%
     150
                                                                                                                                            1.000
     100                                                                        +49%
                                                                                                                 +67%       +72%            500
      50                                                                                   +93%
                                                            +76%

               Common sole                          Gurnard                          Ray                             Monk
                                                        Volume (tonnes)               Value (EUR 1000)
Percentages show change from the previous year.

Table 4.        FIRST SALES OF THE MAIN COMMERCIAL SPECIES IN BULGARIA

                                     First-sales value /       First-sales             Main contributing species
                                     trend %                   volume / trend %
            Bulgaria

    Jan-Mar 2021 vs                  EUR 0,3 million,          179 tonnes,             Value: clam, molluscs and aquatic invertebrates (other)*.
    Jan-Mar 2020                     -1%                       +31%                    Volume: sprat.
    Mar 2021 vs                      EUR 0,2 million,          126 tonnes,             Clam, sprat, red mullet.
    Mar 2020                         +157%                     +193%

3
    First-sales data update on 17.5.2021.
4
    Data on fisheries and aquaculture products harmonised in EUMOFA allow comparisons along the different supply chain stages.

                                     Overview | 1. First sales in Europe | 2. Extra-EU imports | 3. Consumption
                                                                                                                                                    4
                              | 4.    EU trade in 2020 | 5. Whelks in the European market | 6. Global highlights                 |
                                                              7. Macroeconomic context
European Market Observatory for                                                                         MONTHLY HIGHLIGHTS | NO.6/2021
 Fisheries and Aquaculture Products                                                                                 FIRST SALES IN EUROPE

Figure 2.      FIRST SALES OF THE MAIN COMMERCIAL SPECIES IN BULGARIA, MARCH 2021

  100                          +149%                                                                                                         150
                                                           +444%
    80                                                                                                                                       120

    60         +143%                                                                                                                         90

    40                                                                                                                                       60
                                                                         +367%
    20                                                                                                                                       30
                                                                                                    +322%        +655%

                     Clam                                       Sprat                                  Red mullet
                                                  Volume (tonnes)                  Value (EUR 1000)
Percentages show change from the previous year. *EUMOFA aggregation for species. (Metadata 2, Annex 3: http://eumofa.eu/supply-balance-and-other-
methodologies).

Table 5.       FIRST SALES OF THE MAIN COMMERCIAL SPECIES IN CYPRUS
                                   First-sales value /     First-sales               Main contributing species
                                   trend %                 volume / trend %
            Cyprus

 Jan-Mar 2021 vs                   EUR 0,6 million,        89 tonnes,                Other seabream (other than gilthead seabream)*, picarel,
 Jan-Mar 2020                      +5%                     +14%                      squid.
 Mar 2021 vs                       EUR 0,3 million,        42 tonnes,                Picarel, other seabream (other than gilthead seabream),
 Mar 2020                          +29%                    +43%                      squid, other marine fish*.

Figure 3.      FIRST SALES OF THE MAIN COMMERCIAL SPECIES IN CYPRUS, MARCH 2021

         25              +46%                                                                                                        100
               +52%
         20                                                                                                                          80
                                                         +61%
         15                                                                                                                          60

         10                                   +77%                                                                +22%               40
                                                                                       +79%            +41%
           5                                                                                                                         20
                                                                           +79%

                     Picarel                   Seabream, other*                    Squid              Other marine fish
                                                  Volume (tonnes)                   Value (EUR 1000)
Percentages show change from the previous year. *EUMOFA aggregation for species.

Table 6.       FIRST SALES OF THE MAIN COMMERCIAL SPECIES IN DENMARK
                            First-sales               First-sales           Main contributing species
                            value / trend %           volume / trend %
         Denmark

 Jan-Mar 2021 vs            EUR 85,8 million,         184.633 tonnes,       Value: mackerel, blue whiting, cod, saithe.
 Jan-Mar 2020               -5%                       +16%                  Volume: sprat, herring, other marine fish*.
 Mar 2021                   EUR 33,6 million,         83.497 tonnes,        Blue whiting, herring, mussel Mytilus spp., European flounder.
 vs Mar 2020                -14%                      -18%

                                   Overview | 1. First sales in Europe | 2. Extra-EU imports | 3. Consumption
                                                                                                                                                    5
                            | 4.    EU trade in 2020 | 5. Whelks in the European market | 6. Global highlights            |
                                                            7. Macroeconomic context
European Market Observatory for                                                                  MONTHLY HIGHLIGHTS | NO.6/2021
    Fisheries and Aquaculture Products                                                                          FIRST SALES IN EUROPE

Figure 4.      FIRST SALES OF THE MAIN COMMERCIAL SPECIES IN DENMARK, MARCH 2021

     50.000                                                                                                                      12.000
                -28%       -39%
     40.000                                                                                                                      9.000
     30.000
                                                                                                                                 6.000
     20.000
     10.000                                                                                                                      3.000
                                                 -53%   -56%
                                                                         -41%     -15%
                                                                                                    -79% -75%
                  Blue whiting                     Herring           Mussel Mytilus spp.         European flounder
                                                  Volume (tonnes)               Value (EUR 1000)
Percentages show change from the previous year.

Table 7.       FIRST SALES OF THE MAIN COMMERCIAL SPECIES IN ESTONIA

                              First-sales           First-sales          Main contributing species
                              value / trend %       volume / trend %
          Estonia

    Jan-Mar 2021 vs           EUR 5,4 million,      24.481 tonnes,       Sprat, herring.
    Jan-Mar 2020              +20%                  +44%
    Mar 2021 vs               EUR 1,5 million,      7.383 tonnes,        Herring, sprat, pike-perch.
    Mar 2020                  +3%                   +9%                  Smelt was the main species that offset the increasing trend.

Figure 5.      FIRST SALES OF THE MAIN COMMERCIAL SPECIES IN ESTONIA, MARCH 2021

       5.000      +16%                                                                                                          1.000
                          +17%
       4.000                                                                                                                    800
       3.000                                     +10% +23%                                                                      600
       2.000                                                                                                                    400
       1.000                                                                                                                    200
                                                                         +21%     +27%            -92%      -88%

                    Herring                        Sprat                 Pike-perch                   Smelt

                                                  Volume (tonnes)              Value (EUR 1000)

Percentages show change from the previous year.

Table 8.       FIRST SALES OF THE MAIN COMMERCIAL SPECIES IN FRANCE

                         First-sales         First-sales     Main                 Notes
                         value /             volume /        contributing
         France          trend %             trend %         species

    Jan-Mar 2021         EUR 141,4           42.689          Scallop, Norway      The increase in first sales of Norway lobster is related to the
    vs                   million,            tonnes,         lobster, monk.       boom-and-bust dynamics of the species as well as low
    Jan-Mar 2020         +8%                 +10%                                 capture rates in March 2020. In fact, the figures for volume
    Mar 2021 vs          EUR 50,7            15.264          Scallop, Norway      and value are at the average of the last 10 years. First sales
    Mar 2020             million,            tonnes,         lobster, monk,       increase of scallop could be explained by record quantities of
                         +46%                +36%            common sole.         exploitable biomass (in Bay of Seine and the Bay of Saint-
                                                                                  Brieuc), and a corresponding increase in scallops' quota 5 from
                                                                                  4.500 to 6.300 tons for the Bay of Saint-Brieuc fishery.

5
    https://cdpmem22.fr/pecher-en-cotes-darmor/coquille-saint-jacques/

                                  Overview | 1. First sales in Europe | 2. Extra-EU imports | 3. Consumption
                                                                                                                                               6
                           | 4.    EU trade in 2020 | 5. Whelks in the European market | 6. Global highlights         |
                                                           7. Macroeconomic context
European Market Observatory for                                                                    MONTHLY HIGHLIGHTS | NO.6/2021
    Fisheries and Aquaculture Products                                                                            FIRST SALES IN EUROPE

Figure 6.        FIRST SALES OF THE MAIN COMMERCIAL SPECIES IN FRANCE, MARCH 2021

                             +76%
         4.000      +65%                                                                                                                  8.000

         3.000                                                                                                        +26%                6.000
                                                                                         +37%
         2.000                                             +123%                                                                          4.000
                                                                               +49%
         1.000                                                                                              +63%                          2.000
                                                  +116%

                       Scallop                    Norway lobster                   Monk                     Common sole

                                                  Volume (tonnes)                   Value (EUR 1000)
Percentages show change from the previous year.

Table 9.         FIRST SALES OF THE MAIN COMMERCIAL SPECIES IN ITALY

                      First-sales             First-sales              Main                  Notes
                      value / trend %         volume / trend %         contributing
         Italy                                                         species

    Jan-Mar 2021      EUR 69,5 million,       16.629 tonnes,           Anchovy, sardine.     The increase in first sales of sardine and anchovy
    vs                +7%                     0%                                             in March 2021 is an effect of the COVID-19
    Jan-Mar 2020                                                                             lockdown in March 2020. In March 2020, most of
    Mar 2021 vs       EUR 28,3 million,       6.459 tonnes,            Anchovy,              the Italian purse seine and pelagic pair-trawl fleets
    Mar 2020          +94%                    +78%                     miscellaneous         targeting small pelagics were less active due to
                                                                       shrimps*, sardine,    sanitary restrictions. Moreover, a collapse of
                                                                       Norway lobster.       demand for seafood due to the closure of fish
                                                                                             markets and restaurants was observed. This
                                                                                             caused the drop of prices and the reduction of
                                                                                             direct sales 6. In 2021, fishing effort returned to
                                                                                             similar levels as before the pandemic.

Figure 7.        FIRST SALES OF THE MAIN COMMERCIAL SPECIES IN ITALY, MARCH 2021

     1.500    +115% +162%                                                                                                                5.000
                                                                            +214%
     1.200                                             +129%                                                                             4.000
      900                                                                                                                                3.000
      600                                                                                                           +119%                2.000
                                                                                      +212%
      300                                    +103%                                                        +80%                           1.000

                  Anchovy                 Miscellaneous shrimps*              Sardine                    Norway lobster

                                             Volume (tonnes)                            Value (EUR 1000)
Percentages show change from the previous year. *EUMOFA aggregation for species.

6
    http://www.fao.org/documents/card/en/c/ca8637en/

                                  Overview | 1. First sales in Europe | 2. Extra-EU imports | 3. Consumption
                                                                                                                                                     7
                           | 4.    EU trade in 2020 | 5. Whelks in the European market | 6. Global highlights           |
                                                           7. Macroeconomic context
European Market Observatory for                                                                            MONTHLY HIGHLIGHTS | NO.6/2021
 Fisheries and Aquaculture Products                                                                                    FIRST SALES IN EUROPE

Table 10. FIRST SALES OF THE MAIN COMMERCIAL SPECIES IN LATVIA
                           First-sales            First-sales                Main contributing species
                           value / trend %        volume / trend %
         Latvia

 Jan-Mar 2021 vs           EUR 3,4 million,       16.227 tonnes,             Herring, other marine fish*.
 Jan-Mar 2020              +30%                   +21%
 Mar 2021 vs               EUR 1,4 million,       6.843 tonnes,              Herring, other marine fish*.
 Mar 2020                  +15%                   +21%                       Sprat was the main species that offset the overall increasing
                                                                             trend in both value and volume.

Figure 8.      FIRST SALES OF THE MAIN COMMERCIAL SPECIES IN LATVIA, MARCH 2021

     4.000        +80%                                                                                                                       800
                                 +76%
                                                                                                                      -12%
     3.000                                                                                            -16%                                   600

     2.000                                                                                                                                   400

     1.000                                                                                                                                   200
                                                            +94%           +91%
                       Herring                             Other marine fish*                                Sprat
                                              Volume (tonnes)                      Value (EUR 1000)
Percentages show change from the previous year. *EUMOFA aggregation for species.

Table 11. FIRST SALES OF THE MAIN COMMERCIAL SPECIES IN LITHUANIA

                           First-sales          First-sales                Main contributing species
                           value / trend        volume/ trend %
       Lithuania           %

 Jan-Mar 2021 vs           EUR 0,6 million,     1.023 tonnes,              Smelt, herring, sprat.
 Jan-Mar 2020              +73%                 +58%
 Mar 2021 vs               EUR 0,2 million,     298 tonnes,                Value: smelt.
 Mar 2020                  +36%                 -8%                        Volume: herring, sprat.

Figure 9.      FIRST SALES OF THE MAIN COMMERCIAL SPECIES IN LITHUANIA, MARCH 2021

                                                           -7%
        250                                                                                                                              150
        200                      +138%                                                                                                   120
        150                                                                                                                              90
                                                                           -15%
        100                                                                                                                              60
          50       +42%                                                                                                                  30
                                                                                                      -43%          -34%

                         Smelt                                   Herring                                    Sprat
                                              Volume (tonnes)                      Value (EUR 1000)
Percentages show change from the previous year. *EUMOFA aggregation for species.

                                 Overview | 1. First sales in Europe | 2. Extra-EU imports | 3. Consumption
                                                                                                                                                   8
                          | 4.    EU trade in 2020 | 5. Whelks in the European market | 6. Global highlights               |
                                                          7. Macroeconomic context
European Market Observatory for                                                                           MONTHLY HIGHLIGHTS | NO.6/2021
 Fisheries and Aquaculture Products                                                                                   FIRST SALES IN EUROPE

Table 12. FIRST SALES OF THE MAIN COMMERCIAL SPECIES IN THE NETHERLANDS
                         First-sales              First-sales              Main contributing              Notes
                         value / trend %          volume / trend %         species
        The
    Netherlands

 Jan-Mar 2021            EUR 63,1 million,        45.868 tonnes,           Mackerel, herring,             Shrimp Crangon spp. life history is
 vs                      -23%                     -15%                     shrimp Crangon spp.,           characterized by a short life span of at
 Jan-Mar 2020                                                              common sole, European          most two years. Production largely
                                                                           plaice.                        depends on annual recruitment levels,
 Mar 2021 vs             EUR 26,7 million,        19.010 tonnes,           Mackerel, shrimp               which can fluctuate greatly. According
 Mar 2020                -9%                      -7%                      Crangon spp. European          to ICES 7, strong fishing pressures on the
                                                                           plaice, gurnard.               stock, as well as a high abundance of
                                                                                                          whiting - a predator of shrimp - have
                                                                                                          led to the decline in stock size. The
                                                                                                          decrease in mackerel sales occurs in a
                                                                                                          context of rather good stock status and
                                                                                                          a lower quota of 65% compared to
                                                                                                          2020 (which saw a temporary fishing
                                                                                                          agreement prior to Brexit), bearing in
                                                                                                          mind that monthly production of
                                                                                                          mackerel is highly variable, mostly due
                                                                                                          to natural fluctuations and changes in
                                                                                                          fishing strategies (especially the
                                                                                                          location of fishing).

Figure 10. FIRST SALES OF THE MAIN COMMERCIAL SPECIES IN THE NETHERLANDS, MARCH 2021

     800       -85%                                                                     -18%                                                 1.500
                                                                             -4%
     600                                                                                                                                     1.200
                                                                                                                                             900
     400                  -85%                           -80%
                                                                                                                                             600
     200                                      -83%                                                                                           300
                                                                                                            -44% -28%

                 Mackerel                 Shrimp     Crangon spp.           European plaice                    Gurnard

                                                    Volume (tonnes)                   Value (EUR 1000)
Percentages show change from the previous year.

Table 13. FIRST SALES OF THE MAIN COMMERCIAL SPECIES IN NORWAY

                              First-sales               First-sales               Main contributing species
                              value / trend %           volume / trend %
         Norway

 Jan-Mar 2021 vs              EUR 822,1 million,        964.737 tonnes,           Value: cod, mackerel, blue whiting.
 Jan-Mar 2020                 -8%                       +4%                       Volume: miscellaneous small pelagics*, herring, other
                                                                                  crustaceans*.
 Mar 2021 vs                  EUR 295,7 million         377.603 tonnes,           Value: cod, blue whiting.
 Mar 2020                     -3%                       +5%                       Volume: cod, other crustaceans, haddock.

7
  ICES. 2019. Report of the Working Group on Crangon Fisheries and Life History (WGCRAN), 9–11 October 2018, ICES. ICES CM 2018/EPDSG:06. 68 p.p..
https://doi.org/10.17895/ices.pub.8105

                                  Overview | 1. First sales in Europe | 2. Extra-EU imports | 3. Consumption
                                                                                                                                                       9
                           | 4.    EU trade in 2020 | 5. Whelks in the European market | 6. Global highlights                |
                                                           7. Macroeconomic context
European Market Observatory for MONTHLY HIGHLIGHTS | NO.6/2021
Fisheries and Aquaculture Products FIRST SALES IN EUROPE
Figure 11. FIRST SALES OF THE MAIN COMMERCIAL SPECIES IN NORWAY, MARCH 2021
180.000 -7% -10% 180.000
150.000 150.000
120.000 +23% 120.000
90.000 90.000
60.000 -22% 60.000
+54% +16% +14%
30.000 30.000
+32%
Cod Blue whiting Other crustaceans* Haddock
Volume (tonnes) Value (EUR 1000)
Percentages show change from the previous year. *EUMOFA aggregation for species (Metadata 2, Annex 3: http://eumofa.eu/supply-balance-and-other-
methodologies).
Table 14. FIRST SALES OF THE MAIN COMMERCIAL SPECIES IN POLAND
First-sales First-sales Main contributing Notes
value / trend volume / trend species
Poland % %
Jan-Mar 2021 EUR 3,7 million, 15.659 tonnes, Sprat, herring, European One reason for the decrease of herring first
vs -61% -62% flounder. sales is the reduction in total allowable
Jan-Mar 2020 catches (TAC) for the Polish fleet in multiple
Mar 2021 vs EUR 0,3 million 1.244 tonnes, Sprat, herring, European regions by 43% in 2021 8 compared to
Mar 2020 -93% -94% flounder. 2020 9. It could be indicative that, due to
Salmon was among the decreases in market demand, local herring
few species that slightly suppliers provided fish to the foreign market,
offset the overall therefore such sales are not included in
decreasing trend. Poland’s first sales data. Sprat sales
decreased as catches of sprat and herring in
the Baltic Sea region are always mixed,
therefore local suppliers have probably
provided sprat to the foreign market, as well
as other species mixed with herring in
catches.
Figure 12. FIRST SALES OF THE MAIN COMMERCIAL SPECIES IN POLAND, MARCH 2021
1.200 -91% -91% 250
900 200
150
600
+90% 100
300 -96% -97%
50
-99,8% -99,8% +87%
Sprat Herring European flounder Salmon
Volume (tonnes) Value (EUR 1000)
Percentages show change from the previous year.
8
COUNCIL REGULATION (EU) 2021/92 of 28 January 2021 https://eur-lex.europa.eu/legal-content/EN/TXT/?uri=CELEX%3A32021R0092
9
COUNCIL REGULATION (EU) 2020/123 of 27 January 2020 https://eur-lex.europa.eu/legal-content/EN/TXT/?uri=CELEX%3A32020R0123
Overview | 1. First sales in Europe | 2. Extra-EU imports | 3. Consumption
10
| 4. EU trade in 2020 | 5. Whelks in the European market | 6. Global highlights |
7. Macroeconomic contextEuropean Market Observatory for MONTHLY HIGHLIGHTS | NO.6/2021
Fisheries and Aquaculture Products FIRST SALES IN EUROPE
Table 15. FIRST SALES OF THE MAIN COMMERCIAL SPECIES IN PORTUGAL
First-sales First-sales Main contributing species
value / trend % volume / trend %
Portugal
Jan-Mar 2021 vs EUR 51,6 million, 14.150 tonnes, Octopus, swordfish, bluefin tuna, clam, other horse mackerel
Jan-Mar 2020 +8% +1% (other than Atlantic horse mackerel) *.
Mar 2021 vs EUR 23,0 million 6.350 tonnes, Octopus, other seabream (other than gilthead seabream)*,
Mar 2020 +68% +45% swordfish, clam, other horse mackerel (other than Atlantic horse
mackerel).
Figure 13. FIRST SALES OF THE MAIN COMMERCIAL SPECIES IN PORTUGAL, MARCH 2021
800 +107% 5.000
+73% +220% 4.000
600
3.000
400
+38% +104% 2.000
200 +74% +173%
+231% 1.000
Octopus Seabream, other* Swordfish Horse mackerel, other*
Volume (tonnes) Value (EUR 1000)
Percentages show change from the previous year. *EUMOFA aggregation for species
Table 16. FIRST SALES OF THE MAIN COMMERCIAL SPECIES IN SPAIN
First-sales First-sales Main contributing Notes
value / trend in % volume / trend % species
Spain
Jan-Mar 2021 vs EUR 292,4 million, 103.911 tonnes, Hake, skipjack tuna, The increase in first sales of anchovy
Jan-Mar 2020 -7% -10% mackerel, other was due to high recruitment in 2020.
sharks*, other marine The volume figures show an increase
fish*, clam, Atlantic that is supported by scientific
horse mackerel. observations, confirming an
Mar 2021 vs EUR 129,1 million 55.579 tonnes, Anchovy, swordfish, abundance of the species in the Bay of
Mar 2020 +17% +4% deep-water rose Biscay. While both volume and value
shrimp, octopus, blue increase, the trend in value is
whiting. influenced by the species, the markets,
and the processing capacity. As a
significant part of the catches are
processed, the capability to deal with
such increase is limited. This fact
affects the value.
Overview | 1. First sales in Europe | 2. Extra-EU imports | 3. Consumption
11
| 4. EU trade in 2020 | 5. Whelks in the European market | 6. Global highlights |
7. Macroeconomic contextEuropean Market Observatory for MONTHLY HIGHLIGHTS | NO.6/2021
Fisheries and Aquaculture Products FIRST SALES IN EUROPE
Figure 14. FIRST SALES OF THE MAIN COMMERCIAL SPECIES IN SPAIN, MARCH 2021
10.000 +122% 10.000
+340% +74%
8.000 8.000
6.000 +56% 6.000
+83%
4.000 4.000
2.000 +55% 2.000
+81% +40%
Anchovy Swordfish Deep-water rose shrimp Octopus
Volume (tonnes) Value (EUR 1000)
Percentages show change from the previous year. *EUMOFA aggregation for species
Table 17. FIRST SALES OF THE MAIN COMMERCIAL SPECIES IN SWEDEN
First-sales First-sales Main contributing Notes
value / trend in % volume / trend in % species
Sweden
Jan-Mar 2021 vs EUR 18,1 million, 47.483 tonnes, Value: Herring, sprat, One of the reasons for a significant
Jan-Mar 2020 0% +14% coldwater shrimp. reduction of sales of herring and
Volume: sprat. sprat in 2021 might be a reduction
Mar 2021 vs EUR 3,6 million, 2.998 tonnes, Herring, sprat, saithe, of their quotas 10 by 26% and 24%,
Mar 2020 -51% -85% other marine fish*, cod. respectively, when accounting for
the Swedish fleet operating in
different waters.
Figure 15. FIRST SALES OF THE MAIN COMMERCIAL SPECIES IN SWEDEN, MARCH 2021
1.500 -87% 800
-75% -85%
1.200 600
900
400
600 -84%
300 200
-93% -18%
-94% -93%
Herring Sprat Saithe Other marine fish*
Volume (tonnes) Value (EUR 1000)
Percentages show change from the previous year. *EUMOFA aggregation for species
Table 18. FIRST SALES OF THE MAIN COMMERCIAL SPECIES IN THE UNITED KINGDOM
First-sales First-sales Main contributing species
value / trend % volume / trend %
The United Kingdom
Jan-Marc 2021 vs EUR 121,8 million, 83.285 tonnes, Mackerel, cod, saithe, haddock, hake, blue whiting.
Jan-Marc 2020 -13% -3%
Mar 2021 vs EUR 32,6 million, 20.874 tonnes, Value: Norway lobster, scallop, monk.
Marc 2020 +15% -11% Volume: blue whiting, mackerel, saithe.
10
COUNCIL REGULATION (EU) 2021/92 of 28 January 2021 https://eur-lex.europa.eu/legal-content/EN/TXT/?uri=CELEX%3A32021R0092
Overview | 1. First sales in Europe | 2. Extra-EU imports | 3. Consumption
12
| 4. EU trade in 2020 | 5. Whelks in the European market | 6. Global highlights |
7. Macroeconomic contextEuropean Market Observatory for MONTHLY HIGHLIGHTS | NO.6/2021
Fisheries and Aquaculture Products FIRST SALES IN EUROPE
Figure 16. FIRST SALES OF THE MAIN COMMERCIAL SPECIES IN THE UNITED KINGDOM, FEBRUARY 2021
8.000 +60% 8.000
-33%
6.000 6.000
+26%
4.000 +28% 4.000
+65%
+41% -32%
2.000 +42% 2.000
Norway lobster Scallop Monk Blue whiting
Volume (tonnes) Value (EUR 1000)
Percentages show change from the previous year.
1.4. Comparison of first-sales prices of selected species in selected countries11
Figure 17. FIRST-SALES PRICES OF COMMON PRAWN IN DENMARK, FRANCE, AND THE NETHERLANDS
18,00
16,00
14,00
12,00
10,00
EUR/kg
8,00
6,00
4,00
2,00
0,00
2018-M04
2018-M05
2018-M06
2018-M07
2018-M08
2018-M09
2018-M10
2018-M11
2018-M12
2019-M01
2019-M02
2019-M03
2019-M04
2019-M05
2019-M06
2019-M07
2019-M08
2019-M09
2019-M10
2019-M11
2019-M12
2020-M01
2020-M02
2020-M03
2020-M04
2020-M05
2020-M06
2020-M07
2020-M08
2020-M09
2020-M10
2020-M11
2020-M12
2021-M01
2021-M02
2021-M03
Denmark France Netherlands
EU first sales of common prawn 12 occur in multiple countries, including Denmark, France, and the Netherlands. In March
2021 (the most recent available data), the average first-sales prices of common prawn were 6,24 EUR/kg in Denmark (up
from both the previous month and year by 18% and 34%, respectively); 8,26 EUR/kg in France (30% lower than February
2021, and 10% higher than March 2020); and 3,47 EUR/kg in the Netherlands (up from both the previous month and year by
14% and 45%, respectively). In Denmark and France, the price spikes correlated with drops in supply from the previous month.
In March 2021, supply decreased in Denmark and the Netherlands (-59% and -9%, respectively), and increased in France
(+46%), relative to the previous year. Volumes sold in the three markets are seasonal. In Denmark and the Netherlands, they
peak in June–August, and in France in the winter months (November through February). Over the past 36 months, common
prawn prices showed an upward trend in France and the opposite trend in Denmark and the Netherlands. At the same time,
supply declined in all the three countries.
11
First sales data updated on 17.5.2021.
12
Common prawn (Palaemon serratus) is a species included in the “Shrimp, miscellaneous” main commercial species (ERS code: CPR).
Overview | 1. First sales in Europe | 2. Extra-EU imports | 3. Consumption
13
| 4. EU trade in 2020 | 5. Whelks in the European market | 6. Global highlights |
7. Macroeconomic contextEuropean Market Observatory for MONTHLY HIGHLIGHTS | NO.6/2021
Fisheries and Aquaculture Products FIRST SALES IN EUROPE
Figure 18. FIRST-SALES PRICES OF LEMON SOLE IN BELGIUM, DENMARK, AND FRANCE
10,00
8,00
6,00
EUR/kg
4,00
2,00
0,00
2018-M04
2018-M05
2018-M06
2018-M07
2018-M08
2018-M09
2018-M10
2018-M11
2018-M12
2019-M01
2019-M02
2019-M03
2019-M04
2019-M05
2019-M06
2019-M07
2019-M08
2019-M09
2019-M10
2019-M11
2019-M12
2020-M01
2020-M02
2020-M03
2020-M04
2020-M05
2020-M06
2020-M07
2020-M08
2020-M09
2020-M10
2020-M11
2020-M12
2021-M01
2021-M02
2021-M03
Belgium Denmark France
EU first sales of lemon sole 13 occur predominantly in Denmark, as well as in France and Belgium. In March 2021, the
average first-sales prices of lemon sole were: 3,51 EUR/kg in Belgium (10% down from the previous month and 17% up from
the previous year); 6,08 EUR/kg in Denmark (up from both the previous month and year by 15% and 38%, respectively); and
4,93 EUR/kg in France (19% lower than February 2021, and 10% higher than March 2020). In Belgium and Denmark, the price
spikes correlated with drops in supply from the previous month. In March 2021, supply decreased by 57% in Denmark, and
increased in Belgium (+50%), and France (+46%), relative to the previous year. Supply is seasonal, with peaks in April and
November in Belgium, June–July in Denmark, and May–July in France. Over the 36-month period, lemon sole prices exhibited
different trends: a downward trend in Belgium, a slightly increasing trend in Denmark, and an increasing trend in France.
During the same period, supply showed a decreasing trend in all the three countries.
Figure 19. FIRST-SALES PRICES OF WEEVER IN FRANCE, ITALY, AND SPAIN
7,00
6,00
5,00
4,00
EUR/kg
3,00
2,00
1,00
0,00
2018-M04
2018-M05
2018-M06
2018-M07
2018-M08
2018-M09
2018-M10
2018-M11
2018-M12
2019-M01
2019-M02
2019-M03
2019-M04
2019-M05
2019-M06
2019-M07
2019-M08
2019-M09
2019-M10
2019-M11
2019-M12
2020-M01
2020-M02
2020-M03
2020-M04
2020-M05
2020-M06
2020-M07
2020-M08
2020-M09
2020-M10
2020-M11
2020-M12
2021-M01
2021-M02
2021-M03
France Italy Spain
EU first sales of weever occur predominantly in Spain, as well as in France and Italy. In March 2021, the average first-
sales prices of weever were: 1,62 EUR/kg in France (down from both the previous month and year by 34% and 40%,
respectively); 3,54 EUR/kg in Italy (–20% from February 2021, and +21% from March 2020); and 3,45 EUR/kg in Spain
(10% higher than February 2021, and 47% up from March 2020). In March 2021, supply increased in all three countries
compared to March 2020: +138% in France, +1089% in Italy, and +12% in Spain. Supply is seasonal with similar peaks
in all three countries, from June to August. Prices exhibited a downward trend in all three markets. Over the past three
years, supply rose remarkably in Italy (most notably since May 2020), and had a downward trend in France and Spain.
13
Lemon sole (Microsmus kit) is a species included in the “Sole, other” main commercial species (ERS code: LEM).
Overview | 1. First sales in Europe | 2. Extra-EU imports | 3. Consumption
14
| 4. EU trade in 2020 | 5. Whelks in the European market | 6. Global highlights |
7. Macroeconomic contextEuropean Market Observatory for MONTHLY HIGHLIGHTS | NO.6/2021
Fisheries and Aquaculture Products FIRST SALES IN EUROPE
1.5. Commodity group of the month: Flatfish 14
Figure 20. FIRST-SALES COMPARISON AT CG, MCS, AND ERS LEVELS FOR REPORTING COUNTRIES 15, JANUARY
2018 - MARCH 2021
2,0
40,0
1,5
Value (million EUR)
30,0
Value (million EUR)
1,0
20,0
0,5
10,0
0,0 0,0
2018 2019 2020 2021
2018 2019 2020 2021
Flatfish (CG) European flounder (MCS)
Megrim (MCS) Megrim (ERS) Megrim (ERS) European flounder (ERS)
European flounder (ERS)
The “flatfish” commodity group (CG 16) recorded the fifth-highest first-sales value and the sixth-highest volume out of the
10 CGs recorded in March 2021 17. Of reporting countries covered by EUMOFA database, first sales of flatfish reached a value
of EUR 32,9 million and a volume of 6.953 tonnes, representing a value increase of 4% and a volume decrease of 35%
compared to March 2020. In the past 36 months, the highest first-sales value of flatfish was registered at EUR 41,4 million
(May 2018).
The flatfish commodity group includes 13 main commercial species (MCS): Atlantic halibut, brill, common sole, other soles,
dab, European flounder, other flounders, European plaice, other plaices, Greenland halibut, megrim, turbot, and the grouping
“other flatfish”.
At Electronic Recording and Reporting System (ERS) level, European flounder (3%) and megrim (1%) together accounted for
4% of "flatfish" total first-sales value recorded in March 2021.
14
First sales data updated on 17.5.2021.
15
Norway and the UK excluded from the analyses.
16
Annex 3: http://eumofa.eu/supply-balance-and-other-methodologies
17
More data on commodity groups can be found in Table 1.2 of the Annex.
Overview | 1. First sales in Europe | 2. Extra-EU imports | 3. Consumption
15
| 4. EU trade in 2020 | 5. Whelks in the European market | 6. Global highlights |
7. Macroeconomic contextEuropean Market Observatory for MONTHLY HIGHLIGHTS | NO.6/2021
Fisheries and Aquaculture Products FIRST SALES IN EUROPE
1.6. Focus on European flounder
The European flounder (Platichthys flesus) is a demersal fish species in the right-eye
flounders family Pleuronectidae. In about 30% percent of individuals, eyes move to the left
and the left side becomes uppermost. The species is found in European coastal waters from
the White Sea in the north to the Mediterranean and the Black Sea in the south. It has been
introduced into the waters of the United States and Canada accidentally through transport
in ballast water18. European flounder is a migratory fish, and is found in estuaries for most
Source: Scandinavian Fishing Year Book
of the year. Adults occur on muddy and sandy bottoms in shallow marine or brackish waters,
and also enter fresh waters. During winter, adults retreat to deeper, warmer waters, where they spawn in spring. Juveniles
over a year old and adults feed on benthic fauna. The species has a maximum length of about 60 cm, with a maximum
published weight of 2,9 kg and a maximum reported age of 15 years 19.
The European flounder is caught by bottom trawling and is directly targeted in some fisheries, whereas in others (the North
Sea) it is retained as a bycatch 20. In EU waters, management measures comprise Total Allowable Catches, and minimum
reference sizes in the Baltic Sea of 18 cm (sub-divisions 29-32, south of 59°), 21 cm (sub-divisions 26-28), and 23 cm (sub-
divisions 22-25). Additionally, technical measures include restriction on fisheries in designated areas from February to May
and minimum mesh size of at least 80 mm 21.
Selected countries
Table 19. COMPARISON OF EUROPEAN FLOUNDER FIRST-SALES PRICES, MAIN PLACES OF SALE, AND
CONTRIBUTION TO OVERALL SALES OF "FLATFISH" IN SELECTED COUNTRIES
Changes in European Contribution of European
European flounder first sales flounder to total Principal places of sale
Jan-Mar 2021 (%) “flatfish” first sales in Jan-Mar 2021 in terms
flounder
Compared to Compared to March 2021 (%) of first-sales value
Jan-Mar Jan-Mar
2020 2019
Denmark Value -60% -62% 2% Hvide Sande, Neksø,
Grenaa.
Volume -68% -64% 17%
Netherlands Value -67% -70% 1% IJmuiden/Velsen,
Scheveningen, Vlissingen.
Volume -26% -29% 7%
Poland Value -64% -72% 99% Kolobrzeg, Międzyrzecz,
Wladyslawowo.
Volume -58% -56% 99%
18
https://www.fishbase.de/summary/Platichthys-flesus.html
19
https://www.fishbase.de/summary/Platichthys-flesus.html
20
https://www.geintegreerdevisserij.nl/wp-content/uploads/ices-advies-bot.pdf
21
Regulation (EU) 2019/1241 https://eur-lex.europa.eu/legal-content/EN/TXT/?uri=CELEX%3A02019R1241-20210101
Overview | 1. First sales in Europe | 2. Extra-EU imports | 3. Consumption
16
| 4. EU trade in 2020 | 5. Whelks in the European market | 6. Global highlights |
7. Macroeconomic contextEuropean Market Observatory for MONTHLY HIGHLIGHTS | NO.6/2021
Fisheries and Aquaculture Products FIRST SALES IN EUROPE
Figure 21. EUROPEAN FLOUNDER: FIRST SALES IN DENMARK, APRIL 2018 - MARCH 2021
1.500 400,0
1.200
300,0
Volume
900
200,0
Value
600
100,0
300
0 0,0
Feb
Feb
Feb
May
Mar
May
Mar
May
Mar
Aug
Aug
Apr
Sep
Dec
Aug
Apr
Sep
Dec
Apr
Sep
Dec
Jun
Oct
Jul
Jun
Oct
Jun
Oct
Jan
Jul
Jan
Jul
Jan
Nov
Nov
Nov
2018 2019 2020 2021
Volume (tonnes) Value (1000 EUR)
Over the past 36 months, the highest first-sales value of European flounder in Denmark occurred in March 2020 when
1.399 tonnes were sold. Typically, first sales were higher in the first half of the year during spring.
Figure 22. FIRST SALES: COMPOSITION OF “FLATFISH” (ERS LEVEL) IN DENMARK IN VALUE AND VOLUME,
MARCH 2021
Witch Common sole
flounder 4%
European 6%
Other Common sole flounder Other European
20% 15% 2% 10% flounder
Witch 17%
flounder
7%
Total value
EUR 4,2 mil Total volume
1.718 tonnes
European plaice
56% European plaice
63%
Figure 23. EUROPEAN FLOUNDER: FIRST SALES IN THE NETHERLANDS, APRIL 2018 - MARCH 2021
300 250,00
250 200,00
200
Volume
150,00
150
Value
100,00
100
50 50,00
0 0,00
Feb
Feb
Feb
May
Mar
May
Mar
May
Mar
Aug
Aug
Apr
Sep
Dec
Apr
Sep
Dec
Aug
Apr
Sep
Dec
Jun
Oct
Jul
Jun
Oct
Jan
Jul
Jun
Oct
Jan
Jul
Jan
Nov
Nov
Nov
2018 2019 2020 2021
Volume (tonnes) Value (1000 EUR)
Over the past 36 months in the Netherlands, the highest first sales of common European flounder were in February
and March each year, peaking in February 2019 when 284 tonnes were sold.
Overview | 1. First sales in Europe | 2. Extra-EU imports | 3. Consumption
17
| 4. EU trade in 2020 | 5. Whelks in the European market | 6. Global highlights |
7. Macroeconomic contextEuropean Market Observatory for MONTHLY HIGHLIGHTS | NO.6/2021
Fisheries and Aquaculture Products FIRST SALES IN EUROPE
Figure 24. FIRST SALES: COMPOSITION OF “FLATFISH” (ERS LEVEL) IN THE NETHERLANDS IN VALUE AND
VOLUME, MARCH 2021
Other European flounder
2% European flounder 7%
1%
Other
Turbot 12%
16%
Turbot
7%
European Common
plaice sole
Total value Total volume
15% 38%
EUR 8,5 mil 1.855 tonnes
European
Common sole plaice
66% 36%
Figure 25. EUROPEAN FLOUNDER: FIRST SALES IN POLAND, APRIL 2018 - MARCH 2021
4.000 1.200,00
3.000 900,00
Volume
2.000 600,00
Value
1.000 300,00
0 0,00
Feb
Feb
Feb
May
Aug
Mar
May
Aug
Mar
May
Apr
Sep
Dec
Apr
Sep
Dec
Aug
Mar
Apr
Sep
Dec
Jun
Oct
Jul
Jun
Oct
Oct
Jan
Jul
Jun
Jan
Jul
Jan
Nov
Nov
Nov
2018 2019 2020 2021
Volume (tonnes) Value (1000 EUR)
Over the past 36 months in Poland, the highest first-sales volume of European flounder occurred in March 2020 when
3.679 tonnes were sold. The most intense fishery season occurs in the spring.
Figure 26. FIRST SALES: COMPOSITION OF “FLATFISH” (ERS LEVEL) IN POLAND IN VALUE AND VOLUME,
MARCH 2021
European plaice European plaice
0,5% 0,2%
Total volume
Total value 7 tonnes
EUR 1,429
European European
flounder flounder
99,5% 99,8%
Overview | 1. First sales in Europe | 2. Extra-EU imports | 3. Consumption
18
| 4. EU trade in 2020 | 5. Whelks in the European market | 6. Global highlights |
7. Macroeconomic contextEuropean Market Observatory for MONTHLY HIGHLIGHTS | NO.6/2021
Fisheries and Aquaculture Products FIRST SALES IN EUROPE
Price trend
Figure 27. EUROPEAN FLOUNDER: FIRST-SALES PRICES IN SELECTED COUNTRIES, APRIL 2018 - MARCH 2021
1,20
1,00
0,80
EUR/kg
0,60
0,40
0,20
0,00
Feb
Feb
Feb
May
May
Mar
Aug
Mar
May
Aug
Apr
Sep
Dec
Aug
Mar
Apr
Sep
Dec
Apr
Sep
Dec
Jun
Oct
Jul
Jun
Oct
Jun
Oct
Jan
Jul
Jan
Jul
Jan
Nov
Nov
Nov
2018 2019 2020 2021
Denmark Netherlands Poland
Over the 36-month observation period (April 2018 to March 2021), the weighted average first-sales price of European
flounder in the Netherlands was 0,69 EUR/kg, 108% higher than in Poland (0,33 EUR/kg), and 83% greater than that
of Denmark (0,39 EUR/kg).
In Denmark in March 2021, the average first-sales price of European flounder (0,30 EUR/kg) increased by 24% compared
with March 2020, and 9% compared with March 2019. Over the past 36 months, average price ranged
from 0,22 EUR/kg for 807 tonnes in May 2019, to 1,04 EUR/kg for 43 tonnes in October 2020.
In the Netherlands in March 2021, the average first-sales price of European flounder (0,37 EUR/kg) decreased
by 44% and 52%, compared to of the same month in 2020 and 2019 respectively. During the observed period, the lowest
average price (0,26 EUR/kg for 138 tonnes) was seen in June 2020, while the highest average price was recorded in
November 2018 at 1,10 EUR/kg for 60 tonnes.
In Poland in March 2021, the average first-sales price of European flounder (0,19 EUR/kg) decreased by 24% compared
to March 2020 and by 39% relative to March 2019. During the observed period, the lowest average price of 0,19 EUR/kg
for 7 tonnes was seen in March 2021, while the highest average price was recorded in December 2018, at 0,59 EUR/kg
for 649 tonnes.
Overview | 1. First sales in Europe | 2. Extra-EU imports | 3. Consumption
19
| 4. EU trade in 2020 | 5. Whelks in the European market | 6. Global highlights |
7. Macroeconomic contextEuropean Market Observatory for MONTHLY HIGHLIGHTS | NO.6/2021
Fisheries and Aquaculture Products FIRST SALES IN EUROPE
1.7. Focus on megrim
The megrim, megrim sole, whiff, or Cornish sole (Lepidorhombus whiffiagonis) is a
demersal fish species of left-eyed flatfish in the family Scophthalmidae. The species is
found in the northeast Atlantic and Mediterranean Sea between 100 and 700 m below sea
level 22. The megrim is usually found over a sandy or muddy sea floor. This species spawns
at the end of spring and beginning of summer 23. The megrim feeds on small bottom-living
fishes as well as squids and crustaceans 24. It can reach up to 1.85 kg 25 in weight, and 60
Source: Dolgov Andrey, Polar branch cm in length 26.
of VNIRO (PINRO), Murmansk, Russia
The megrim is an economically valuable species caught by deep-sea bottom trawling and
is directly targeted in some fisheries, whereas in others it is retained as a valuable bycatch.
France and Spain are the largest consumers of this species, with most of the megrim caught in the UK water being exported
to these nations. In the EU, management of this species is set through multiannual plan for the demersal stock (including
megrim) fished in the Western Waters and their adjacent waters 27. Since two megrim species (L. whiffiagonis and L. boscii)
are not totally separated in the landings, a single Total Allowable Catch (TAC) covers both 28. Megrim sold to UK consumers is
often given a different name to make it more appealing, with megrim sole and Cornish sole being two of the most common
alternative names applied 29.
Selected countries
Table 20. COMPARISON OF MEGRIM FIRST-SALES PRICES, MAIN PLACES OF SALE AND CONTRIBUTION TO
OVERALL SALES OF FLATFISH IN SELECTED COUNTRIES
Changes in megrim first sales Contribution of Principal places of sales
Megrim Jan-Mar 2021 (%) megrim to total in Jan-Mar 2021 in
“flatfish” first sales terms of first-sales
Compared to Compared to in March 2021 (%) value
Jan-Mar 2020 Jan-Mar 2019
Denmark Value +385% +351% 1% Hanstholm, Thyborøn,
Skagen.
Volume +275% +219% 1%
France Value -2% -5% 10% Guilvinec, Lorient, Loctudy.
Volume -5% -23% 22%
Spain Value +4493% +1627% 1% Santa Eugenia Ribeira,
Villajoyosa, Motril.
Volume +2487% +864% 1%
22
https://www.fishbase.se/summary/Lepidorhombus-whiffiagonis.html
23
http://www.fao.org/fishery/species/2560/en
24
https://onlinelibrary.wiley.com/doi/abs/10.1111/j.1439-0426.2009.01257.x
25
http://specimenfish.ie/irish-record-fish/marine-species/megrim-lepidorhombus-whiffiagonis/
26
http://www.fao.org/fishery/species/2560/en
27
Council Regulation (EU) 2019/472 https://eur-lex.europa.eu/eli/reg/2019/472/oj
28
https://www.ices.dk/sites/pub/Publication%20Reports/Advice/2020/2020/meg.27.8c9a.pdf
29
https://britishseafishing.co.uk/megrim/#:~:text=Megrim%20is%20a%20fish%20of,it%20is%20caught%20as%20bycatch.
Overview | 1. First sales in Europe | 2. Extra-EU imports | 3. Consumption
20
| 4. EU trade in 2020 | 5. Whelks in the European market | 6. Global highlights |
7. Macroeconomic contextEuropean Market Observatory for MONTHLY HIGHLIGHTS | NO.6/2021
Fisheries and Aquaculture Products FIRST SALES IN EUROPE
Figure 28. MEGRIM: FIRST SALES IN DENMARK, APRIL 2018 - MARCH 2021
20 100,0
16 80,0
Volume
12 60,0
Value
8 40,0
4 20,0
0 0,0
Feb
Feb
Feb
May
Mar
May
Mar
May
Mar
Aug
Aug
Apr
Sep
Dec
Aug
Apr
Sep
Dec
Apr
Sep
Dec
Jun
Oct
Jul
Jun
Oct
Jun
Oct
Jan
Jul
Jan
Jul
Jan
Nov
Nov
Nov
2018 2019 2020 2021
Volume (tonnes) Value (1000 EUR)
In Denmark, over the observed 36-month period, the highest first sales of megrim occurred in August 2019 and February
2021, when 18 tonnes were sold in both months. During the rest of each year, first sales were the lowest in December,
possibly due to unfavourable weather condition among other factors. Megrim sales are generally low, so trends tend to
fluctuate more frequently.
Figure 29. MEGRIM: FIRST SALES IN FRANCE, APRIL 2018 - MARCH 2021
300 1,5
250 1,2
200
Volume
0,9
150
Value
0,6
100
50 0,3
0 0,0
Feb
Feb
Feb
May
Mar
May
Mar
May
Mar
Aug
Apr
Sep
Dec
Aug
Aug
Apr
Sep
Dec
Apr
Sep
Dec
Jun
Oct
Jul
Jun
Oct
Jun
Oct
Jan
Jul
Jan
Jul
Jan
Nov
Nov
Nov
2018 2019 2020 2021
Volume (tonnes) Value (million EUR)
In France, first sales of megrim were the highest in terms of volume among the three surveyed countries. Over the past
36 months, fishing activity fluctuated regularly, with the highest first sales registered in January 2019 when 266 tonnes
were sold. Fishing activity peaks at the beginning of each observed year.
Figure 30. FIRST SALES: COMPOSITION OF “FLATFISH” (ERS LEVEL) IN FRANCE IN VALUE AND VOLUME,
MARCH 2021
Brill Brill
Other 7% Other 5%
14% 19%
Megrim
10% Common
European sole
Total volume 46%
plaice Total value Megrim 1.090 tonnes
2% EUR 8,5 mil 22%
Common sole
67%
European
plaice
8%
Overview | 1. First sales in Europe | 2. Extra-EU imports | 3. Consumption
21
| 4. EU trade in 2020 | 5. Whelks in the European market | 6. Global highlights |
7. Macroeconomic contextEuropean Market Observatory for MONTHLY HIGHLIGHTS | NO.6/2021
Fisheries and Aquaculture Products FIRST SALES IN EUROPE
Figure 31. MEGRIM: FIRST SALES IN SPAIN, APRIL 2018 - MARCH 2021
10 80,0
8
60,0
Volume
6
40,0
Value
4
20,0
2
0 0,0
Feb
Feb
Feb
May
Mar
Aug
Mar
May
Mar
May
Aug
Aug
Apr
Sep
Dec
Apr
Sep
Dec
Apr
Sep
Dec
Jun
Oct
Jul
Jun
Oct
Jun
Oct
Jan
Jul
Jan
Jul
Jan
Nov
Nov
Nov
2018 2019 2020 2021
Volume (tonnes) Value (1000 EUR)
In Spain, over the past 36 months, the highest first sales of megrim were registered in November 2020, when about 10
tonnes were sold. In general, first sales of megrim are low, and fluctuate on a regular basis. From April 2018 to May 2020
there were low registered first sales, possibly due to a change in the reporting system. Indeed, up to May 2020, megrim
(Lepidorhombus whiffiagonis) was not reported in the Bay of Biscay and Iberian coast.
Figure 32. FIRST SALES: COMPOSITION OF “FLATFISH” (ERS LEVEL) IN SPAIN IN VALUE AND VOLUME, MARCH
2021
Common sole
3%
Common Witch
Other sole flounder
11% Other
20% 7% Greenland
13%
Greenland halibut Megrim
Witch halibut 16% 1%
flounder 13%
4%
Total value Total volume
Megrim
EUR 5,6 mil 1.296 tonnes
1%
Megrims nei Megrims nei
51% 60%
Overview | 1. First sales in Europe | 2. Extra-EU imports | 3. Consumption
22
| 4. EU trade in 2020 | 5. Whelks in the European market | 6. Global highlights |
7. Macroeconomic contextEuropean Market Observatory for MONTHLY HIGHLIGHTS | NO.6/2021
Fisheries and Aquaculture Products FIRST SALES IN EUROPE
Price trend
Figure 33. MEGRIM: FIRST-SALES PRICES IN SELECTED COUNTRIES, APRIL 2018 - MARCH 2021
10,00
8,00
6,00
EUR/kg
4,00
2,00
0,00
Feb
Feb
Feb
May
Mar
May
Mar
May
Mar
Aug
Aug
Apr
Sep
Dec
Aug
Apr
Sep
Dec
Apr
Sep
Dec
Jun
Oct
Jul
Jun
Oct
Jun
Oct
Jan
Jul
Jan
Jul
Jan
Nov
Nov
Nov
2018 2019 2020 2021
Denmark France Spain
Over the 36-month observation period (April 2018–March 2021) among the three surveyed countries, the weighted
average first-sales price of megrim was the highest in Spain at 7,22 EUR/kg. That price was 140% greater than in
Denmark (3,01 EUR/kg), and 105% over the weighted average price in France (3,53 EUR/kg).
In Denmark in March 2021, the average first-sales price of megrim (2,32 EUR/kg) decreased
by 40% compared to March 2020 and by 17% compared to March 2019. The lowest average price was registered in July
2019 at 1,27 EUR/kg for 15 tonnes, while the highest average price of 6,27 EUR/kg for 15 tonnes was registered in
January 2021.
In France in March 2021, the average first-sales price of megrim was 3,36 EUR/kg, 17% and 5% lower than in March
2020 and 2019 respectively. The lowest price in the past 36 months was registered in April 2019, at 2,18 EUR/kg for 246
tonnes, while the highest price (6,23 EUR/kg for 170 tonnes) was observed in January 2021.
In Spain in March 2021, the average first-sales price of megrim (8,05 EUR/kg) increased by 91% compared to March
2020 and by 69% compared to March 2019. The lowest average price was registered in October 2018, at 3,54 EUR/kg
for a volume of 1 tonne. The highest average price of 9,11 EUR/kg for about 5 tonnes was registered in January 2021.
Overview | 1. First sales in Europe | 2. Extra-EU imports | 3. Consumption
23
| 4. EU trade in 2020 | 5. Whelks in the European market | 6. Global highlights |
7. Macroeconomic contextEuropean Market Observatory for MONTHLY HIGHLIGHTS | NO.6/2021
Fisheries and Aquaculture Products EXTRA-EU IMPORTS
2. Extra-EU imports
The weekly extra-EU import prices (weighted average values per week, in EUR per kg) for nine different species are examined
every month. The three most relevant species in terms of value and volume remain consistent: fresh whole Atlantic salmon
from Norway, frozen Alaska pollock fillets from China, and frozen tropical shrimp (Penaeus spp.) from Ecuador. The
other six species change each month; three are chosen from the commodity group of the month, and three are randomly
selected. The commodity group for this month is “flatfish”, and the featured species are fresh or chilled Atlantic halibut
from Norway, frozen fillets of plaice from Iceland, and frozen sole from Morocco. The three randomly selected species
this month are frozen octopus from Morocco, frozen squid from Tunisia, and prepared or preserved shrimps and prawns
from Canada.
Data analysed in the section “Extra-EU imports” are extracted from EUMOFA, as collected from the European
Commission30.
Table 21. EVOLUTION OF WEEKLY PRICE AND VOLUME OF THE THREE MOST RELEVANT FISHERIES AND
AQUACULTURE PRODUCTS IMPORTED INTO THE EU
Extra-EU Imports Week Preceding 4- Week 05/2020 Notes
16/2021 week average
Fresh whole Price 6,17 6,13 (+1%) 5,02 (+23%) In 2021, prices ranged from 4,62 to
Atlantic salmon (EUR/kg) 6,31 EUR/kg. Upward trend since the
imported from beginning of the year, in contrast with
Norway (Salmo a downward trend over the past three
salar, years.
CN code 03021440) Volume 10.162 10.844 (–6%) 12.121 (–16%) Most of the weekly volumes (34%)
(tonnes) range from 11.000 to 13.000 tonnes.
Downward trend since the beginning
of the year, in contrast with the
upward trend since week 17 of 2018.
Frozen Alaska Price 2,61 2,55 (+2%) 2,91 (–10%) In 2021, prices ranged from 2,40 to
pollock fillets (EUR/kg) 2,61 EUR/kg and had an upward trend
imported from in contrast with the same period of
China (Theragra 2020, when the trend was slightly
chalcogramma, downward.
CN code 03047500) Volume 1.708 2.436 (–30%) 2.236 (–24%) Fluctuations in supply from 370 to
(tonnes) 7.300 tonnes. About 46% of volumes
are between 2.000 and 3.000 tonnes.
Downward trend over the past three
years.
Frozen tropical Price 5,21 5,09 (+2%) 5,58 (–7%) Most prices (46%) range between
shrimp imported (EUR/kg) 5,50 and 6,00 EUR/kg. Slight upward
from Ecuador trend since week 1 of 2021, in
(genus Penaeus, contrast with a downward trend over
CN code 03061792) the past three years.
Volume 2.994 2.685 (+12%) 2.401 (+25%) Volumes fluctuate from 700 to 4.000
(tonnes) tonnes/week: 50% of volumes range
between 1.000 to 2.000 tonnes.
Upward trend since week 17 of 2018.
30
Last update: 23.05.2021
Overview | 1. First sales in Europe | 2. Extra-EU imports | 3. Consumption
24
| 4. EU trade in 2020 | 5. Whelks in the European market | 6. Global highlights |
7. Macroeconomic contextEUR/kg EUR/kg EUR/kg
1,50
2,00
2,50
3,00
3,50
4,00
5,00
6,00
7,00
8,00
9,00
4,00
4,50
5,00
5,50
6,00
6,50
7,00
2018/17 2018/17 2018/17
2018/21 2018/21 2018/21
2018/25 2018/25 2018/25
2018/29 2018/29 2018/29
| 4.
2018/33 2018/33 2018/33
2018/37 2018/37 2018/37
European Market Observatory for
2018/41 2018/41 2018/41
Fisheries and Aquaculture Products
2018/45 2018/45 2018/45
2018/49 2018/49 2018/49
2019/01 2019/01 2019/01
2019/05 2019/05 2019/05
2019/09 2019/09 2019/09
2019/13 2019/13 2019/13
2019/17 2019/17 2019/17
2019/21 2019/21 2019/21
2019/25 2019/25 2019/25
2019/29 2019/29 2019/29
2019/33 2019/33 2019/33
2019/37 2019/37 2019/37
2019/41 2019/41 2019/41
2019/45 2019/45 2019/45
2019/49 2019/49 2019/49
7. Macroeconomic context
2020/01 2020/01 2020/01
2020/05 2020/05 2020/05
2020/09 2020/09 2020/09
2020/13 2020/13 2020/13
2020/17 2020/17 2020/17
2020/21 2020/21 2020/21
2020/25 2020/25 2020/25
Figure 36. IMPORT PRICE OF FROZEN TROPICAL SHRIMP FROM ECUADOR, 2018 - 2021
2020/29 2020/29 2020/29
2020/33
Overview | 1. First sales in Europe | 2. Extra-EU imports | 3. Consumption
2020/33 2020/33
Figure 35. IMPORT PRICE OF FROZEN ALASKA POLLOCK FILLETS FROM CHINA, 2018 - 2021
EU trade in 2020 | 5. Whelks in the European market | 6. Global highlights
2020/37 2020/37 2020/37
|
2020/41 2020/41 2020/41
2020/45 2020/45 2020/45
Figure 34. IMPORT PRICE OF FRESH AND WHOLE ATLANTIC SALMON FROM NORWAY, 2018 - 2021
2020/49 2020/49 2020/49
2020/53 2020/53 2020/53
2021/04 2021/04 2021/04
Week 16:
Week 16:
Week 16:
2021/08 2021/08 2021/08
5,21 EUR/kg
2,61 EUR/kg
6,17 EUR/kg
2021/12 2021/12 2021/12
MONTHLY HIGHLIGHTS | NO.6/2021
EXTRA-EU IMPORTS
2021/16 2021/16 2021/16
25European Market Observatory for MONTHLY HIGHLIGHTS | NO.6/2021
Fisheries and Aquaculture Products EXTRA-EU IMPORTS
Table 22. EVOLUTION OF WEEKLY PRICE AND VOLUME OF THIS MONTH'S THREE FEATURED COMMODITY
PRODUCTS IMPORTED INTO THE EU
Extra-EU Imports Week Preceding 4- Week 16/2020 Notes
16/2021 week average
Fresh or chilled Price 6,59 7,87 (–16%) 7,03 (–6%) Downward trend over the past three
Atlantic halibut (EUR/kg) years. Price fluctuated around 9,00-
from Norway 10,00 EUR/kg before week 11 of 2020,
(Hippoglossus and around 7,00-8,00 EUR afterwards.
hippoglossus, CN code Since week 1 of 2021, prices range
03022130) from 6,59 to 8,49 EUR/kg.
Volume 24 18 (+34%) 11 (+129%) Fluctuations in supply from 7 to 100
(tonnes) tonnes. Upward trend from week 17 of
2018.
Frozen fillets of Price 8,17* 8,27** (+8%) 8,23*** (+9%) Data are missing, mainly in 2020, when
plaice from Iceland (EUR/kg) only 23 weekly prices were available,
(Pleuronectes possibly due to the pandemic.
platessa, CN code Fluctuations in price over the past three
03048310) years.
Volume 4,9* 1,1** (+21%) 2,2*** (–37%) Data are missing, mainly in 2020, when
(tonnes) only 23 weekly prices were available,
possibly due to the pandemic.
Fluctuations in supply, from 0,024 to
31 tonnes.
Frozen sole from Price 5,61* 5,40**** (–1%) 5,28 (–1%) Data are limited, mostly in 2020,
Morocco (Solea spp., (EUR/kg) possibly due to the pandemic. Most of
CN code 03033300) prices range between 9,00-11,00
EUR/kg. Downward trend from week 14
of 2018.
Volume 33* 8,4**** (–75%) 16 (–87%) Data are limited, mostly in 2020,
(tonnes) possibly due to the pandemic. High
fluctuations in supply, from 0,167 to
169 tonnes. Downward trend from
week 14 of 2018.
* Data refers to week 13 of 2021 (the most recent available); **data refers to weeks 9 to 12 of 2021; ***data refers to week 13 of 2020; ****data refers to
weeks 9,10, and 12 of 2021.
Figure 37. IMPORT PRICE OF FRESH OR CHILLED ATLANTIC HALIBUT FROM NORWAY, 2018 - 2021
18,00
16,00 Week 16:
14,00 6,59 EUR/kg
12,00
EUR/kg
10,00
8,00
6,00
4,00
2,00
0,00
2018/17
2018/21
2018/25
2018/29
2018/33
2018/37
2018/41
2018/45
2018/49
2019/01
2019/05
2019/09
2019/13
2019/17
2019/21
2019/25
2019/29
2019/33
2019/37
2019/41
2019/45
2019/49
2020/01
2020/05
2020/09
2020/13
2020/17
2020/21
2020/25
2020/29
2020/33
2020/37
2020/41
2020/45
2020/49
2020/53
2021/04
2021/08
2021/12
2021/16
Overview | 1. First sales in Europe | 2. Extra-EU imports | 3. Consumption
26
| 4. EU trade in 2020 | 5. Whelks in the European market | 6. Global highlights |
7. Macroeconomic contextYou can also read