GLOBAL TRAFFIC SCORECARD - PODER360
←
→
Page content transcription
If your browser does not render page correctly, please read the page content below
Global Traffic Scorecard
INRIX Research • Trevor Reed • February 2019
ABOUT INRIX RESEARCH

Launched in 2016, INRIX Research uses INRIX proprietary big
data and expertise to make the movement of people and goods
more efficient, safer and convenient.

We achieve this by leveraging 500 terabytes of INRIX data from
300 million different sources covering more than 5 million miles of
road, combined with our other data sources including global parking,
fuel, points of interest, public transport and road weather information.
Together, our data provides a rich and fertile picture of urban mobility
that enables INRIX Research to produce valuable and actionable
insights for policy makers, transport professionals, automakers
and drivers.

The INRIX Research team has researchers in Europe and North
America, and is comprised of economists, transportation policy
specialists and data scientists with backgrounds from academia,
think tanks and commercial research and development groups.
We have decades of experience in applying rigorous, cutting-edge
methodologies to answer salient, real-world problems.

INRIX Research will continue to develop the INRIX Traffic Scorecard
as a global, annual benchmark as well as develop new industry-
leading metrics and original research reports. In addition to our
research outputs, INRIX Research is a free and valuable resource for
journalists, researchers and policymakers. We are able to assist with
data, analysis and expert commentary on all aspects of urban mobility
and smart cities. Spokespeople are available globally for interviews.

                                       INRIX RESEARCH | INTELLIGENCE THAT MOVES THE WORLD
INRIX GLOBAL TRAFFIC SCORECARD

                                  CONTENTS

TABLES                            1 INTRODUCTION

                                                                       1
1   Top 25 Global            7
2   Top 25 United States     9    2 CONGENESTION EXPLAINED
3   Top 10 Corridors US      10
4   Top 25 Europe            13   3 DATA AND METHODOLOGY
5   Top 10 Corridors UK      14
6   Top 10 Corridors              4 ECONOMIC IMPACTS
    Outside London           15
7   Top 5 Corridors Inside        5 RANKINGS
    London                   15
8   Top 10 Germany           16   5.1 GLOBAL RANKINGS
9   Top 10 Germany 2         17   5.2 THE UNITED STATES
                                  5.3 EUROPE
                                  5.4 THE UNITED KINGDOM

                                  6 CASE STUDY

                                  6.1 LONDON

INRIX RESEARCH | INTELLIGENCE THAT MOVES THE WORLD
INRIX GLOBAL TRAFFIC SCORECARD

    1 INTRODUCTION

    Congestion is an indiscriminate                    INRIX collects billions of
    global phenomenon that is                          anonymous data points every
    dramatically impacted by
                                                       day from a diverse set of
2   population, the economy,
    infrastructure, and the
    proliferation of rideshare
                                                       sources, including connected
                                                       vehicles, cities, DOTs, road
    and delivery services. It also                     weather conditions, journalistic
    imposes massive costs both
    economically and socially.                         incidents, social media,
    Solving traffic – better stated,                   parking, mobile and other
    improving mobility – requires                      IoT devices. With information
    a tailored approach to each
                                                       on almost 90 percent of the
    city’s needs.
                                                       world’s roads across over
    The INRIX 2018 Global Traffic Scorecard            80 countries, INRIX is the
    is an analysis of congestion and mobility
    trends in more than 200 cities, across 38          preferred provider of driving
    countries. A new methodology for the 2018
    Global Traffic Scorecard allows for cross-
                                                       and mobility intelligence for
    national rankings and analysis, delivering in-     leading automakers.
    depth insights for drivers and policy-makers
    to make better decisions informed by big
    data.

                                                     INRIX RESEARCH | INTELLIGENCE THAT MOVES THE WORLD
INRIX GLOBAL TRAFFIC SCORECARD

    2 CONGESTION

    Congestion at the most basic                                             to INRIX data, travel speeds, congestion
                                                                             rates and time loss positively correlate with
    level can be described as                                                population and city density. However, motorists
    the demand for road space                                                in high congestion cities do not typically travel
    exceeding supply. However, the                                           as far since they are geographically closer to

                                                                                                                                                     3
    critical phenomena known as                                              more destinations.5 It is the driving experience
                                                                             that differs most across cities, not the duration
    ‘facility breakdown’ is frequently                                       of trips. Typically, dense cities experience
    underappreciated. It occurs                                              low speeds and shorter commute distances
    when a road cannot effectively                                           in contrast to low-density cities which
                                                                             exhibit higher speeds, but longer distances
    accommodate more vehicles,
                                                                             traveled. In both contexts, commuters spend
    which causes a decrease in the                                           approximately a half-hour on average going to
    roadway’s overall capacity as                                            or from work.
    more vehicles try to force their
                                                                             One notable exception to this trend is
    way onto the roads.1                                                     Singapore. With aggressive anti-congestion
                                                                             policies, including high vehicle ownership fees
    Highways designed to operate safely at speeds                            and congestion tolls, the city’s road network
    of 60 MPH, can move nearly 2300 cars per                                 continues to facilitate high-speeds despite
    lane per hour at 45 MPH. The same roadway                                high urban density.6 Charging for road space
    may carry fewer than 700 cars per lane during                            curtails the incidence and impact of facility
    facility breakdown.2 Facility breakdown is why                           breakdown. In Paris, Zurich, Barcelona and
    expansion and congestion relief measures                                 Madrid, authorities actively pursue policies
    frequently fail as the supply of road-space                              that reduce roadway performance and
    cannot increase enough to escape this trap.                              capacity in favor of public transport, cycling
    While this example pertains to highways, every                           and walking.7 Prioritizing safety, often under
    road and/or road network is subject to facility                          the title of ‘Vision Zero’, has justifiably taken
    breakdown. For instance, urban streets are                               on much greater emphasis in recent years,
    subject to greater mobility demands than car-                            and with significant success. New York City,
    exclusive roadways.                                                      for example, achieved the lowest number
                                                                             of roadway fatalities on record in 2018.
    INRIX Research recognizes that commute                                   Sustainable measures are sought for many
    duration remains mostly constant across                                  reasons, including mobility, environmental,
    cities worldwide, irrespective of congestion                             safety, health and economic considerations.
    levels. On average, commuters are unwilling to                           When interpreting the 2018 Global Traffic
    spend more than one hour per day commuting                               Scorecard’s results, understanding the context
    according to Marchetti’s constant.3 Trip times                           of road performance within a city’s broader
    are kept in check by increased housing density,                          mobility framework is critical.
    household relocation and greater mobility
    via infrastructure improvements.4 According

    1 United States of America. Federal Highway Administration. U.S. Department of Transportation. Definition, Interpretation, and Calculation of Traffic
    Analysis Tools Measures of Effectiveness. By Richard Dowling. Vol. VI. Traffic Analysis Tool Box. Washington, DC: U.S. Federal Highway Administration,
    Office of Operations, 2007.
    2 Ibid.
    3 Marchetti, C. “Anthropological Invariants in Travel Behavior.” Technological Forecasting and Social Change47, no. 1 (1994): 75-88.
    doi:10.1016/0040-1625(94)90041-8.
    4 Angel, Shlomo, and Alejandro M. Blei. “The Productivity of American Cities: How Densification, Relocation, and Greater Mobility Sustain the
    Productive Advantage of Larger U.S. Metropolitan Labor Markets.” Cities51 (2016): 36-51. doi:10.1016/j.cities.2015.11.030.
    5 Osman, Taner, Trevor Thomas, Andrew Monschein, and Brian Taylor. Not So Fast: A Study of Traffic Delays, Access, and Economic Activity in the San
    Francisco Bay Area. Report. Luskin School of Public Affairs, UCLA Institute of Transportation Studies. Los Angeles, CA: UCLA, 2016.
    6 Goh, Mark. “Congestion Management and Electronic Road Pricing in Singapore.” Journal of Transport Geography10, no. 1 (2002): 29-38.
    doi:10.1016/s0966-6923(01)00036-9.
    7 Rosenthal, Elisabeth. “Across Europe: Irking Drivers Is Urban Policy.” The New York Times (New York City), June 26, 2011.

INRIX RESEARCH | INTELLIGENCE THAT MOVES THE WORLD
3 DATA AND METHODOLOGY

    The INRIX 2018 Global Traffic                     Definitions:
    Scorecard is not directly
                                                      Impact Rank: Impact rank is a calculated
    comparable to the 2017                            commute based upon a city’s population and

4   Global Traffic Scorecard due to
    different metrics and criteria
    of analysis. The 2017 Global
                                                      the delay attributable to congestion.

                                                      Urban Area: The geographic scope of a city as
                                                      defined by its road network density.
    Traffic Scorecard measured
    time spent in congestion for the                  Hours Lost in Congestion: The total number of
    median commuter whereas the                       hours lost in congestion during peak commute
                                                      periods compared to free-flow conditions.
    2018 Global Traffic Scorecard
    measures time lost due to                         Year-Over-Year Change: The percentage
    congestion dependent upon                         difference in hours lost in congestion in 2018
    the time of day. The 2018                         compared to 2017.
    Global Traffic Scorecard not only                 Last Mile Travel Time: The time it takes to
    analyzes time lost, but also the                  travel one mile into the central business district
    severity of congestion.                           during peak hours.

    The 2018 Global Traffic Scorecard                 Last Mile Speed: The speed at which a driver
    addresses the above by employing peak,            can expect to travel one mile into the central
    off-peak and free flow data for the busiest       business district during peak hours.
    commuting corridors identified by data
    density. Peak corresponds to the absolute
    worst portion of the morning and afternoon        For example, Los Angeles experiences high
    commute. Off-peak is the low point between        levels of congestion throughout the day, but
    the peak periods. Free flow is the best           its peak severity is less than Boston and
    performance experienced over 24 hours.            Washington D.C. In other terms, Boston
    Employing free-flow data enables a direct         and Washington D.C. experience lower
    comparison between peak and off-peak              lows compared to Los Angeles’ consistently
    periods and serves as the basis for calculating   congested roadways, although all three
    time loss. Total time lost is the difference      are heavily congested. Congestion severity
    in travel times experienced during the peak       correlates with city age and density because
    and off-peak periods compared to free flow        cities tend to develop around the popular
    conditions on a per capita basis.                 transportation modes of the period.

                                                      The 2018 Global Traffic Scorecard uses two
                                                      years of historical data to provide a complete
                                                      year-over-year comparison of congestion and
                                                      mobility. A multi-year approach enables the
                                                      identification of trends in the world’s largest
                                                      cities and provides a basis for comparison.

                                                       INRIX RESEARCH | INTELLIGENCE THAT MOVES THE WORLD
INRIX GLOBAL TRAFFIC SCORECARD

    4 ECONOMIC IMPACTS

    The economic impacts                                                   For example, the impacts of delays on
                                                                           perishable goods are much higher than durable
    associated with driving are                                            goods. Thus, the costs of congestion vary
    pervasive, complex and dynamic.                                        severely between cities. However, the American
    To understand the burden
                                                                                                                                               5
                                                                           Transportation Research Institute estimates the
    congestion places on each                                              total cost of congestion in the freight sector to
                                                                           be $74.5 billion annually, with $66.1 billion of
    driver and the economy, INRIX                                          it occurring in urban areas.12
    Research estimates the costs of
    congestion in the United States,                                       Congestion as an Economic Indicator

    United Kingdom and Germany.                                            While congestion incurs costs from time
                                                                           loss, increased pollution rates, and higher
    Time Loss to Passenger and Freight                                     incidents of accidents, its presence is
                                                                           indicative of positive economic trends and a
    Time loss is the excess amount of time taken                           city’s desirability. The occurrence of many of
    on a trip caused by congestion. The cost of                            the world’s most dynamic cities in this report
    congestion depends upon the labor market,                              should serve as no surprise. Higher density
    industrial sector, mode of transport, trip                             and population correlate directly with economic
    distance and travel conditions.8 Two preferred                         growth and innovation rates, while their co-
    methods for developing estimates for work and                          occurrence has a multiplier effect.13 The larger
    non-work passengers’ travel time savings (non-                         and denser the city is the more significant
    freight movements) are revealed preference                             the benefits accrued to an individual city.
    method and the cost-saving approach.9                                  Agglomeration economics is the phenomena
    Given the limited availability of this data,                           of increasing productivity as a function of size
    creating a definitive answer for the costs of                          and density.14 For example, the Top 5 largest
    time loss for passengers is difficult. However,                        metros in the U.S. by GDP accounted for 26
    ranges are derived for cities in the U.S., U.K.,                       percent of the nation’s GDP, in 2017, but
    and Germany based upon U.S Department                                  represented only 17 percent of the nation’s
    of Transportation guidance.10 Costs were                               population.15,16 While congestion itself has
    then calculated in local currencies using                              little intrinsic worth, it’s symptomatic of
    2018 values.                                                           economic vitality. In the medium- and long-
                                                                           term, congestion can positively impact a city
    Congestion also increases the costs of freight                         by catalyzing land use changes and driving
    movement via reduced driver productivity,                              investment in high-efficiency modes of
    higher operating costs and decreased                                   transport (public transport, bicycling, walking).
    reliability.11 A high degree of variability                            These investments reinforce agglomeration
    exists between cities due to local economic                            economics, amplifying their impact.
    conditions and the type of goods transported.

    8 Sartori et.al. Guide to Cost-Benefit Analysis of Investment Projects: Economic Appraisal Tool for Cohesion Policy 2014-2020.
    9 Ibid.
    10 United States. Department of Transportation. Office of the Secretary of Transportation. Revised Departmental Guidance on Valuation of
    Travel Time in Economic Analysis.
    11 Ibid.
    12 Hooper, Alan. Cost of Congestion to the Trucking Industry: 2018 Update. Report. American Transportation Research Institute. Atlanta,
    GA, 2018.
    13 Glaeser, Edward, and Joshua Gottlieb. “The Economics of Place-Making Policies.” 2008. doi:10.3386/w14373.
    14 Ibid.
    15 U.S. Census Bureau, 2013-2017 American Community Survey 5-Year Estimates
    16 U.S. Department of Commerce. Bureau of Economic Analysis. “Gross Domestic Product by Metropolitan Area, 2017.” News release.
    https://www.bea.gov/system/files/2018-09/gdp_metro0918_0.pdf.

INRIX RESEARCH | INTELLIGENCE THAT MOVES THE WORLD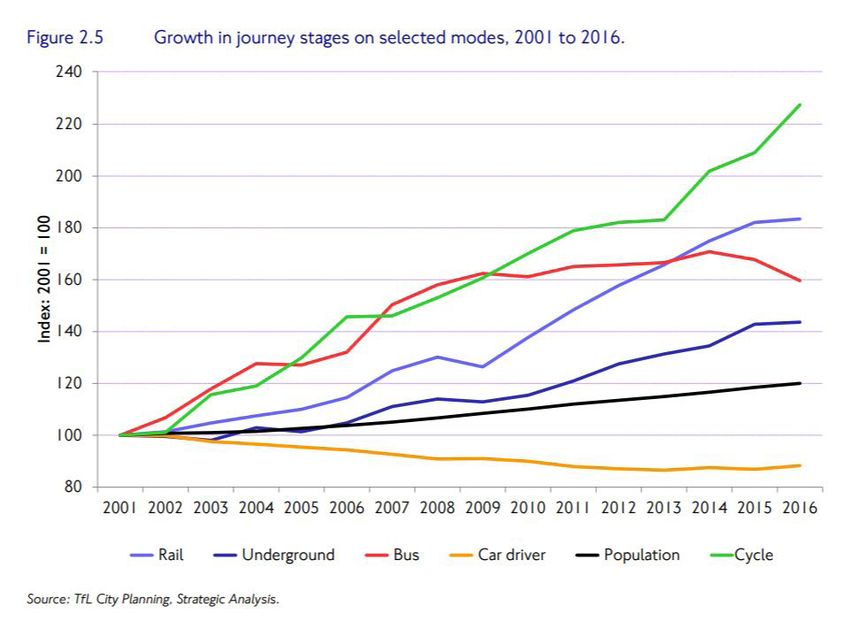
5 RANKINGS

    Global Ranking
    The INRIX 2018 Global Traffic Scorecard             In addition to their built form, European cities
    rankings deviate significantly from prior years.    are the most progressive in reallocating road

6   The variance is not a reflection of different
    data, but a transformation of the study.
    Prior Scorecards captured per capita time
                                                        space to other transportation modes and
                                                        for the public use. Congestion in cities like
                                                        Barcelona, Copenhagen, London, Paris and
    spent in congestion, while the INRIX 2018           Zurich is often accepted as a cost worth
    Global Traffic Scorecard analyzes per capita        paying. Zurich famously made it a policy
    time lost due traffic and its severity.             goal to slow traffic to promote other modes.
    Moscow, Istanbul, Bogota, Mexico City and           Paris has embarked upon a remarkably
    Sao Paulo comprise the Top 5 in the Global          aggressive policy of expanding public
    Congestion Impact ranking. The dominance of         spaces, including the elimination of traffic
    Latin American cities should be of no surprise.     from the lower quays on the Seine River,
    Their breakneck rates of urbanization, high         while Barcelona has received widespread
    levels of informal settlements, unforgiving         international attention for its ‘superblock’
    topographies and financial volatility make          schemes. Similar to its European peers,
    it difficult to improve mobility within these       London is undertaking major changes in road
    cities. However, in South America, volatility       space allocation towards cycle, pedestrian
    has driven innovation. Bus Rapid Transit (BRT)      and public transport, discussed further in the
    was developed first in Curitiba, Brazil, and has    London case study (page 18). When London
    expanded throughout the region. Its popularity      implemented congestion tolling in 2003, it
    stems from its ability to move high volumes         was only the second city in the world behind
    efficiently, with little capital expenditure and    Singapore to do so. The radical shift away
    build times measured in months, not years.          from the personal automobile, predominately
    In addition to BRT, Medellin, Colombia, has         in European cities, constitutes a new frontier
    successfully developed a cable car system that      in mobility and an opportunity for data-
    provides critical access to hillside communities.   driven solutions.
    While South American cities face massive
    difficulties, their capacity for innovation and     The lack of American and German cities in the
    implementation is commendable.                      Top 25, most noticeably Los Angeles, is not
                                                        surprising due to the age of its road networks.
    When ranking by Hours Lost in Congestion,           The worst performing American cities – Boston
    eight of the Top 10 cities globally are             and Washington D.C. – are also amongst the
    European. The age of these cities is a primary      oldest. Their presence correlates with the
    factor. In the cases of Rome (1), Paris             prevalence of older European cities scoring
    (4), London (5) and Milan (6), their oldest         highly. One city (country) which deserves
    roads can be traced back to the Roman               further attention is Singapore. Its presence
    period. Interestingly, each of these cities         in the Top 25 is a function of its population.
    features a ring road, which forms a physical        However, regarding yearly hours wasted it
    boundary between pre- and post-automotive           places 106th. Singapore manages car use
    construction. The outcome being car-centric         more aggressively than any other city in the
    infrastructure that quite literally runs into       world, providing a positive example of effective
    dense public transit or walking development         pricing treatments.
    patterns. In essence, cars enter neighborhoods
    designed for horses and walking.

                                                          INRIX RESEARCH | INTELLIGENCE THAT MOVES THE WORLD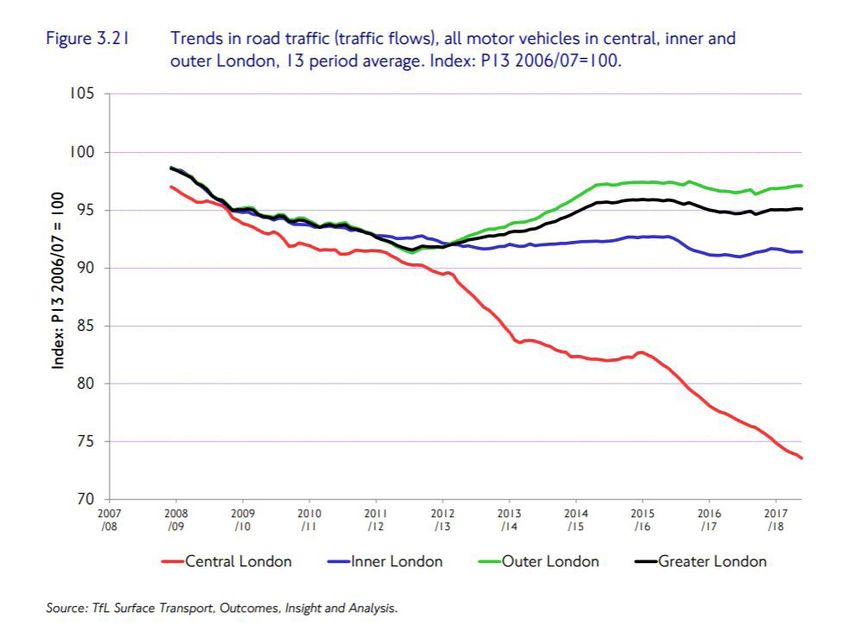
INRIX GLOBAL TRAFFIC SCORECARD

INRIX Top 25 Most Congested Cities in the World
                                                                                                            INNER CITY
                                                                         HOURS LOST IN      YEAR OVER                        INNER CITY
 2018 IMPACT                                                                                                 LAST MILE
                  URBAN AREA            COUNTRY            REGION         CONGESTION          YEAR                            LAST MILE
 RANK (2017)                                                                                               TRAVEL TIME
                                                                          (RANK 2018)        CHANGE                         SPEED (MPH)

                                                                                                                     7
                                                                                                             (MINUTES)
    1 (1)            Moscow               Russia           Europe           210 (10 )          -12%              5               11
    2 (3)            Istanbul             Turkey           Europe           157 (32 )           6%               6               10
    3 (2)            Bogota             Colombia        South America        272 (1 )           -5%              8               7
    4 (4)          Mexico City            Mexico        South America        218 (9 )           3%               7               9
    5 (5)           São Paulo             Brazil        South America       154 (39 )           -1%              6               10
    6 (6)            London          United Kingdom        Europe            227 (6 )           1%               8               7
    7 (8)         Rio de Janeiro          Brazil        South America       199 (13 )          15%               5               13
    8 (7)          Boston, MA         United States     North America       164 (25 )          -10%              6               11
    9 (9)       Saint Petersburg          Russia           Europe           200 (12 )           -5%              6               11
   10 (13)            Rome                 Italy           Europe            254 (2 )          16%               8               8
   11 (10)           Ankara               Turkey           Europe           128 (75 )           -5%              5               12
   12 (11)            Izmir               Turkey           Europe           154 (38 )           1%               6               10
   13 (12)           Sydney              Australia        Oceania           138 (63 )           -1%              6               10
   14 (14)          Singapore           Singapore         Oceania          105 (106 )           -2%              4               15
   15 (16)            Berlin             Germany           Europe           154 (40 )           -5%              5               11
   16 (18)            Paris               France           Europe            237 (5 )           7%               7               8
   17 (15)         Melbourne             Australia        Oceania           118 (87 )          -13%              6               11
   18 (22)       Belo Horizonte           Brazil        South America       202 (11 )          12%               8               8
   19 (20)      Washington D.C.       United States     North America       155 (36 )           -3%              5               11
   20 (19)         Toronto, ON           Canada         North America       164 (26 )           -4%              6               10
   21 (23)          Guayaquil            Ecuador        South America       167 (24 )           2%               5               12
   22 (24)           Madrid               Spain            Europe           129 (74 )           3%               7               8
   23 (25)         Chicago, IL        United States     North America       138 (64 )           4%               5               12
   24 (26)          Brisbane             Australia        Oceania           157 (33 )           3%               6               11
   25 (26)          Medellin            Colombia        South America       138 (62)           12%               6               10

                                                                        * The Impact Ranking includes a weighting based on city population

   INRIX RESEARCH | INTELLIGENCE THAT MOVES THE WORLD
INRIX GLOBAL TRAFFIC SCORECARD
The United States:
Boston and Washington D.C. are the top two cities in the U.S. both in terms of impact and time
wasted. Drivers in each city lose up to 164 and 155 hours in traffic, respectively. Their geography,
8 age and density create a road network that enters a severe state of breakdown once traffic
strikes. In each, drivers experience congestion more than 15 hours per year greater than the
next worst cities in terms of total hours: Chicago (138) and Seattle (138). Based upon Federal
Department of Transportation time loss valuations, Boston drivers lose up to $2,291 per
year, while Washington D.C. drivers lose up to $2,161. Nationwide, drivers lose 97 hours in
congestion, which costs Americans $87 billion annually in time, an average of $1,348 per driver.
While this report provides a snapshot of the economic costs of congestion in cities, it does not
reflect the impact of the time loss for individuals of different incomes. Boston may incur the most
significant costs in dollar terms, but a robust public transit system means alternatives exist for
lower-income households. In contrast, in a city like Houston (up to $1,365), many households
depend on driving, which is more expensive on a per mile basis. Determining the true impacts of
congestion is dependent upon a city’s unique economic profile and commute trends.
The cities with the slowest downtown business districts in the U.S. are New York City, San
Francisco and Philadelphia (9 MPH, 10 MPH and 10 MPH, respectfully). Again, their slow speeds
make sense as they are amongst the country’s oldest and densest – New York City and San
Francisco being the two densest cities in the U.S. – meaning cycling is equal to or faster than
driving. The driving characteristics in these cities’ cores affirms their decisions to prioritize safety,
public transport and non-motorized modes.
INRIX RESEARCH | INTELLIGENCE THAT MOVES THE WORLDINRIX GLOBAL TRAFFIC SCORECARD
INRIX Top 25 Most Congested Cities in the U.S.
INNER CITY INNER CITY
HOURS LOST IN COST OF COST OF
2018 IMPACT YEAR OVER LAST-MILE LAST-MILE
URBAN AREA CONGESTION CONGESTION CONGESTION
RANK (2017) YEAR CHANGE TRAVEL TIME SPEED
(RANK 2018) (PER DRIVER) (PER CITY)
9
(MINUTES) (MPH)
1 (1) Boston, MA 164 (1) -10% 6 11 $2,291 $ 4.1B
2 (2) Washington, DC 155 (2) -3% 5 11 $2,161 $ 4.6B
3 (5) Chicago, IL 138 (4) 4% 5 12 $1,920 $ 6.2B
4 (3) New York City, NY 133 (5) -4% 7 9 $1,859 $ 9.5B
5 (4) Los Angeles, CA 128 (6) 0% 4 14 $1,788 $ 9.3B
6 (6) Seattle, WA 138 (3) 0% 6 10 $1,932 $ 2.9B
7 (11) Pittsburgh, PA 127 (7) 5% 5 13 $1,776 $ 1.2B
8 (7) San Francisco, CA 116 (9) -5% 6 10 $1,624 $ 3.4B
9 (10) Philadelphia, PA 112 (10) 0% 6 10 $1,568 $ 3.3B
10 (8) Portland, OR 116 (8) -9% 5 13 $1,625 $ 1.4B
11 (13) Atlanta, GA 108 (11) 10% 4 14 $1,505 $ 3.5B
12 (9) Miami, FL 105 (12) -5% 5 12 $1,470 $ 4.0B
13 (14) Houston, TX 98 (14) 6% 4 15 $1,365 $ 3.8B
14 (12) Austin, TX 104 (13) -2% 5 13 $1,452 $ 1.2B
15 (16) Baltimore, MD 94 (16) 3% 6 10 $1,315 $ 1.3B
16 (15) Charlotte, NC 95 (15) 0% 5 12 $1,332 $ 953.8M
17 (19) Tampa, FL 87 (19) 11% 5 13 $1,216 $ 1.5B
18 (17) Honolulu, HI 92 (17) -4% 5 12 $1,282 $ 432.0M
19 (18) Denver, CO 83 (20) -3% 5 13 $1,152 $ 1.5B
20 (23) Nashville, TN 87 (18) 20% 4 16 $1,221 $ 694.7M
21 (20) Dallas, TX 76 (22) 6% 4 17 $1,065 $ 3.1B
22 (21) Phoenix, AZ 73 (25) 3% 4 17 $1,013 $ 1.8B
23 (31) Orlando, FL 74 (23) 16% 4 15 $1,037 $ 900.1
24 (24) Minneapolis, MN 70 (28) 4% 4 14 $971 $ 1.3B
25 (26) Columbus, OH 71 (27) 6% 4 14 $990 $ 734.9M
INRIX RESEARCH | INTELLIGENCE THAT MOVES THE WORLDTop 10 Worst US Corridors
10 For the fourth year in a row, the Cross Bronx Expressway (I-95) in New York City tops the INRIX list
of worst corridors, with drivers wasting a total of 114 hours per year at peak hours in congestion.
The list of corridors is dominated by the Top 5 most congested cities in the U.S., accounting for
nine of the 10 worst. Surprisingly, Washington D.C., the second most congested city, does not
have corridors that appear on the list. Despite extreme levels of congestion, traffic is diffusely
across the region and concentrated to a high degree on major arterials.
INRIX Top 10 Worst Corridors in the U.S.
YEARLY
DAILY DELAY
RANK CITY ROAD NAME FROM TO DELAY
(MINUTES)
(HOURS)
Trans
Cross Bronx Bruckner
1 New York City Manhattan 29 114
Expressway Expressway
Expressway
Stevenson
2 Chicago I-94|I-90 I-294 26 102
Expressway
I-290
3 Chicago (Eisenhower I-94 I-294 23 93
Expressway)
4 Los Angeles I-10 I-405 I-110 19 74
Pennsylvania
5 Pittsburgh I-376 I-79 18 72
Turnpike
6 Philadelphia I-76 I-476 I-676 13 53
Massacheusetts
7 Boston I-93 Braintree 13 53
Ave. Connector
I-278 Brooklyn
Long Island Manhattan
8 New York City Queens 13 51
Expressway Bridge
Expressway
9 Los Angeles I-5 Hollywood I-110 13 50
I-87 Major
Robert F. Cross Bronx
10 New York City Deegan 12 49
Kennedy Bridge Expressway
Expressway
INRIX RESEARCH | INTELLIGENCE THAT MOVES THE WORLDINRIX GLOBAL TRAFFIC SCORECARD
11
INRIX RESEARCH | INTELLIGENCE THAT MOVES THE WORLDEurope
European cities place amongst the slowest globally due to the vast majority of their growth
occurring prior to widespread adoption of the automobile. Dense cores, narrow roads and
12 complex road networks makes these cities ill-suited for car-based mobility. Moscow tops
the 2018 Global Traffic Scorecard as the most congested city in Europe when weighting for
population and commuting behavior. The cities with greatest time lost are Rome (254 hours),
Dublin (246 hours), Paris (237 hours), Rostov-on-Don (237 hours) and London (227 hours).
Dublin also has the distinction of having the slowest city center in all of Europe, where speeds dip
as low as 6 MPH.
Luckily for the residents of most European cities, robust public transport networks exist while
their density makes cycling and walking appealing alternatives. For example, central stations on
the Paris Metro are only 548 meters apart on average. Furthermore, Western Europe is the most
progressive region globally for the promotion of bicycling and walking. The shift to alternative
modes of transport makes a particularly high degree of sense given their exceptionally slow city
centers. While vehicle-based commuting has severely impaired in European cities, their overall
mobility is much higher due to the diversity of mode options.
INRIX RESEARCH | INTELLIGENCE THAT MOVES THE WORLDINRIX GLOBAL TRAFFIC SCORECARD
INRIX Top 25 Most Congested Cities in Europe
INNER CITY
HOURS LOST IN INNER CITY
2018 IMPACT YEAR OVER YEAR LAST-MILE
URBAN AREA COUNTRY CONGESTION LAST-MILE
RANK (2017) CHANGE TRAVEL TIME
(RANK 2018) SPEED (MPH)
13
(MINUTES)
1 (1) Moscow Russia 210 (8) -12% 5 11
2 (2) Istanbul Turkey 157 (22) 6% 6 10
3 (3) London United Kingdom 227 (5) 1% 8 7
4 (4) Saint Petersburg Russia 200 (9) -5% 6 11
5 (7) Rome Italy 254 (1) 16% 8 8
6 (5) Ankara Turkey 128 (52) -5% 5 12
7 (6) Izmir Turkey 154 (26) 1% 6 10
8 (8) Berlin Germany 154 (27) -5% 5 11
9 (9) Paris France 237 (4) 7% 7 8
10 (10) Madrid Spain 129 (51) 3% 7 8
11 (11) Milan Italy 226 (6) 6% 8 8
12 (12) Warsaw Poland 173 (15) 7% 5 13
13 (15) Budapest Hungary 162 (20) 11% 5 11
14 (13) Rostov-on-Don Russia 237 (3) 1% 7 8
15 (14) Hamburg Germany 139 (43) -3% 5 12
16 (16) Barcelona Spain 147 (34) 5% 7 9
17 (18) Nizhny Novgorod Russia 180 (14) 2% 5 12
18 (19) München Germany 140 (42) -3% 5 11
19 (17) Vienna Austria 109 (61) -11% 5 11
20 (21) Naples Italy 186 (13) -3% 9 7
21 (20) Prague Czech Republic 143 (35) -4% 5 11
22 (22) Turin Italy 167 (16) -2% 8 8
23 (23) Birmingham United Kingdom 134 (47) -4% 5 12
24 (25) Dublin Ireland 246 (2) -4% 10 6
25 (30) Valencia Spain 136 (45) 14% 6 10
INRIX RESEARCH | INTELLIGENCE THAT MOVES THE WORLDINRIX GLOBAL TRAFFIC SCORECARD
The United Kingdom
Drivers in the U.K. face a much different congestion landscape than those found in the U.S.
The age of cities in the U.K. has led to denser, less car friendly cores coupled with much earlier
industrialization that resulted in rail-centric alternatives. The fact that London Underground
14 operates lines older than 150 years speaks to a very different history of growth when compared
to the U.S. While the U.K. did pursue major roadworks and expansion of motorways in the post-
war period, hundreds of years of development is not easily undone.
According to INRIX data, six major U.K. cities exhibit last-mile travel times less than 10 MPH,
which is very slow even in a European context. Drivers in 7 U.K. cities experience delays greater
than 140 hours per year, with London clocking a remarkable 227 hours. In contrast, Germany
has two cities with delays greater than 140 hours: Berlin (154 hours) and Munich (140 hours).
The massive delays cost London drivers £1,680 annually ($2,199). While U.K. drivers lose more
time in congestion, the difference in wages when compared to the U.S. results in lower gross
costs of congestion. On average, drivers in the U.K. lost 178 hours due to congestion, costing
the country £7.9 billion or £1,317 per driver ($10.3 billion; $1,725 per driver). Due to London’s
much larger population compared to other cities in the U.K., it significantly impacts the national
average for time loss and cost per driver. When removing the capital, the average time loss drops
to 131 hours, costing £969 annually ($1268).
INRIX Top 10 Most Congested Cities in the U.K.
2018 INNER CITY INNER CITY
HOURS LOST IN YEAR OVER COST OF COST OF
IMPACT LAST-MILE LAST-MILE
URBAN AREA CONGESTION YEAR CONGESTION CONGESTION
RANK TRAVEL TIME SPEED
(RANK 2018) CHANGE (PER DRIVER)* (PER CITY)*
(2017) (MINUTES) (MPH)
1 (1) London 227 (1) 1% 8 7 £ 1,680 £ 4.9B
2 (2) Birmingham 134 (12) -4% 5 12 £ 994 £ 388.7M
3 (3) Glasgow 99 (16) 4% 5 13 £ 736 £ 320.4M
4 (7) Manchester 156 (4) 2% 6 10 £ 1,157 £ 212.7M
5 (5) Bristol 149 (9) 0% 8 8 £ 1,099 £ 212.0M
6 (4) Edinburgh 165 (3) -10% 8 7 £ 1,219 £ 211.4M
7 (8) Sheffield 149 (8) 1% 6 10 £ 1,101 £ 205.3M
8 (9) Leicester 155 (5) -4% 6 11 £ 1,145 £ 182.9M
9 (10) Leeds 143 (10) 6% 5 12 £ 1,057 £ 180.6M
10 (6) Liverpool 119 (13) -16% 6 9 £ 878 £ 174.6M
*Average hourly wage per capita, not household, was used in calculating the cost of congestion
INRIX RESEARCH | INTELLIGENCE THAT MOVES THE WORLDINRIX GLOBAL TRAFFIC SCORECARD
INRIX Top 10 Worst Corridors Outside of London
Outside of the capital, Birmingham holds the distinction of having the most congested corridors
with four cities appearing on the list. Leeds and Birmingham tie for most congested corridors
outside of London with drivers losing 44 hours on Leeds Road and the A34 respectively.
YEARLY
15
DAILY DELAY
RANK CITY ROAD NAME FROM TO DELAY
(MINUTES)
(HOURS)
Leeds Road |
1 Leeds Harrogate Road Bradford Road 11 44
Saltaire Road
A34 | Stratford Highgate
2 Birmingham Highfield Road 11 44
Road Middleway
A34 | Stratford Highgate
3 Birmingham Highfield Road 11 42
Road Middleway
Huddersfield Road
4 Leeds Dewsbury Huddersfield 10 40
| Leeds Road
Higher
5 Manchester Bury New Road M60 9 34
Broughton
Bramhall Lane
6 Manchester Bridge Lane Stockport 8 33
South
Black Country
7 Birmingham Dudley Port Dudley 8 32
New Road
Chapel | Crescent
8 Manchester Victoria Bridge M60 8 32
| Broad Street
Great Western Bearsden
9 Glasgow Kelvinside 8 31
Road Road
Soho Hill |
10 Birmingham Icknield Street M5 8 30
Birmingham Road
INRIX Top 5 Worst Corridors in London
The A406 North Circular Road appears twice in the Top 5 for London due to exceptionally heavy
traffic throughout the motorways length. Drivers on the A406 from Chiswick Roundabout to
Hangar Lane lose approximately 15 minutes per day or 61 hours per year in congestion.
YEARLY
DAILY DELAY
RANK ROAD NAME FROM TO DELAY
(MINUTES)
(HOURS)
A406 | North Circular Chiswick
1 Hangar lane 15 61
Road Roundabout
Thornton
2 A23 Kennington 14 56
Road
Kingsway | Strand |
3 Russell Square Monument 12 49
Fleet | Cannon Street
A406 | North Circular
4 A1 A10 11 43
Road
Tower of
5 A2103 Canary Warf 11 43
London
INRIX RESEARCH | INTELLIGENCE THAT MOVES THE WORLDGermany
16 Berlin (154 hours), Munich (140 hours) and Hamburg (139 hours) top the list of German cities
with the most time lost due to congestion, and eight of the Top 10 German cites lost more than
100 hours per year. Of the German cities studied, all exhibit last mile speeds characteristic of
dense cities falling between 10 to 15 MPH. Congestion imposes the greatest costs on Berliners
at up to €1340 per year. On a national level, Germans lost an average of 120 hours due to
congestion in 2018, costing the country €5.1 billion or €1052 per driver ($5.8 billion; $1,203
per driver).
Three major forces result in German cities performing better in terms of Hours Lost in Congestion
compared to other cities around the world. First, Germany has consistently invested in rail
and road networks, providing increased mobility and capacity. Second, it has also invested
in pedestrian and cycle infrastructure to a higher degree and for longer than either the U.S.
or U.K., decreasing the demand for car usage. Finally, Germany is a global leader in land use
and transportation planning, as exemplified by car averse development in the medium-sized
cities like Freiburg or Tubingen, and the adoption of highly innovative services like tram-trains.
Holistic planning reduces road demand both through trip elimination and alternatives to driving.
Germany’s high last mile speeds (compared to other European cities) and system reliability reveal
the power that long-range and all-round planning can have on mobility within a city.
INRIX Top 10 Most Congested Cities in Germany
2018 INNER CITY INNER CITY
HOURS LOST IN YEAR OVER COST OF COST OF
IMPACT LAST-MILE LAST-MILE
URBAN AREA CONGESTION YEAR CONGESTION CONGESTION
RANK TRAVEL TIME SPEED
(RANK 2018) CHANGE (PER DRIVER)* (PER CITY)*
(2017) (MINUTES) (MPH)
1 (1) Berlin 154 (1) -5% 5 11 € 1,340 € 1.7B
2 (2) Hamburg 139 (3) -3% 5 12 € 1,212 € 758.2M
3 (3) München 140 (2) -3% 5 11 € 1,218 € 618.5M
4 (4) Cologne 99 (10) -7% 4 13 € 867 € 322.0M
5 (5) Frankfurt 107 (7) -8% 6 11 € 935 € 239.7M
6 (6) Stuttgart 108 (5) -11% 4 13 € 938 € 204.8M
7 (7) Dusseldorf 100 (9) -9% 4 14 € 874 € 187.3M
8 (8) Leipzig 108 (4) -4% 5 11 € 941 € 184.6M
9 (9) Nuremberg 107 (6) -11% 5 13 € 937 € 167.2M
10 (10) Bremen 96 (11) -2% 5 12 € 839 € 163.7M
*Average hourly wage per capita, not household, was used in calculating the cost of congestion
INRIX RESEARCH | INTELLIGENCE THAT MOVES THE WORLDINRIX GLOBAL TRAFFIC SCORECARD
INRIX Top 10 Worst Corridors in Germany
Germany exhibits significantly lower time loss on its corridors than the United States or the United
Kingdom. Berlin exhibits greater delays than other major cities in Germany with the B96 from
Tempelhof to Hallesches topping the list at 28 hours lost per year. It is likely Berlin’s more diffuse
built environment and legacy of division, results in greater car dependency in comparison to
17
its peers.
DAILY DELAY YEARLY DELAY
RANK CITY ROAD NAME FROM TO
(MINUTES) (HOURS)
1 Berlin B96 Tempelhof Hallesches 7 28
Hittfelder Buy den
2 Hamburg Elbchaussee|Vorsetzen 6 23
LandstraBe Muren
Budapester Leitzenburber
3 Berlin Eberstravße 6 22
Str.|Tiergartenstraße Sraße
4 Cologne Hohenstaufenring Roonstraße Turiner Straße 4 17
5 Berlin Skalitzer Str.|B96a Kottbusser Tor B1 4 16
Potsdammer Danziger
6 Berlin Greifswalder Straße 4 15
Platz Straße
7 Hamburg Mittelweg Harvestuder weg Gansmarkt 4 14
8 Hamburg Spalding Straße A1 Deichtorplatz 3 10
9 Frankfurt Schwanheimer Hufer Europabrucke Kennedyallee 3 10
Frankfurt- Frankfurt-
10 Friedberger Freidberger Landstraße Freidberger Bleichstraße 3 10
Landstraße Landstraße
INRIX RESEARCH | INTELLIGENCE THAT MOVES THE WORLD6 CASE STUDY
London
18 London is the sixth most congested metro area in the 2018 Global Traffic Scorecard. Mobility in
London was one of major improvement focuses in the early 2000s, with the implementation
of the congestion zone in central London in 2003. However, massive population and economic
growth, coupled with the emergence of Transportation Network Companies (e.g. Uber and Lyft)
and proliferation of delivery services, has placed extreme pressures on a fixed road network in
recent years. While congestion has impacted the performance of London’s bus network and has
resulted in a drop in ridership in prior years, bus reliability in the capital over the last year has
improved significantly.
There has been an impressive growth in cycle rates. In 2016, 730,000 trips per day occurred, a
9 percent increase over 2015.17 Where adopted, London’s Cycle Highways move 46 percent of
all road traffic in 30 percent of the road space.18 The increase in cycle use and mode share will
increase with the recently adopted £2.3 billion five-year plan for cycle infrastructure and will focus
on creating higher quality cycle infrastructure. Continued investment in cycle infrastructure is
supported by its massive growth since 2000.
London has seen rapid and sustained population growth, but no increase in road capacity.
High density land use places extreme demand on road space. In London’s case, some roads
predate the Romans. An irregular street network developed prior to the advent of the automobile
increases the complexity of road network operations, placing further constraints on vehicular
speeds. Despite massive demand increases for transport, vehicle kilometers traveled (VKT) have
remained largely constant in the inner and outer boroughs, while decreasing in Central London.
VKT trends coupled with modal shift data highlights how London has effectively expanded
alternatives to motor vehicles.
INRIX RESEARCH | INTELLIGENCE THAT MOVES THE WORLDINRIX GLOBAL TRAFFIC SCORECARD
19
Luckily, London has successfully undertaken major improvements and expansions of the
underground, helping to address the increased demand for transport. In 1993, public transport
accounted for less than half of trips taken by private vehicle, whereas now more trips are taken
on public transport.19 This trend captures the remarkable turnaround public transport experienced
following the creation of the Greater London Authority and Transport for London (TfL) in 2000.
From 2004/2005 to 2016/2017 gross public transit trips increased by 41 percent or, 402 million
trips.20
The fact that the underground has increased market share while accommodating the increase
in London’s population highlights the success of the London Underground over the past two
decades. However, TfL is facing future funding shortfalls, which are predominately driven by a
decrease in trips per capita, declining national government funding and Crossrail delays and
overruns.21 While the Underground will have funding challenges, TfL’s ability to increase service
levels, expand and modernize the oldest system in the world speaks to effective management
over its lifetime.
While Londoners have reason for optimism from improving alternatives to the automobile, the
actual driving experience is unlikely to improve without major changes to the current congestion
charging scheme. At present, average speeds are lower than they were prior to the scheme’s
adoption. Two near-term adjustments are being made to the congestion zone that should spell
relief: the elimination of the Private Hire Vehicle (PHV) exemption will likely contribute to fewer
vehicles driving in Central London during peak hours and adoption of the Ultra-Low Emission Zone
(ULEZ) this coming April.22 The impacts of ULEZ will likely decrease with time as consumers adopt
lower emission drivetrains.
17 U.S. Census Bureau*
Persons per square mile: Los Angeles (8,484), Houston (3,842), Dallas (3,870) and Phoenix (3,126)
18 Hall, Peter. Cities of Tomorrow: An Intellectual History of Urban Planning.
19 Ibid.
20 “To Live and to Scoot in L.A.”
https://www.bloomberg.com/news/features/2018-09-18/bird-scooters-spread-across-los-angeles-one-year-after-launch.
21 Measure R Expenditure Plan. Report. Los Angeles County Metropolitan Transportation Authority.https://media.metro.net/measure_R/
documents/expenditure_plan.pdf
22 For London | Every Journey Matters. “Discounts & Exemptions.” Transport for London. Accessed January 04, 2019. https://tfl.gov.uk/
modes/driving/congestion-charge/discounts-and-exemptions.
INRIX RESEARCH | INTELLIGENCE THAT MOVES THE WORLDINRIX GLOBAL TRAFFIC SCORECARD
NORTH AMERICA EMEA
20
10210 NE Points Drive Station House
Suite 400 Stamford New Road
Kirkland Altrincham
WA 98033 Cheshire
United States WA14 1EP
England
+1 425-284-3800
info@inrix.com +44 161 927 3600
europe@inrix.com
INRIX RESEARCH | INTELLIGENCE THAT MOVES THE WORLDYou can also read