Grassland bird diversity and abundance in the presence of native and non-native grazers
←
→
Page content transcription
If your browser does not render page correctly, please read the page content below
VOLUME 16, ISSUE 2, ARTICLE 13
Boyce, A. J., H. Shamon, K. E. Kunkel, and W. J. McShea. 2021. Grassland bird diversity and abundance in the presence of native and non-native
grazers. Avian Conservation and Ecology 16(2):13. https://doi.org/10.5751/ACE-01944-160213
Copyright © 2021 by the author(s). Published here under license by the Resilience Alliance.

Research Paper

Grassland bird diversity and abundance in the presence of native and
non-native grazers
Andy J. Boyce 1,2, Hila Shamon 1, Kyran E. Kunkel 3,4,5 and William J. McShea 1
1
  Conservation Ecology Center, Smithsonian Conservation Biology Institute, Front Royal, VA U.S.A, 2Migratory Bird Center,
Smithsonian Conservation Biology Institute, Washington DC., USA, 3Conservation Science Collaborative, 4University of Montana,
5
  Smithsonian Institution, U.S.A

ABSTRACT. Temperate grassland biomes are globally imperiled, and grassland birds are in precipitous decline as a result. The majority
of North America's grassland birds breed on rangelands occupied by domestic cattle, but reintroductions of bison to restore evolutionary
grazing patterns are increasingly common. Grassland landscapes in western North America have undergone drastic changes since
millions of bison occupied this landscape, and the biodiversity effects of bison on modern rangelands remain poorly understood. Here,
we test the biodiversity effects of native versus non-native grazers in the context of a highly diverse grassland bird community on the
Northern Great Plains of North America. We compared the effects of 2 different grazing treatments common across the region on
avian diversity: seasonally grazed and manually rotated domestic cattle, and year-round, free-moving bison. We also test whether
estimated abundances of 11 grassland/steppe obligate songbirds differ between these two management regimes. We found roughly
equivalent bird diversity, as measured by species richness and Shannon's diversity index, at sites occupied year-round by bison and
seasonally by cattle. We also found no significant effect of grazer type on 9 of 11 grassland songbird species. The two exceptions were
Grasshopper Sparrow and Vesper Sparrow, which were more abundant in bison pastures. Our results suggest that both native and non-
native grazers can create habitat for a highly diverse assemblage of grassland birds under grazer-specific management regimes.

Diversité et abondance des oiseaux de prairie en présence d'herbivores indigènes et non indigènes
RÉSUMÉ. Les biomes des prairies tempérées sont menacés à l'échelle mondiale et par conséquent, les oiseaux de prairie connaissent
une diminution accélérée. La majorité des oiseaux de prairie d'Amérique du Nord nichent dans des pâturages occupés par du bétail
domestique, mais les réintroductions de bisons visant à rétablir des modèles de pâturage évolutifs sont de plus en plus courantes. Les
paysages de prairies dans l'ouest de l'Amérique du Nord ont subi des changements radicaux depuis que des millions de bisons les ont
occupés, et les effets du bison sur la biodiversité des grands pâturages contemporains restent mal connus. L'objectif de la présente étude
était de tester les effets sur la biodiversité des herbivores indigènes et non indigènes dans le contexte d'une communauté d'oiseaux de
prairie très diversifiée dans les Grandes Plaines du Nord de l'Amérique du Nord. Nous avons comparé les effets de deux traitements
de broutement différents, communs à toute la région, sur la diversité aviaire : le bétail domestique, broutant de façon saisonnière et
soumis à une rotation manuelle, et le bison, qui se déplace librement toute l'année. Nous avons également vérifié si l'abondance de 11
espèces d'oiseaux chanteurs obligatoires des prairies et des steppes différait entre ces deux régimes de gestion. Nous avons trouvé une
diversité d'oiseaux à peu près équivalente, mesurée par la richesse des espèces et l'indice de diversité de Shannon, dans les sites occupés
toute l'année par les bisons et de façon saisonnière par le bétail. De plus, aucun effet significatif du type d'herbivores sur 9 des 11 espèces
d'oiseaux chanteurs des prairies n'a été constaté. Les deux exceptions étaient le Bruant sauterelle et le Bruant vespéral, qui étaient plus
abondants dans les pâturages de bisons. Nos résultats indiquent que les herbivores indigènes et non indigènes peuvent créer de l'habitat
pour un assemblage très diversifié d'oiseaux de prairie, dans le cadre de régimes de gestion spécifiques aux herbivores.
Key Words: bison; cattle; conservation; Northern Great Plains; prairie; restoration; rewilding; songbird

INTRODUCTION                                                               conversion of native prairie to tilled farmland or anthropogenic
Temperate grassland ecosystems and their dependent species are             infrastructure (Knopf 1994, Gage et al. 2016). Advances in
among the most imperiled globally (Hoekstra et al. 2005,                   farming practices, increasing scale of agriculture, crop subsidies,
Henwood 2010). In North America, many grassland obligate                   drought-tolerant crops, and increased demand for soy and
species have been extirpated from large portions of their native           biofuels are driving the loss of rangelands across the Great Plains
range or are in rapid decline (Manning 1995). Grassland birds are          (Wright and Wimberly 2013, Gage et al. 2016). This large-scale
the most rapidly declining avian guild, with some species                  habitat conversion is driving rapid declines among grassland
experiencing population declines of more than 80% in the past              obligate species as a direct consequence of both habitat loss and
50 years (Sauer et al. 2017, Rosenberg et al. 2019). The greatest          fragmentation; a phenomenon that highlights the critical
current threat to grassland birds in western North America is the          conservation value of remaining native grasslands (Knopf 1994,

Correspondent author: Andy J Boyce, 91 Campus Drive PMB 1605, Missoula, MT 59801, USA, boycea@si.edu

Avian Conservation and Ecology 16(2): 13
                                                                                                     http://www.ace-eco.org/vol16/iss2/art13/

Tack et al. 2019). As such, there is high need to manage those         cattle in one study (Greibel et al. 1998), and reduced densities and
grasslands to ensure maximum abundance and diversity of key            diversity in another (Lueders et al. 2006). Bison grazing in a
grassland species.                                                     tallgrass prairie system resulted in strong changes to individual
                                                                       species abundance, but overall diversity was not evaluated (Powell
Nearly all grasslands in the western US are managed as
                                                                       2006). Given the complexities of pasture size, regional ecosystem
rangelands for production of domestic cattle. Managing
                                                                       (tall vs. short vs. mixed-grass prairie), presence or absence of fire,
rangelands for biodiversity and economic production means
                                                                       and stocking rate, the question of whether unmanipulated bison
facilitating disturbance while preventing overgrazing damage to
                                                                       or intensively managed cattle produce higher or lower bird
plants and soil. Managing grasslands for habitat heterogeneity
                                                                       diversity is likely to be context-dependent and generally remains
has become recognized as an important value and goal because
                                                                       an open question.
these ecosystems evolved in concert with high levels of stochastic
disturbance which produced multi-scale heterogeneity. Fire,            In addition to grazing management, abiotic factors such as soil
precipitation, and grazers are the primary ecological forces that      composition and precipitation are also drivers of vegetation
produce plant heterogeneity in grassland systems (Fuhlendorf et        productivity and diversity which influences bird diversity and
al. 2012). However, precipitation is not manageable, and fire is       abundance. The effect of different grazing regimes on biodiversity
not socially accepted as a management tool across large portions       can vary in the context of abiotic conditions including
of the Great Plains (Sliwinski et al. 2018). Therefore, the            precipitation and soil productivity (Lipsey and Naugle 2017).
restoration of evolutionary grazing patterns by large herbivores       Therefore, large-scale studies that seek to determine the effect of
is the primary conservation tool available to promote ecosystem        grazing systems on biodiversity must take soil productivity and
health and biodiversity (Fuhlendorf et al. 2018). Contemporary         annual variation into account.
efforts to manage grazing for maximum heterogeneity on the
                                                                       Bison ecology and physiology, which co-evolved with grassland
mixed-grass prairie of the Northern Great Plains generally focus
                                                                       ecosystems for tens of thousands of years, suggests that bison
on one of two methods: 1) grazing cattle via rotation through a
                                                                       may be well-suited to create heterogeneous grassland landscapes,
series of pastures to mimic evolutionary grazing patterns and
                                                                       without the need for intensive management in the form of water
produce habitat heterogeneity (Toombs et al. 2010, Fuhlendorf
                                                                       and fencing infrastructure typically required for cattle (Truett et
et al. 2018); 2) restoring evolutionary grazing processes directly
                                                                       al. 2001, Freese et al. 2014), and we aim to test this hypothesis
via the reintroduction of bison (Truett et al. 2001, Freese et al.
                                                                       here. We tested whether vegetation heterogeneity and grassland
2014, Fuhlendorf et al. 2018), with the assumption that they will
                                                                       bird diversity differed between pastures grazed year-round by
produce heterogeneous grassland landscapes with minimal
                                                                       bison with no managed rotation and pastures grazed seasonally
management beyond containment and population control
                                                                       by cattle that are rotated through internal fencing. Diversity is an
(Fuhlendorf et al. 2018).
                                                                       important conservation metric but certain species are especially
There are several ecological and physiological differences between     imperiled and understanding grazing effects on individual species
bison and cattle that support the hypothesis that their divergent      of heightened concern is critical. Furthermore, some imperiled
grazing patterns will affect biodiversity. Bison are more drought      species require large areas with uniform vegetation structure
and heat-tolerant, allowing them to graze farther from water,          (Somershoe 2018, Pulliam et al. 2020), meaning that community
especially during hot conditions (Allred et al. 2013, Kohl et al.      diversity and individual species abundance might often be
2013). Compared with cattle, bison select against areas with           decoupled. Therefore, in addition to community diversity
woody vegetation and standing water, spend aine, and specialize        patterns, we examined if estimated abundances for 11 focal
more on grasses as opposed to forbs or woody vegetation (Peden         grassland songbirds differed between areas grazed by cattle and
et al. 1974, Knapp et al. 1999, Steuter and Hidinger 1999, Allred      bison. Our focal species include but were not limited to Baird’s
et al. 2011, Kohl et al. 2013, Ranglack and du Toit 2015).             Sparrow (Centronyx bairdii), Sprague’s Pipit (Anthus spragueii),
                                                                       and Chestnut-collared Longspur (Calcarius ornatus), all of which
Given these known differences in foraging behavior, efforts to
                                                                       have been proposed for listing under the Endangered Species Act
restore bison to western prairies are increasing in frequency and
                                                                       in the US and/or Species at Risk Act in Canada (Somershoe 2018).
scale (Freese et al. 2007, Sanderson et al. 2008, U.S. Department
of the Interior 2018). Efforts are underway on tribal, federal, and
private lands across western North America to reintroduce and          MATERIALS AND METHODS
manage bison with the ultimate goal of restoring ecological
processes that are predicted to enhance habitat quality and
                                                                       Study system
                                                                       We studied grassland bird communities in northcentral Montana
heterogeneity (Allred et al. 2011). However, many bison
                                                                       within the northwest glaciated plains subregion of the Northern
restoration projects are currently small in scale (Sanderson et al.
                                                                       Great Plains ecosystem (Forrest et al. 2004). Our study area
2008) and, given that bison of the Great Plains historically moved
                                                                       included parts of Blaine, Phillips, and Valley counties bounded
large distances (Chisholm et al. 1986), relatively small pastures
                                                                       by the Milk River in the north, the Missouri River in the south,
sizes may constrain the ability of restored herds to fulfill their
                                                                       and the western edge of the Fort Belknap Indian Reservation in
ecological function as a keystone species (Lott 2002, Sanderson
                                                                       the west (Fig. 1). This region has the greatest diversity of breeding
et al. 2008, Kohl et al. 2013).
                                                                       grassland and sagebrush obligate songbirds in North America
There is evidence that restoration of bison at small scales can lead   (Dreitz et al. 2017). Land ownership is characterized by large
to increased diversity in insects and plants compared with cattle      blocks of both public and private lands. Land conversion from
grazing (Moran 2014, McMillan et al. 2018, Nickell et al. 2018),       native grassland to tillage agriculture is rapid on private lands in
but patterns in birds are equivocal. Combining fire and bison          the region, while remaining private and public rangelands are used
restoration resulted in similar bird communities compared with         for beef production (Gage et al. 2016).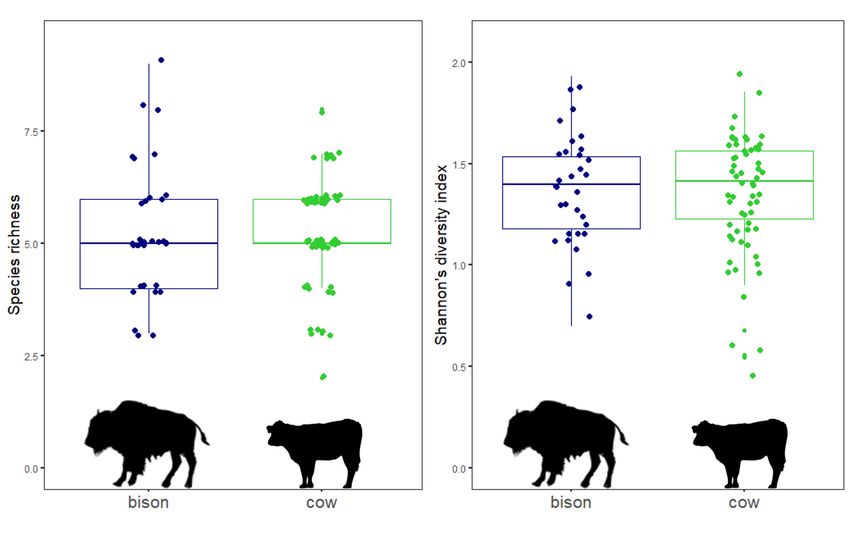
Avian Conservation and Ecology 16(2): 13
http://www.ace-eco.org/vol16/iss2/art13/
Table 1. Characteristics of pasture units in our study. Animal unit months (AUMs) used for bison are calculated as (herd size * 1.00
AUE * 12 months). Animal unit equivalent (AUE) value of 1.0 for bison is based on recommendations from Natural Resources
Conservation Service (NRCS 2003). AUMs used for cattle are estimated as the permitted number of AUMs according to lease and
sublease documents as these are generally equivalent (Rhodes 2020, BLM personal communication). Precise herd size was unavailable
for cattle plots so estimates were obtained by dividing permitted AUMs by the number of months (8) in a typical public lands grazing
season. Pasture area and herd size data were unavailable for four cattle pastures on the Fort Belknap Indian Reservation.
† -1
Unit name Ownership Total allotment area Mean pasture area Herd size AUMs used AUM * ha
(ha) (ha)
Bison
Sun Prairie APR/BLM/State 10,909 10,909 444 5,328 0.49
White Rock APR 2,963 2,963 201 2,412 0.81
Dry Fork APR 2,349 2,349 179 2,148 0.91
Snake Butte Ft. Belknap 8,903 8,903 ~700 8,400 0.94
Cattle
Sun Prairie North BLM/State 6,344 2,115 ~226 1,807 0.28
White Rock BLM/State 12,408 2,068 ~698 5,586 0.45
Dry Fork BLM/State 9,966 3,322 ~319 2,548 0.26
Burnt Lodge APR/BLM/State 4,198 1,050 ~296 2,371 0.56
Timber Creek APR/BLM/State 63,924 15,981 ~2,807 22,459 0.35
†
BLM = Burear of Land Management, APR = American Prairie Reserve
Resources Conservation Service (NRCS) methodology on private
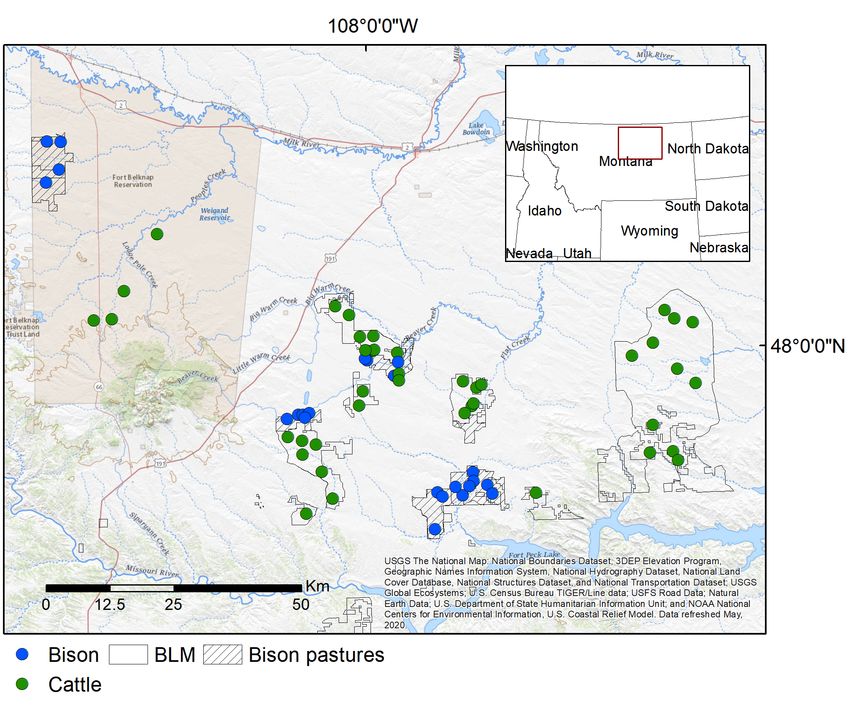
Fig. 1. Map of the study area including the locations of all parcels. Bison populations are controlled by public hunting
sampling cells coded by grazer species. The Fort Belknap opportunities, donations of animals to other conservation herds,
reservation is shaded in light brown. Management units on both and temporary chemical contraception (Freese et al. 2018). The
APR and Fort Belknap are outlined in black. Fort Belknap Indian Community also maintains a large herd
(~700 individuals) of bison on its Snake Butte pasture. The
pasture is approximately 25,000 acres in size and contains
approximately 700 bison. This pasture has approximately twice
the stocking rate as APR pastures and has been occupied by bison
for more than 30 years (B. Speakthunder, FBIR, 2020, personal
communication, Table 1).
Cattle pastures within our study area were managed via deferred
rotation grazing (B. J. Rhodes 2020, BLM, personal
communication). That is, grazing allotments are divided up into
3-4 pastures with interior barbed-wire fence, and cattle are moved
sequentially through all pastures over the course of each grazing
season (March - November). Bison pastures were managed via
continuous grazing, in which bison could move freely within each
grazing allotment throughout the year. Cattle pastures have been
managed consistently for 10+ years (B. J. Rhodes 2020, BLM,
personal communication). Bison pastures have had bison grazing
for between 2 and 11 years (Freese et al. 2018). Public lands
grazing pressure is relatively consistent over time, with stocking
rates set by public lands managers. Bison stocking rates at APR
are relatively low compared with cattle stocking rates, while bison
stocking rates on the Snake Butte pasture on the Fort Belknap
Indian Reservation are approximately double those of APR
The American Prairie Reserve (APR) is among the largest private
(Table 1). We did not control for livestock stocking rate in our
landowners in the region with 104,578 acres owned, and 315,047
analyses. Our goal was to compare diversity patterns and estimate
acres of leased public land as of 2020. A fundamental goal of the
species abundance across lands as currently managed, not to
reserve is to restore bison to the landscape to fulfill their ecological
control for all management-related variables.
role as keystone grazers (Knapp et al. 1999, Freese et al. 2018).
Currently, APR has restored bison on 3 management units, We focused on 12 grassland/sagebrush steppe-specialist
consisting of 3 private parcels and 2 contiguous public (Bureau of passerines for this study (Table 2). We did not include grassland-
Land Management, BLM) grazing allotments attached to one unit specialist shorebirds or raptors because point count survey
(Table 1). Bison herds are maintained at stocking rates methods are not well suited to these species. Our focal species
corresponding to normal-year precipitation estimates calculated span a wide range of habitat preferences, from short grass/bare
by BLM staff for public grazing allotments and by a private ground to tall, dense grass, and from sparse to dense shrub cover.
contractor (EMPSi Inc., Boulder, CO) according to NaturalAvian Conservation and Ecology 16(2): 13
http://www.ace-eco.org/vol16/iss2/art13/
Table 2. Focal species list of grassland/sagebrush steppe associated songbirds for this study with conservation status, population trends,
and generalized habitat associations. Species with an asterisk (*) are Northern Great Plains breeding endemics. The USFWS designation
‘Bird of conservation concern’ is abbreviated as BCC.
‡
Conservation Status
Common name Scientific name USFWS BLM Population trend Habitat association
-1 †
(% year )
Horned Lark Eremophila alpestris -2.46 Bare ground/shortgrass
Sprague's Pipit* Anthus spragueii BCC Sensitive -3.06 Dense grass
Chestnut-collared Longspur* Calcarius ornatus BCC Sensitive -4.18 Bare ground/shortgrass
Thick-billed Longspur* Rhynchophanes mccownii BCC Sensitive -4.64 Bare ground/shortgrass
Brewer's Sparrow Spizella breweri BCC Sensitive -1.00 Sagebrush
Vesper Sparrow Pooecetes gramineus -0.86 Generalist
Lark Sparrow Chondestes grammacus -0.75 Bare ground
Lark Bunting Calamospiza melanocorys -2.70 Shrub
Savannah Sparrow Passerculus sandwichensis -1.36 Generalist/Dense Grass
Grasshopper Sparrow Ammodramus savannarum BCC -2.46 Dense grass
Baird's Sparrow* Centronyx bairdii BCC Sensitive -2.06 Dense grass
Western Meadowlark Sturnella neglecta -1.30 Generalist
†
Trend data from Sauer et al. (2017) for 1966-2015. 95% CIs for annual trends do not overlap zero for any species presented here.
‡
USFWS = United States Fish and Wildlife Service, BLM = Bureau of Land Management
To facilitate site selection, the study area was first gridded into 80 vegetation plots per cell. Vegetation plots were located on the
hectare “cells”. We then classified vegetation structure for the center point for each point count location as well as 100 m north
entire study area using remote-sensed imagery from the National and south of those points. Vegetation was sampled within a 5-m
Agriculture Imagery Program (NAIP). We classified vegetation radius of each plot center point. Technicians used a 5-m string
cover by calculating normalized difference vegetation index attached to a heavy object placed at the center point and walked
(NDVI) and used k-means clustering on NDVI values (6 clusters) the circumference of the vegetation plot before estimation. For
to assign vegetation structure to one of 6 categories based on each plot, percent groundcover was estimated for bare ground,
NDVI value; water (< -0.30), bare ground (-0.30 - -0.08), sparse lichen/moss, rock, native grass, non-native grass, forbs, and woody
grass (-0.08 - 0.02), grass (-0.02 - 0.10), shrub (0.10 - 0.29), or stems. Percent shrub cover was estimated from above for
forest/dense shrub ( > 0.29). We filtered sites, retaining only those sagebrush (Artemesia tridentata) and all other woody shrubs
with greater than 85% bare ground, sparse grass, grass, and shrub combined. Average height was estimated for native and non-
combined. Additional sites were later dropped if they were found native grass, forbs, sagebrush, and other woody shrubs.
to have any trees (juniper or cottonwood). We randomly selected
cells from the pool, roughly stratified such that equal numbers of Statistical analyses
cells were selected for bison and cattle portions of APR Estimating Abundance
management units where bison and cattle pastures are adjacent.
We used distance sampling to estimate density and abundance of
each species within each 80-hectare cell (Buckland et al. 1993).
Field data Given 3 non-overlapping point count circles of 250m radius, we
Songbird abundance
assumed 58.8 surveyed hectares to be representative of bird
To estimate the abundance of focal songbirds we conducted three communities within an 80 hectare cell. To estimate detection
10-minute 250 m fixed-radius point counts laid out along either functions for each species we fit models using half-normal and
a SW-NE or SE-NW axis within each 80 ha cell such that the hazard rate key functions, and all combinations of observer and
center of each point count circle was 500 m from the nearest count ordinal date to account for variation in detection probability due
station to prevent double-counting following Hutto et al. (1986). to differences among technicians and across the breeding season.
Each cell was visited once per field season between May 13 and Final models were chosen based on model fit (AIC) such that the
June 5, in 2018 and in 2019. All birds seen or heard were recorded, simplest model with < 4 ΔAICc was chosen. We used the three
along with distance and bearing. Bearing to each individual bird point-count stations within each block to estimate detection
was recorded only to help prevent double-counting. Point counts probability. Analyses were done using the ‘Distance’ package
were started no earlier than 30 minutes before sunrise and no later (Miller et al. 2019). This and all following analyses were done in
than 8:00 am to minimize variation in detectability related to time R v. 3.5.1 “Feather Spray” (R Core Team 2015).
of day. Following Hutto et al. (1986), point counts were not
Community Diversity
conducted during strong wind or precipitation.
We used species richness and Shannon’s diversity index as indices
Vegetation communities
of community diversity for each sampling cell. Species richness
We used ocular estimation of ground cover and shrub cover to estimates are a fundamental and simple metric of community
characterize vegetation communities at our sampling sites. Each diversity. However, estimates of species richness can be biased and
cell contained 3 point-count locations and we sampled 3 inaccurate when effort or detectability of species are
vegetation plots for each point-count location, for a total of 9 heterogeneous with respect to sampling effort (Boulinier et al.Avian Conservation and Ecology 16(2): 13
http://www.ace-eco.org/vol16/iss2/art13/
1998). To alleviate potential bias, we calculated Chao’s species Species-specific responses to grazing
richness estimator, ‘Chao1’, for each sampling cell using the
We fit generalized linear models to describe the relationships
package ‘SpadeR’(Chao and Chiu 2016). For our data, these
between estimated abundance and grazer, controlling for grazing-
estimates were identical to raw species richness estimates,
independent covariates, for 11 of 12 focal species. We had too few
potentially due to the generally high and invariable detectability
detections of Thick-billed Longspur to model responses to
of grassland birds during the breeding season (Lipsey and Naugle
grazing treatment for this species. This suite of species includes
2017) and the limited pool of focal species. Accordingly, species
three of highest conservation concern in the region— Baird’s
richness was simply defined as the number of species present
Sparrow, Sprague’s Pipit, and Chestnut-collared Longspur—but
within a given cell for community diversity analyses. We chose
most species within this group are experiencing significant
Shannon’s diversity index as a secondary metric of community
negative trends (Sauer et al. 2017, Somershoe 2018; Table 2). Our
diversity because it increases with both raw species richness and
focal group also includes Brewer’s Sparrow, a sagebrush obligate
species evenness and rewards the presence of rare species (Pielou
songbird of high conservation interest across the western US.
1966), which are generally those of highest conservation concern
Taken together, this group of species encompasses a broad range
in our system. We compiled estimated abundances for all bird
of vegetation structure preferences and is the most diverse
species for each cell. Shannon’s diversity index was calculated
grassland songbird assemblage studied in the context of bison
using the ‘diversity’ function in the package ‘vegan’ (Oksanen et
restoration (Knopf 1996, Somershoe 2018). Due to the known
al. 2019).
over-dispersion of avian count data (White and Bennetts 1996),
We then used linear mixed-effects models to test whether the two we used negative binomial generalized linear models to assess
metrics of diversity differed among grazing treatments. We whether density of species of concern differed between grazing
determined the best models of diversity by including grazer and treatments after accounting for other factors known to be highly
several grazer-independent variables known to affect habitat influential on grassland bird occupancy and abundance;
selection of grassland birds. We used remotely-sensed data to topography, soil productivity and shrub cover (Lipsey and Naugle
estimate slope, terrain roughness, shrub cover, and range 2017, Somershoe 2018, Pulliam et al. 2020). Abundance estimates
productivity for each cell. We extracted shrub cover percentage from distance sampling (see above) were rounded to the nearest
using the National Land Cover Dataset (Xian et al. 2015, Yang integer for model fitting. For these analyses, we included fixed
et al. 2018). Estimates of average slope and terrain roughness were effects of grazer, slope, terrain roughness, normal year range
extracted from the Nation Elevation Dataset provided by U.S. productivity (NRCS 2003), and year, as well as linear and
Geological Survey (Gesch et al. 2002). Average rangeland quadratic terms for woody shrub cover. We chose to include shrub
productivity for each sampling cell was extracted from the NRCS cover because it is highly variable across our study area, is known
Web Soil Survey (NRCS 2003). Rangeland productivity is a to strongly influence occupancy of grassland songbirds
composite metric that includes soil, rainfall, and topographical (Somershoe 2018), and is not strongly influenced by low or
information to estimate the annual potential production of forage moderate-intensity grazing over short periods of time (Holechek
given average annual precipitation. We included a quadratic term and Stephenson 1983).
for shrub cover and a binary variable for year. All of the above
were included as fixed effects. Because not all cells were sampled RESULTS
in each year, we included cell as a random effect. We used the We conducted 279 point-counts within a total of 64 survey cells
‘dredge’ function in the ‘MuMin’ package (Barton 2019) to fit all during 2018 and 2019, 23 in bison pastures and 41 in cattle
possible models and assessed model fit using AIC (Burnham and pastures (Fig. 1). We detected all 12 focal grassland songbird
Anderson 2002). We assessed all models with ΔAICc < 2 but species and all species were detected in both bison and cattle plots.
removed models with uninformative parameters per Arnold Grassland bird community diversity was similar between cattle
(2010). and bison plots after accounting for effects of grazing-
Ordination independent variables (Table 3, Fig. 2). This pattern was
consistent using both species richness and Shannon’s index as
We used non-metric multidimensional scaling (NMDS) using metrics of community diversity (Table 3). Among grazing-
Bray-Curtis dissimilarity matrices to visualize variation in directly independent variables, slope had a negative effect on species
sampled local-scale bird and vegetation communities within and richness (β = -0.21; p = 0.02) but the null model best explained
among sites across the two grazing treatments (Kruskal 1964). variation in Shannon’s diversity (Table 3).
Because NMDS algorithms can converge on local optima, we
conducted a minimum of 40 random starts to identify an optimum NMDS ordination procedures arrived at two-dimensional
solution. Solutions were then evaluated for fit based on their stress solutions for both avian and vegetative communities. Stress values
values according to Clarke (1993), such that stress values below of 0.19 and 0.18, respectively, indicate ordination plots adequately
0.2 provide a useful representation of the data, and goodness of represent similarity relationships among avian and vegetative
fit improving as values approach 0. After solutions were data, respectively (Clarke 1993). Ordination plots show broad
identified, we used “envfit” to identify which species were overlap in vegetative communities between the two treatments,
correlated with our two NMDS axes, as well as the directionality but cattle plots encompassed a broader range of vegetative and
and strength of these associations. Significance of these bird communities, particularly those with higher percentages of
correlations was assessed using 999 permutations and correlations bare ground and rock, with associated bird species, Horned Lark
are only presented for species where p < 0.05. All ordination and Lark Bunting (Fig. 3).
analyses were performed using the ‘vegan’ package (Oksanen et
al. 2019).Avian Conservation and Ecology 16(2): 13
http://www.ace-eco.org/vol16/iss2/art13/
and Chestnut-collared Longspur abundance was highest at sites
Table 3. Model selection table for the effects of grazer and local with the high and low shrub cover percentages but declined with
scale (80 ha) grazing-independent site attributes on grassland increasing shrub cover overall (Table 4). While our results generally
songbird diversity. All variables were included as fixed-effects and agree with known habitat associations of these species (reviewed in
a random effect of cell ID was included in all models. Only models Somershoe 2018), our study design only allows for inference at the
with ΔAICc < 2 and the null model are listed for each metric. local scale and does not examine relationships between detailed
Competitive models with uninformative parameters (Arnold characteristics of vegetation structure and species abundance.
2010) were removed. Recent work focusing specifically on these relationships should be
used to inform vegetation management and assessment of priority
Model AICc ΔAICc wi ∑wi conservation areas for individual species (e.g., Lipsey & Naugle
Species richness 2017; Somershoe 2018; Pulliam et al. 2020).
slope + (1|cell) 311.5 0.00 0.26 0.26
(1|cell) 312.1 0.64 0.19 0.45
Shannon's diversity index Fig. 3. Top: NMDS ordination plots showing the distribution of
(1|cell) 29.0 0.00 0.39 0.39 avian and vegetation communities across three grazing
management regimes. Bottom: Correlations between grassland
bird species, vegetation communities and NMDS ordination
axes. Only bird species and vegetation components with
significant correlations are shown. Vector length is proportional
Fig. 2. Comparisons of grassland bird community diversity, to correlation strength.
quantified as species richness and Shannon's diversity index,
across two grazing management regimes. Bison are grazed year-
round with free movement within management units, while
cattle are grazed seasonally and are rotated among pastures
within management units.
Abundances of songbird species were broadly similar between
bison and cattle cells after accounting for variation in grazing- Fig. 4. Parameter estimates and associated standard errors for
independent variables. There was no significant effect of grazer songbird estimated abundance as a function of grazer,
species on 9 of 11 focal species but estimated abundances of vesper controlling for grazer-independent variables (Table 4).
sparrow and grasshopper sparrow were higher on bison pastures Coefficient values are for cattle in comparison to bison, thus,
(Table 4, Fig. 4). Chestnut-collared Longspur and Lark Sparrow positive values mean higher abundances in the presence of cattle.
showed trends towards higher abundance on cattle plots (Fig. 4),
but these trends were not significant (Table 4), potentially due to
large variation in abundance across sites in the case of the
longspur, and an overall paucity of detections in the case of Lark
Sparrow. The influence of grazer-independent covariates on the
three northern great plains breeding endemic species—Baird’s
Sparrow, Chestnut-collared Longspur, and Sprague’s Pipit—
shared some similarities but also with distinct differences (Table
4). All three species showed declining abundance with increasing
slope and decreasing terrain roughness. Both Baird’s Sparrow and
Sprague’s Pipit showed increasing abundance with higher
rangeland productivity values. Abundance of Baird’s Sparrows
declined at sites with high shrub cover, while Sprague’s Pipit
abundance peaked at sites with intermediate shrub cover valuesAvian Conservation and Ecology 16(2): 13
http://www.ace-eco.org/vol16/iss2/art13/
Table 4. Parameter estimates and associated standard errors for grazer and grazing-independent site attributes on estimated abundance
of grassland songbirds in our study area. Grazer effects are in comparison to bison. Effect sizes are only reported for variables where
p < 0.05.
2
grazer (cattle) range prod. % shrub cover % shrub cover slope terrain roughness year (2019)
-yr
(lbs/ha ) (80 ha) (80 ha)
Horned Lark - -0.002 ±Avian Conservation and Ecology 16(2): 13
http://www.ace-eco.org/vol16/iss2/art13/
Pasture size and stocking rates are both known to mediate effects thank Amy Seaman, Lars Anderson, Scott Heidebrink, and many
of grazers on grassland bird communities (Sliwinski and Koper tremendous interns for invaluable assistance in the field. This work
2015, Lipsey and Naugle 2017, Vold et al. 2019). Little is known was made possible by the generous support of John and Adrienne
about these relationships in the context of bison due to limited Mars. All work was conducted under the auspices of the
sample size of management units and the distribution of herds Smithsonian Conservation Biology Institute ACUC Committee.
across multiple ecosystems. We propose that free-ranging bison
grazing at large scales (thousands of bison over hundreds of
thousands of acres) may yield significantly different results.
Optimum stocking rates for bird communities are certain to vary LITERATURE CITED
with rangeland productivity (Lipsey and Naugle 2017) such that Allred, B. W., S. D. Fuhlendorf, and R. G. Hamilton. 2011. The
inference from one site may not be directly applicable elsewhere. role of herbivores in Great Plains conservation: Comparative
ecology of bison and cattle. Ecosphere 2:1-17. https://doi.
Several important data gaps remain regarding the impact of
org/10.1890/ES10-00152.1
native grazers on grassland bird communities. First, occupancy
and/or density are not perfect proxies for demographic rates. More Allred, B. W., S. D. Fuhlendorf, T. J. Hovick, R. D. Elmore, D.
work is needed to understand how critical vital rates including M. Engle, and A. Joern. 2013. Conservation implications of native
nest predation, nest parasitism, and adult and juvenile survival and introduced ungulates in a changing climate. Global Change
vary in the presence of native versus non-native grazers. Biology 19:1875-1883. https://doi.org/10.1111/gcb.12183
Importantly, we need to know what the habitat potential is for
Arnold, T. W. 2010. Uninformative parameters and model
these grasslands for imperiled bird productivity and if we are
selection using Akaike’s information criterion. Journal of Wildlife
maximizing it, given the critical status of these species. Second,
Management 74:1175-1178. https://doi.org/10.1111/j.1937-2817.2010.
raptors, shorebirds, and riparian-associated birds that rely on
tb01236.x
grassland ecosystems are difficult to survey via standard methods
but are important members of grassland bird communities, and Barton, K. 2020. MuMIn: Multi-Model Inference. R package
some of these species are also in rapid decline (e.g., Mountain version 1.43.17. https://CRAN.R-project.org/package=MuMIn
Plover, Sauer et al. 2017, Rosenberg et al. 2019).
Boulinier, T., J. D. Nichols, J. R. Sauer, J. E. Hines, and K. H.
Year-round grazing of bison at stocking rates similar to (APR) Pollock. 1998. Estimating species richness: the importance of
and above (Fort Belknap) standard cattle stocking rates did not heterogeneity in species detectability. Ecology 79:1018-1028.
cause degradation of grassland bird communities and did yield https://doi.org/10.1890/0012-9658(1998)079[1018:ESRTIO]2.0.CO;2
high quality habitat for grassland birds without rotation among
pastures. In areas where intensive management of cattle is Briske, D. D., J. D. Derner, , D. G.Milchunas, and K. Tate. 2011.
impractical due to lack of fencing or water infrastructure, where An evidence-based assessment of prescribed grazing practices.
cattle are known to cause environmental degradation (reviewed Book Chapter. In: D.D. Briske, editor. Conservation Benefits of
in Fleischner 1994), or where land management legislation Rangeland Practices: Assessment, Recommendations, and
prioritizes native species, bison are a low-infrastructure Knowledge Gaps. United States Department of Agriculture,
alternative capable of supporting diverse grassland bird Natural Resources Research Service. pp. 21-74.
communities which include many species of high conservation
Buckland, S. T., D. R. Anderson, K. P. Burnham, and J. L. Laake.
concern.
1993. Distance sampling: estimating abundance of biological
populations. Chapman & Hall, London.
Responses to this article can be read online at: Burnham, K. P., and D. Anderson. 2002. Model selection and
https://www.ace-eco.org/issues/responses.php/1944 multimodal inference: a practical information-theoretic
approach. Springer-Verlag, New York, NY.
Chao, A., and C.-H. Chiu. 2016. Species richness: estimation and
Author Contributions: comparison. Wiley StatsRef: Statistics Reference Online 1:1-26.
https://doi.org/10.1002/9781118445112.stat03432.pub2
AJB, KEK & WJM conceived of the idea and study design. AJB
and HS collected the data and performed the analyses. AJB wrote Chisholm, B., J. Driver, S. Dube, and H. P. Schwarcz. 1986.
the paper and all authors contributed to revisions. Assessment of prehistoric bison foraging and movement patterns
via stable-carbon isotope analysis. Plains Anthropologist
Acknowledgments: 31:193-205. https://doi.org/10.1080/2052546.1986.11909302
Thank you to 2 anonymous reviewers for comments that improved Clarke, K. R. 1993. Non‐parametric multivariate analyses of
the manuscript. We thank the people of the Assiniboine (Nakoda) changes in community structure. Australian Journal of Ecology
and Gros Ventre (Aaniiih) Tribes for giving us access to their homes. 18:117-143. https://doi.org/10.1111/j.1442-9993.1993.tb00438.x
We would also like to thank Curt Freese, Daniel Kinka, and Damien Coppedge, B. R., and J. H. Shaw. 1997. Effects of horning and
Austin at the American Prairie Reserve, B.J. Rhodes with the BLM rubbing behavior by bison (Bison bison) on woody vegetation in
Malta Field Office, Harold Main from Fort Belknap Fish & Wildlife a tallgrass prairie. The American Midland Naturalist
Department, and Randy Matching at the Charles M. Russell NWR 138:189-196. https://doi.org/10.2307/2426665
for assistance with fieldwork and planning. AJB would also like toAvian Conservation and Ecology 16(2): 13
http://www.ace-eco.org/vol16/iss2/art13/
Dosskey, M. G. 1998. Viewpoint: applying riparian buffers to Conservation: Restriction of Evolutionary Potential Or a Riposte
Great Plains. Journal of Range Management 51:428-431. https:// to Threatening Processes? Springer, New York. https://doi.
doi.org/10.2307/4003328 org/10.1007/978-1-4614-0902-1_15
Dreitz, V. J., L. T. Stinson, B. A. Hahn, J. D. Tack, and P. M. Gesch, D., M. Oimoen, S. Greenlee, C. Nelson, M. Steuck, and
Lukacs. 2017. A large-scale perspective for managing prairie D. Tyler. 2002. The national elevation dataset. Photogrammetric
avifauna assemblages across the western US: influences of Engineering and Remote Sensing 68:5-11.
habitat, land ownership and latitude. PeerJ 5:e2879. https://doi.
Greibel, R. L., S. L. Winter, and A. A. Steuter. 1998. Grassland
org/10.7717/peerj.2879
birds and habitat structure in sandhills prairie managed using
Eby, S., D. E. Burkepile, R. W. S. Fynn, C. E. Burns, N. Govender, cattle or bison plus fire. Great Plains Research 8:255-268.
N. Hagenah, S. E. Koerner, K. J. Matchett, D. I. Thompson, K.
Henwood, W. D. 2010. Toward a strategy for the conservation of
R. Wilcox, S. L. Collins, K. P. Kirkman, A. K. Knapp, and M.
the world’s temperate grasslands. Great Plains Research
D. Smith. 2014. Loss of a large grazer impacts savanna grassland
20:121-134.
plant communities similarly in North America and South Africa.
Oecologia 175:293-303. https://doi.org/10.1007/s00442-014-2895-9 Hoekstra, J. M., T. M. Boucher, T. H. Ricketts, and C. Roberts.
2005. Confronting a biome crisis: global disparities of habitat loss
Fleischner, T. L. 1994. Ecological costs of livestock grazing in and protection. Ecology Letters 8:23-29. https://doi.org/10.1111/
Western North America. Conservation Biology 8:629-644. j.1461-0248.2004.00686.x
https://doi.org/10.1046/j.1523-1739.1994.08030629.x
Holechek, J. L., and T. Stephenson. 1983. Comparison of big
Forrest, S., H. Strand, W. H. Haskins, C. Freese, J. Proctor, and sagebrush vegetation in northcentral New Mexico under
E. Dinerstein. 2004. Ocean of Grass: A Conservation Assessment moderately grazed and grazing excluded conditions. Journal of
for the Northern Great Plains. Northern Plains Conservation Range Management 36:455-456. https://doi.org/10.2307/3897939
Network and Northern Great Plains Ecoregion, WWF-US,
Bozeman, MT. Hutto, R. L., S. M. Pletschet, and P. Hendricks. 1986. A fixed-
radius point count method for nonbreeding and breeding season
Freese, C. H., K. E. Aune, D. P. Boyd, J. N. Derr, S. C. Forrest,
use. The Auk 103:593-602. https://doi.org/10.1093/auk/103.3.593
C. Cormack Gates, P. J. P. Gogan, S. M. Grassel, N. D. Halbert,
K. Kunkel, and K. H. Redford. 2007. Second chance for the plains
Knapp, A. K., J. M. Blair, J. M. Briggs, S. L. Collins, D. C.
bison. Biological Conservation 136:175-184. https://doi.
Hartnett, L. C. Johnson, and E. G. Towne. 1999. The keystone
org/10.1016/j.biocon.2006.11.019
role of bison in North American tallgrass prairie. BioScience
Freese, C. H., S. D. Fuhlendorf, and K. Kunkel. 2014. A 49:39-50. https://doi.org/10.2307/1313492
management framework for the transition from livestock
Knopf, F. L. 1994. Avian assemblages on altered grasslands.
production toward biodiversity conservation on great plains
Studies in Avian Biology 15:247-257.
rangelands. Ecological Restoration 32:358-368. https://doi.
org/10.3368/er.32.4.358 Knopf, F. L. 1996. Prairie Legacies -- Birds. Pages 135-148 Prairie
Conservation. Island Press, Washington, DC.
Freese, C. H., K. E. Kunkel, D. Austin, and B. Holder. 2018. Bison
Management Plan. American Prairie Reserve, Bozeman, MT. Kohl, M. T., P. R. Krausman, K. Kunkel, and D. M. Williams.
2013. Bison versus cattle: Are they ecologically synonymous.
Fuhlendorf, S. D., C. A. Davis, R. D. Elmore, L. E. Goodman,
Rangeland Ecology and Management 66:721-731. https://doi.
and R. G. Hamilton. 2018. Perspectives on grassland conservation
org/10.2111/REM-D-12-00113.1
efforts: Should we rewild to the past or conserve for the future?
Philosophical Transactions of the Royal Society B: Biological Kruskal, J. B. 1964. Multidimensional scaling by optimizing
Sciences 373. goodness of fit to a nonmetric hypothesis. Psychometrika 29:1-27.
https://doi.org/10.1007/BF02289565
Fuhlendorf, S. D., D. M. Engle, R. D. Elmore, R. F. Limb, and
T. G. Bidwell. 2012. Conservation of pattern and process: Limb, R. F., S. D. Fuhlendorf, and D. E. Townsend. 2009.
developing an alternative paradigm of rangeland management. Heterogeneity of thermal extremes: driven by disturbance or
Rangeland Ecology and Management 65:579-589. https://doi. inherent in the landscape. Environmental Management
org/10.2111/REM-D-11-00109.1 43:100-106. https://doi.org/10.1007/s00267-008-9147-x
Gage, A. M., S. K. Olimb, and J. Nelson. 2016. Plowprint: tracking Lipsey, M. K., and D. E. Naugle. 2017. Precipitation and soil
cumulative cropland expansion to target grassland conservation. productivity explain effects of grazing on grassland songbirds.
Great Plains Research 26:107-116. https://doi.org/10.1353/ Rangeland Ecology and Management 70:331-340. https://doi.
gpr.2016.0019 org/10.1016/j.rama.2016.10.010
Gates, C. C., P. Jones, M. Suitor, A. F. Jakes, M. S. Boyce, K. E. Lott, D. F. 2002. American bison: a natural history. University of
Kunkel, and K. Wilson. 2012. The influence of land use and fences California Press, Los Angeles, CA.
on habitat effectiveness, movements and distribution of
Lueders, A. S., P. L. Kennedy, and D. H. Johnson. 2006. Influences
pronghorn in the grasslands of North America. Pages 1-320 in
of management regimes on breeding bird densities and habitat in
M. J. Somers and M. W. Hayward, editors. Fencing forAvian Conservation and Ecology 16(2): 13
http://www.ace-eco.org/vol16/iss2/art13/
mixed-grass prairie: an example from North Dakota. Journal of R Core Team. 2015. R: A language and environment for statistical
Wildlife Management 70:600-606. https://doi.org/10.2193/0022-541X computing. R Foundation for Statistical Computing, Vienna,
(2006)70[600:IOMROB]2.0.CO;2 Austria.
Manning, R. 1995. Grassland: The history, biology, politics and Ranglack, D., and J. T. du Toit. 2015. Habitat selection by free-
promise of the American prairie. Penguin Books, New York, NY. ranging bison in a mixed grazing system on public land.
Rangeland Ecology and Management 68:349-353. https://doi.
McMillan, N. A., K. E. Kunkel, D. L. Hagan, and D. S. Jachowski. org/10.1016/j.rama.2015.05.008
2018. Plant community responses to bison reintroduction on the
Rosenberg, K. V., A. M. Dokter, P. J. Blancher, J. R. Sauer, A. C.
Northern Great Plains, United States: a test of the keystone
Smith, P. A. Smith, J. C. Stanton, A. Panjabi, L. Helft, M. Parr,
species concept. Restoration Ecology: 27(2):379-388. https://doi.
and P. P. Marra. 2019. Decline of the North American avifauna.
org/10.1111/rec.12856
Science 366:120-124. https://doi.org/10.1126/science.aaw1313
Milchunas, D. G., W. K. Lauenroth, and I. C. Burke. 1998.
Sanderson, E. W., K. H. Redford, B. Weber, K. Aune, D. Baldes,
Livestock grazing: animal and plant biodiversity of shortgrass
J. Berger, D. Carter, C. Curtin, J. Derr, S. Dobrott, E. Fearn, C.
steppe and the relationship to ecosystem function. Oikos
Fleener, S. Forrest, C. Gerlach, C. Cormack Gates, J. E. Gross, P.
83:65-74. https://doi.org/10.2307/3546547
Gogan, S. Grassel, J. A. Hilty, M. Jensen, K. Kunkel, D. Lammers,
Miller, D. L., E. Rexstad, L. Thomas, L. Marshall, and J. L. Laake. R. List, K. Minkowski, T. Olson, C. Pague, P. B. Robertson, and
2019. Distance sampling in R. Journal of Statistical Software B. Stephenson. 2008. The ecological future of the North
89:1-28. https://doi.org/10.18637/jss.v089.i01 American bison: conceiving long-term, large-scale conservation
of wildlife. Conservation Biology 22:252-266. https://doi.
Moran, M. D. 2014. Bison grazing increases arthropod
org/10.1111/j.1523-1739.2008.00899.x
abundance and diversity in a tallgrass prairie. Environmental
Entomology 43:1174-1184. https://doi.org/10.1603/EN14013 Sauer, J. R., K. L. Pardieck, D. J. Ziolkowski, A. C. Smith, M.-
A. R. Hudson, V. Rodriguez, H. Berlanga, D. K. Niven, and W.
Naito, A. T., and D. M. Cairns. 2011. Patterns and processes of
A. Link. 2017. The first 50 years of the North American Breeding
global shrub expansion. Progress in Physical Geography
Bird Survey. The Condor 119:576-593. https://doi.org/10.1650/
35:423-442. https://doi.org/10.1177/0309133311403538
CONDOR-17-83.1
Natural Resources Conservation Service (NRCS). 2003. National
Segar, J., and A. Keane. 2020. Species and demographic responses
Range and Pasture Handbook. Revision 1. U.S. Department of
to wildlife‐friendly fencing on ungulate crossing success and
Agriculture, Natural Resources Conservation Service, Grazing
behavior. Conservation Science and Practice 2(10):e285
Lands Technology Institute. Washington, DC, USA.
Sliwinski, M. S., M. E. Burbach, L. A. Powell, and W. H. Schacht.
Nickell, Z., S. Varriano, E. Plemmons, and M. D. Moran. 2018.
2018. Factors influencing ranchers' intentions to manage for
Ecosystem engineering by bison (Bison bison) wallowing
vegetation heterogeneity and promote cross-boundary management
increases arthropod community heterogeneity in space and time.
in the northern great plains. Ecology and Society 23(4):45.
Ecosphere 9. https://doi.org/10.1002/ecs2.2436
Sliwinski, M. S., and N. Koper. 2015. Managing mixed-grass
Oksanen, J., F. G. Blanchet, M. Friendly, R. Kindt, P. Legendre,
prairies for songbirds using variable cattle stocking rates.
D. McGlinn, P. R. Minchin, R. B. O'Hara, G. L. Simpson, P.
Rangeland Ecology and Management 68:470-475. https://doi.
Solymos, M. Henry, H. Stevens, E. Szoecs and H. Wagner. 2020.
org/10.1016/j.rama.2015.07.010
vegan: Community Ecology Package. R package version 2.5-7.
https://CRAN.R-project.org/package=vegan Soil Survey Staff, Natural Resources Conservation Service. Web
Soil Survey. United States Department of Agriculture http://
Oquiñena Valluerca, I. 2009. Analysis of vegetation changes
websoilsurvey.sc.egov.usda.gov/
induced by a European bison herd in the Kraansvlak area
(2003-2009). Utrecht University, Netherlands. Somershoe, S. 2018. A full annual-cycle conservation strategy for
Sprague’s Pipit, Chestnut-collared and McCown’s Longspurs,
Peden, D. G., G. M. Van Dyne, R. W. Rice, and R. M. Hansen.
and Baird’s Sparrow. U.S. Department of the Interior, Fish and
1974. The trophic ecology of Bison bison L. on shortgrass plains.
Wildlife Service. Washington, DC, USA.
Journal of Applied Ecology 11:489-497. https://doi.org/10.2307/2402203
Steuter, A. A., and L. Hidinger. 1999. Comparative ecology of
Pielou, E. C. 1966. Shannon’s formula as a measure of specific Bison and cattle on mixed-grass prairie. Great Plains Research
diversity: its use and misuse. The American Naturalist 9:329-342.
100:463-465. https://doi.org/10.1086/282439
Stevens, B. S., J. W. Connelly, and K. P. Reese. 2012. Multi-scale
Powell, A. F. L. A. 2006. Effects of prescribed burns and bison assessment of greater sage-grouse fence collision as a function of
(Bos bison) grazing on breeding bird abundances in tallgrass site and broad scale factors. Journal of Wildlife Management
prairie. The Auk 123:183-197. https://doi.org/10.1093/auk/123.1.183 76:1370-1380. https://doi.org/10.1002/jwmg.397
Tack, J. D., A. F. Jakes, P. F. Jones, J. T. Smith, R. E. Newton, B.
Pulliam, J. P., S. Somershoe, M. Sather, and L. B. McNew. 2020.
H. Martin, M. Hebblewhite, and D. E. Naugle. 2019. Beyond
Habitat targets for imperiled grassland birds in northern mixed-
protected areas: Private lands and public policy anchor intact
grass prairie. Rangeland Ecology and Management. https://doi.
pathways for multi-species wildlife migration. Biological
org/10.1016/j.rama.2020.02.006
Conservation 234:18-27. https://doi.org/10.1016/j.biocon.2019.03.017Avian Conservation and Ecology 16(2): 13
http://www.ace-eco.org/vol16/iss2/art13/
Toombs, T. P., J. D. Derner, D. J. Augustine, B. Krueger, and S.
Gallagher. 2010. Managing for biodiversity and livestock.
Rangelands 32:10-15. https://doi.org/10.2111/RANGELANDS-
D-10-00006.1
Truett, J. C., M. Phillips, K. Kunkel, and R. Miller. 2001.
Managing bison to restore biodiversity. Great Plains Research
11:123-144.
U.S. Department of the Interior. 2018. Bison Conservation
Initiative. U.S. Department of the Interior, Assistant Secretary
for Fish and Wildlife and Parks, Washington, DC. https://www.
fws.gov/uploadedFiles/BisonConservationInitiative.reduced%20size.
pdf
Vold, S. T., L. I. Berkeley, and L. B. McNew. 2019. Effects of
Livestock Grazing Management on Grassland Birds in a
Northern Mixed-Grass Prairie Ecosystem. Rangeland Ecology
and Management 72:933-945. https://doi.org/10.1016/j.rama.2019.08.005
White, G. C., and R. E. Bennetts. 1996. Analysis of frequency
count data using the negative binomial distribution. Ecology
77:2549-2557. https://doi.org/10.2307/2265753
Williams, E. J., and W. A. Boyle. 2018. Patterns and correlates of
within-season breeding dispersal: A common strategy in a
declining grassland songbird. The Auk 135:1-14. https://doi.
org/10.1642/AUK-17-69.1
Wright, C. K., and M. C. Wimberly. 2013. Recent land use change
in the Western Corn Belt threatens grasslands and wetlands.
Proceedings of the National Academy of Sciences of the United
States of America 110:4134-4139. https://doi.org/10.1073/
pnas.1215404110
Xian, G., C. Homer, M. Rigge, H. Shi, and D. Meyer. 2015.
Characterization of shrubland ecosystem components as
continuous fields in the northwest United States. Remote Sensing
of Environment 168:286-300. https://doi.org/10.1016/j.rse.2015.07.014
Yang, L., S. Jin, P. Danielson, C. Homer, L. Gass, S. M. Bender,
A. Case, C. Costello, J. Dewitz, J. Fry, M. Funk, B. Granneman,
G. C. Liknes, M. Rigge, and G. Xian. 2018. A new generation of
the United States national land cover database: requirements,
research priorities, design, and implementation strategies. ISPRS
Journal of Photogrammetry and Remote Sensing 146:108-123.
https://doi.org/10.1016/j.isprsjprs.2018.09.006
Editor-in-Chief: Keith A.Hobson
Subject Editor: Scott WilsonAppendix 1. Estimated abundance of grassland songbird focal species for each 80-ha sampling cell for 2018 and 2019.
cell year grazer BAIS GRSP SPPI LARB CCLO LASP HOLA SAVS VESP MCLO BRSP WEME
1076 2018 cow 0.00 0.00 0.00 6.38 7.99 0.00 11.47 0.00 0.00 0.00 42.66 15.74
1076 2019 cow 0.00 0.00 0.00 10.68 0.00 0.00 69.33 8.48 51.04 0.00 143.02 26.17
1243 2018 cow 0.00 0.00 0.00 19.15 0.00 0.00 11.47 0.00 3.25 0.00 10.67 13.99
1243 2019 cow 0.00 0.00 0.00 7.18 0.00 0.00 32.85 0.00 3.25 0.00 51.44 13.67
1391 2018 cow 0.00 0.00 0.00 0.00 3.99 0.00 20.65 0.00 8.13 0.00 53.33 13.99
1392 2018 cow 0.00 15.13 0.00 2.13 0.00 0.00 16.06 0.00 9.76 0.00 21.33 19.23
1392 2019 cow 0.00 18.46 0.00 10.76 0.00 0.00 26.28 4.58 11.39 0.00 22.86 10.25
1553 2018 cow 0.00 0.00 0.00 2.13 0.00 0.00 13.76 0.00 1.63 0.00 26.66 20.98
1600 2018 bison 12.27 37.81 0.00 0.00 19.96 0.00 11.47 10.47 4.88 0.00 21.33 22.73
1878 2018 cow 0.00 0.00 0.00 116.89 0.00 0.00 50.05 0.00 13.49 0.00 0.00 21.06
1878 2019 cow 0.00 0.00 0.00 5.38 0.00 0.00 32.85 0.00 16.27 0.00 17.15 10.25
1921 2018 bison 0.00 52.94 0.00 0.00 0.00 0.00 4.59 0.00 3.25 0.00 16.00 27.98
1922 2018 cow 0.00 30.25 0.00 0.00 0.00 0.00 9.18 0.00 6.51 0.00 21.33 19.23
1922 2019 cow 0.00 36.92 0.00 0.00 0.00 0.00 19.71 0.00 19.52 0.00 34.29 20.50
2027 2018 cow 0.00 22.69 0.00 0.00 15.97 0.00 6.88 6.98 13.02 0.00 16.00 24.48
2027 2019 cow 0.00 92.30 0.00 0.00 0.00 0.00 13.14 13.73 8.13 0.00 34.29 18.79
2146 2018 cow 0.00 0.00 0.00 23.41 3.99 0.00 25.24 0.00 6.51 0.00 10.67 22.73
2146 2019 cow 0.00 0.00 0.00 28.47 0.00 0.00 69.33 0.00 25.52 0.00 28.60 33.31
2197 2018 cow 0.00 0.00 0.00 132.47 0.00 0.00 0.00 0.00 6.75 0.00 31.95 25.28
2254 2018 cow 0.00 0.00 0.00 19.15 3.99 0.00 11.47 0.00 8.13 0.00 74.66 12.24
2334 2018 cow 10.22 60.50 5.60 0.00 55.90 0.00 6.88 6.98 0.00 0.00 0.00 12.24
2334 2019 cow 54.12 163.76 10.68 0.00 86.06 0.00 0.00 16.66 0.00 0.00 0.00 11.62
2648 2018 cow 18.40 45.38 5.60 0.00 39.93 0.00 0.00 10.47 0.00 0.00 0.00 8.74
2648 2019 cow 38.66 93.57 10.68 0.00 86.06 0.00 0.00 38.88 0.00 0.00 0.00 29.04
2673 2018 cow 0.00 0.00 0.00 155.85 0.00 0.00 100.10 0.00 26.99 0.00 53.25 21.06
2845 2018 bison 0.00 168.97 0.00 15.59 0.00 0.00 16.68 0.00 40.48 0.00 31.95 46.34
2846 2018 bison 2.04 68.07 0.00 14.90 0.00 0.00 0.00 0.00 6.51 0.00 0.00 19.23
2847 2018 bison 0.00 68.07 0.00 6.38 0.00 0.00 11.47 0.00 9.76 0.00 0.00 27.98
2847 2019 bison 0.00 74.47 69.94 0.00 0.00 0.00 0.00 0.00 31.90 0.00 0.00 35.69
1You can also read