Brain Stimulation - CCNY Neural Engineering Group
←
→
Page content transcription
If your browser does not render page correctly, please read the page content below
Brain Stimulation 14 (2021) 1154e1168

                                                             Contents lists available at ScienceDirect

                                                                   Brain Stimulation
                                journal homepage: http://www.journals.elsevier.com/brain-stimulation

Adaptive current-flow models of ECT: Explaining individual static
impedance, dynamic impedance, and brain current density
Gozde Unal a, *, Jaiti K. Swami a, Carliza Canela a, Samantha L. Cohen b, Niranjan Khadka c,
Mohamad FallahRad a, Baron Short d, Miklos Argyelan e, Harold A. Sackeim f,
Marom Bikson a
a
  Department of Biomedical Engineering, The City College of New York, CUNY, New York, NY, USA
b
  Department of Biomedical Engineering, Cornell University, Ithaca, NY, 14850, USA
c
  Department of Psychiatry, Laboratory for Neuropsychiatry and Neuromodulation, Massachusetts General Hospital, Harvard Medical School, MA, USA
d
  Department of Psychiatry and Behavioral Sciences, Medical University of South Carolina, Charleston, SC, USA
e
  Center for Neurosciences, The Feinstein Institute for Medical Research, North Shore- Long Island Jewish Health System, Manhasset, NY, 11030, USA
f
  Department of Psychiatry and Radiology, Vagelos College of Physicians and Surgeons, Columbia University, New York, USA

a r t i c l e i n f o                                 a b s t r a c t

Article history:                                      Background: Improvements in electroconvulsive therapy (ECT) outcomes have followed refinement in
Received 13 December 2020                             device electrical output and electrode montage. The physical properties of the ECT stimulus, together
Received in revised form                              with those of the patient's head, determine the impedances measured by the device and govern current
19 July 2021
                                                      delivery to the brain and ECT outcomes.
Accepted 22 July 2021
Available online 28 July 2021
                                                      Objective: However, the precise relations among physical properties of the stimulus, patient head
                                                      anatomy, and patient-specific impedance to the passage of current are long-standing questions in ECT
                                                      research and practice. To this end, we develop a computational framework based on diverse clinical data
                                                      sets.
                                                      Methods: We developed anatomical MRI-derived models of transcranial electrical stimulation (tES) that
                                                      included changes in tissue conductivity due to local electrical current flow. These “adaptive” models
                                                      simulate ECT both during therapeutic stimulation using high current (~1 A) and when dynamic
                                                      impedance is measured, as well as prior to stimulation when low current (~1 mA) is used to measure
                                                      static impedance. We modeled two scalp layers: a superficial scalp layer with adaptive conductivity that
                                                      increases with electric field up to a subject-specific maximum (sSS ), and a deep scalp layer with a
                                                      subject-specific fixed conductivity (sDS ).
                                                      Results: We demonstrated that variation in these scalp parameters may explain clinical data on subject-
                                                      specific static impedance and dynamic impedance, their imperfect correlation across subjects, their
                                                      relationships to seizure threshold, and the role of head anatomy. Adaptive tES models demonstrated that
                                                      current flow changes local tissue conductivity which in turn shapes current delivery to the brain in a
                                                      manner not accounted for in fixed tissue conductivity models.
                                                      Conclusions: Our predictions that variation in individual skin properties, rather than other aspects of
                                                      anatomy, largely govern the relationship between static impedance, dynamic impedance, and ECT cur-
                                                      rent delivery to the brain, themselves depend on assumptions about tissue properties. Broadly, our novel
                                                      modeling pipeline opens the door to explore how adaptive-scalp conductivity may impact trans-
                                                      cutaneous electrical stimulation (tES).
                                                        © 2021 The Authors. Published by Elsevier Inc. This is an open access article under the CC BY-NC-ND
                                                                                                   license (http://creativecommons.org/licenses/by-nc-nd/4.0/).

                                                                                         1. Introduction

                                                                                            Ongoing advancements in the efficacy or specificity (reduced
 * Corresponding author.                                                                 adverse effects) of electroconvulsive therapy (ECT) rely on refine-
    E-mail addresses: gunal000@citymail.cuny.edu (G. Unal), bikson@ccny.cuny.edu         ment in dose; namely electrode montage and stimulation
(M. Bikson).

https://doi.org/10.1016/j.brs.2021.07.012
1935-861X/© 2021 The Authors. Published by Elsevier Inc. This is an open access article under the CC BY-NC-ND license (http://creativecommons.org/licenses/by-nc-nd/4.0/).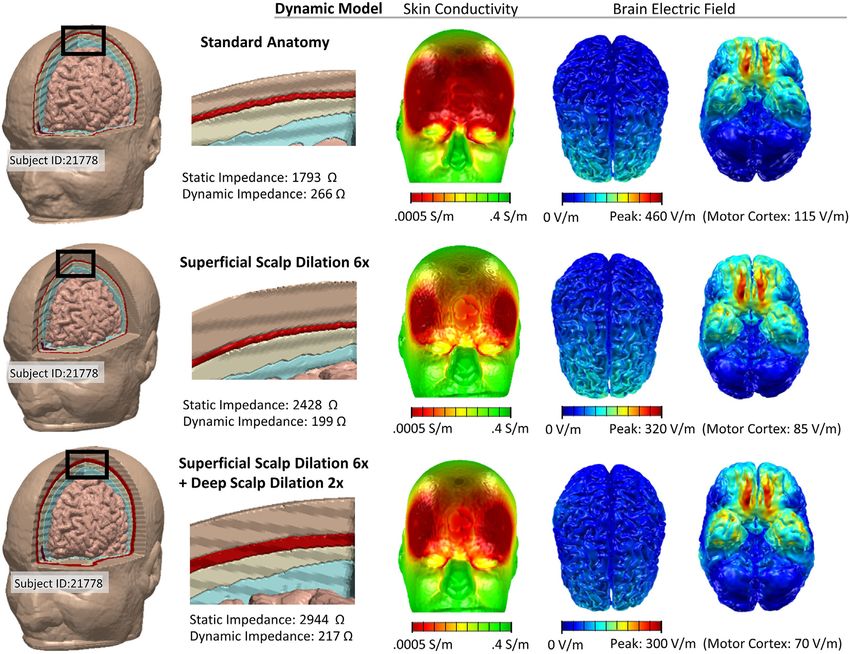
G. Unal, J.K. Swami, C. Canela et al.                                                                                    Brain Stimulation 14 (2021) 1154e1168

waveform, and intensity [1,2]. Dose optimization has followed                    University of New York. All comparisons were made using dispos-
heuristic approaches, and controversies remain unreconciled                      able, adherent pads as electrodes (Thymapads, Somatics, LLC,
despite decades of research [3,4]. Modern ECT devices deliver                    Venice, FI). The electrode preparation techniques included: 1) Skin
current-controlled (800e900 mA) pulses, so that applied voltage is               cleaning with saline and application of Pretac (Pharmaceutical In-
adjusted based on the encountered impedance. Devices report the                  novations, Newark, New Jersey); 2) Skin cleaning with alcohol
resulting “dynamic impedance” during the passage of the ECT                      (99 %) and application of Pretac; 3) Skin cleaning with saline and
stimulus. Prior to stimulation, ECT devices report a “static imped-              application of Pretac but with only 50 % electrode contact area
ance” using low intensity (~1 mA) high-frequency test currents.                  (achieved with using a plastic insulative sheet with a 2.5  2.5 cm
While static impedance and dynamic impedance has long been                       annulus); 4) Skin cleaning with alcohol only; 5) Skin cleaning with
recognized as markers of individual differences, their etiology and              saline and application of polyvinylpyrrolidone (PVPeK90, 1 % w/v)
consequences are undetermined [5] e including how they impact                    (Sigma-Aldrich Inch, St. Louis, Missouri); 6) Skin cleaning with
on seizure induction [6e9].                                                      saline and application of PVP-K90 plus potassium chloride (KCL,
    The finding that dynamic impedance is lower than static                       0.0003 %). Pretac or PVP-K90 was applied to the disposable elec-
impedance is consistent with an increase in tissue conductivity in               trode surfaces (300e500 mL) before placement on the skin. Elec-
response to high (dynamic impedance) verse low (static imped-                    trodes were positioned according to the standard bifrontal
ance) current intensity. But it is unclear which tissue layers are               placement [15], avoiding hairline, with careful attention to ensure
responsible for this impedance difference, how current flow to the                uniform electrode-skin contact. Static impedance was measured
brain is then altered, and with what implications to seizure                     using both a SpECTrum 5000Q (MECTA Corporation, Tualatin, OR)
genesis?                                                                         and Thymatron System IV (Somatics LLC) ECT device, immediately
    While significant covariation between static and dynamic                      after electrode application (t ¼ 0) and every minute for 17 min or
impedance has been reported [10], debate about whether there is a                until a stable impedance was recorded. Each subject and electrode
meaningful correlation has spanned decades [5,11,12]. One aim of                 preparation combination was tested 3 times, with tests separated
this study was to explain the imperfect relationship between static              by > 1 day.
and dynamic impedance. We use clinical trial datasets with stan-
dardized electrode preparation conditions to reexamine the re-
lations between static and dynamic impedance values under                        2.2. RUL and BL clinical ECT data set, New York state Psychiatric
fastidious conditions. In a sample of normal subjects, we system-                Institute
atically manipulated electrode preparation factors (contact area,
adherence) to determine the impact of preparation protocol on                        Anonymized data was re-analyzed from a New York State Psy-
static impedance across subjects. Novel current-flow models were                  chiatric Institute ECT trial [16] using right unilateral (RUL) and
developed and experientially constrained based on ECT subjects                   bilateral (BL) ECT. For this series, only stimulation at 800 mA was
anatomical imaging and impedance data, to systematically explain                 included in our analysis. Ninety patients in an episode of major
what factors drive versus limit the correlation between static and               depression were randomized into four groups in a 2  2 design,
dynamic impedance.                                                               varying both electrode placement and pulse duration (0.3 ms vs.
    For a given ECT electrical dose, the pattern of current delivery to          1.5 ms). Except for the pulse width manipulation, stimulation
the brain is determined by individual anatomy and electric con-                  waveform was identical in the ultra-brief and brief pulse groups.
ductivity of each tissue compartment (e.g. skin, skull) [10,13,14]. In           5 cm stainless steel circular disk electrodes were used with hand-
theory, changing tissue conductivity during the passage of the ECT               held electrode assemblies (MECTA Corporation). Seizure
stimulus would influence the distribution of current density in                   threshold was quantified at the first and last treatments using a
brain. Correlations between dynamic impedance and seizure                        titration procedure. At all other treatment sessions electrical
threshold have been shown [10] but not reliably [8,9]. A further aim             dosage was 2.5 or 6.0 times the seizure threshold quantified at the
of this study, using current-flow models, is to understand how                    first titration session for BL ECT and RUL ECT, respectively. While
changing tissue conductivity (alongside other anatomical factors)                precision of seizure threshold may be limited by resolution of
govern brain current flow during ECT and how this is reflected in                  titration steps and “floor effects,” [8] it is relatively established that
overall impedance.                                                               this approach shows increasing seizure threshold with decreasing
    We developed an individualized (MRI-derived) finite element                   dynamic impedance [8,9] for RUL and BL montages.
method (FEM) to model transcranial electrical stimulation while
incorporating “adaptive” changes in tissue conductivity by local
current flow. These models explain the source of individual differ-               2.3. BF clinical ECT data set, North Shore- Long Island Jewish Health
ence in ECT static and dynamic impedance, how they relate, and                   System
how they impact seizure threshold. More generally, these state-of-
the-art models demonstrate that adaptive change in tissue con-                       Anonymized data was analyzed from a North Shore- Long Island
ductivity shapes current delivery across the head, resulting in                  Jewish Health System ECT trial series [17] using bifrontal (BF) ECT.
different patterns than predicted by fixed-conductivity models.                   4.2  4.9 cm disposable adhesive electrodes were used (Thyma-
                                                                                 pads, Somatics LLC). Each subject received 6e10 ECT sessions with
2. Methods                                                                       electrodes configured in a bifrontal montage (with Pretac prepa-
                                                                                 ration). High resolution T1-weighted anatomical MRIs were dei-
2.1. Electrode preparation on static impedance: controlled                       dentified from a cohort of subjects (n ¼ 17) receiving ECT (see
experiments in healthy subjects                                                  modeling below). MR imaging exams were conducted at North
                                                                                 Shore University Hospital on a 3 T GE HDx scanner (General Elec-
    We conducted a study to evaluate the role of electrode prepa-                tric, Milwaukee, WI, USA). We acquired structural scans in the
ration on static impedance using healthy subjects (n ¼ 3) within                 coronal plane using a three-dimensional spoiled gradient sequence
whom six electrode preparation techniques could be compared.                     (TR ¼ 7.5 ms, TE ¼ 3 ms, matrix ¼ 256  256, FOV ¼ 240 mm),
The study was conducted in accordance to the protocols and pro-                  producing 216 contiguous images (slice thickness ¼ 1 mm) through
cedures approved by the Institutional Review Board of the City                   the whole head.
                                                                          1155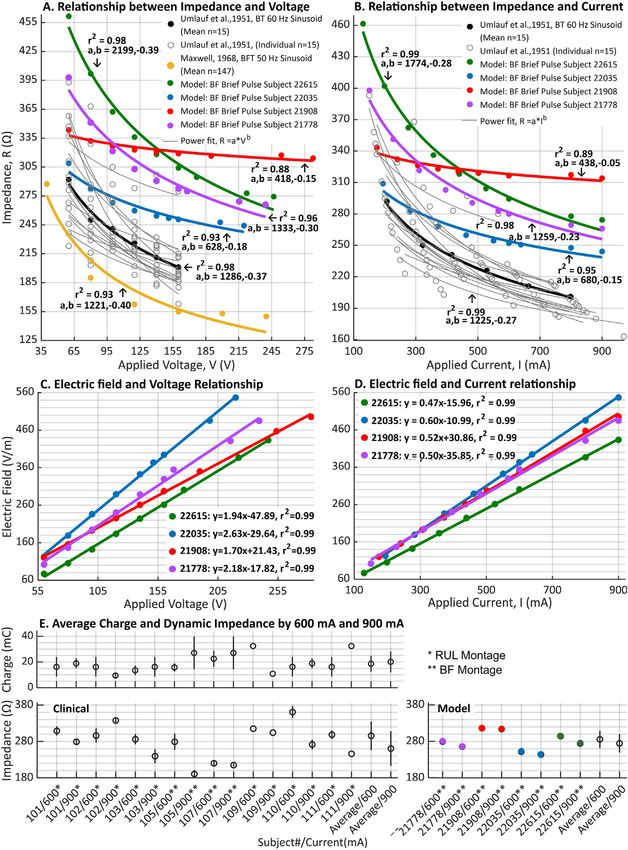
G. Unal, J.K. Swami, C. Canela et al.                                                                                 Brain Stimulation 14 (2021) 1154e1168

2.4. BF/RUL clinical ECT data set, Medical University of South                 based on algorithms in SPM8 [30] and updated for volume con-
Carolina                                                                       duction models [31] was used to create initial image masks of scalp,
                                                                               skull, air, meninges/cerebrospinal fluid, gray matter and white
   Anonymized data was analyzed from a Medical University of                   matter (Fig. 1 B). Additional manual segmentation was applied to
South Carolina ECT trial series using BF and RUL ECT with varying              correct for noise, aliasing artifacts, and to separate superficial scalp
pulse duration (0.3 ms vs 0.5 ms). The study was conducted in                  and deep scalp layers (approximately bisecting the scalp mask).
accordance to the protocols and procedures approved by the                        Unless otherwise indicated, these segmented tissues were
Institutional Review Board of the Medical University of South Car-             assigned subject-independent and fixed (not electric field depen-
olina. For this series, both 600 and 900 mA was applied to each                dent) electrical conductivity [23]: skull (s ¼ 0.01 S/m), gray matter
patients (n ¼ 10). 5 cm stainless steel circular disk electrodes were          (s ¼ 0.276 S/m), white matter (s ¼ 0.126 S/m), meninges/cere-
used with hand-held electrode assemblies (MECTA Corporation).                  brospinal fluid (s ¼ 0.85 S/m), and air (s ¼ 1*1015 S/m). Deep-
                                                                               scalp layer was assigned a subject-specific but fixed (not electric
                                                                               field dependent) conductivity (s DS) between 4.5*104 S/m and
2.5. General computational modeling approach
                                                                               0.008 S/m. Local superficial-scalp layer conductivity (sSS ) was a
                                                                               function of local scalp electric field (ESS Þ given by:
    Skin impedance decreases with increasing electrical current
density, to a skin-specific asymptote of ~0.1e0.5 S/m at ~500 mA/                       8
cm2 [18e20]. However, ECT average electrode current density                            >
                                                                                       >
                                                                                       >
                                                                                       >
(current divided by electrode area) is > 30 mA/cm2. Overall head                       >
                                                                                       <         A;      0 < ESS < B
impedance decreases with increasing ECT current density, to a                  sSS ¼     C*ESS  D;      B  ESS < ESS
                                                                                       >
                                                                                       >
subject-specific asymptote of ~200 Ohm at
                                                                                       >
                                                                                       :       sSS ;     ESS  ESS                                     (1)
[5,11]. At low current, minimum skin resistivity varies substantially
with tested-conditions and across microscopic layers, spanning                    Where sSS is subject-specific maximum superficial-scalp con-
~1*105 S/m for epidermal stratum corneum and ~2*104 to 0.2 S/                ductivity. We emphasize that ESS varies across the scalp surface
m for layers of dermis and fat [21,22]. This range can be contrasted           such that sSS then varies across the head (higher near electrodes).
with a skull conductivity of ~0.01 S/m.                                        Across subjects, four parameters (A, B, C, D) were fixed (Table 1). For
    It is intractable to model 7 kHz) current can be used during preparation to
estimate subject resistance during passage of the ECT stimulus
                                                                                   Ultimately, this is a novel heuristic approach that is computa-
dates to at least 1942 [28], and is reflected in contemporary use of
                                                                               tional tractable, supporting data interpretation and device design
high-frequency to test static impedance. Therefore, we do not
                                                                               (see Discussion). This approach borrows from lumped-parameter
model tissue permittivity. We represent the non-linear changes in
                                                                               skin impedance models that consider a current-sensitive superfi-
resistivity to current flow. The validity of the quasi-static approxi-
                                                                               cial layer and a current-insensitive deep layer with relatively low
mation was directly verified for the case of a point source electrode
                                                                               conductivity [18e20]. A previous model simulating ECT during
in an infinite, homogeneous, isotropic volume [29], without electric
                                                                               pregnancy [32] implemented a single skin layer with (un-satu-
field magnitude dependent tissue-properties. Consistent with our
                                                                               rated) conductivity changes restricted under the electrodes.
objective, their analysis affirmed that stimulation predictions are
                                                                                   We modeled two electrode configurations, with electrode shape
most sensitive to the representation of tissue conductivity.
                                                                               and position corresponding to the clinical series studied:

2.6. Subject head segmentation, subject-generic tissue                         1. Bifrontal (BF) pad electrode montage: The centers of both
parameterization, and electrodes                                                  electrodes are on a first imaginary line that originates at the
                                                                                  lateral canthus and projects up parallel to the facial midline. The
  Of the seventeen subjects in North Shore- Long Island Jewish                    long edge of the electrodes is aligned parallel to the first
Health System ECT series cohort, high resolution MRI-derived head                 imaginary line such that the short edge of the pad electrodes is
models were developed for four subjects (#21908, #22615, #22035,                  approximately parallel to the horizontal plane. The short edge of
#21778), selected based on a range and variance in static and dy-                 the pad electrodes is right above supraorbital ridge (approxi-
namic impedance values. An automated segmentation pipeline                        mately above the eyebrow). Depending on the subject, the

                                                                        1156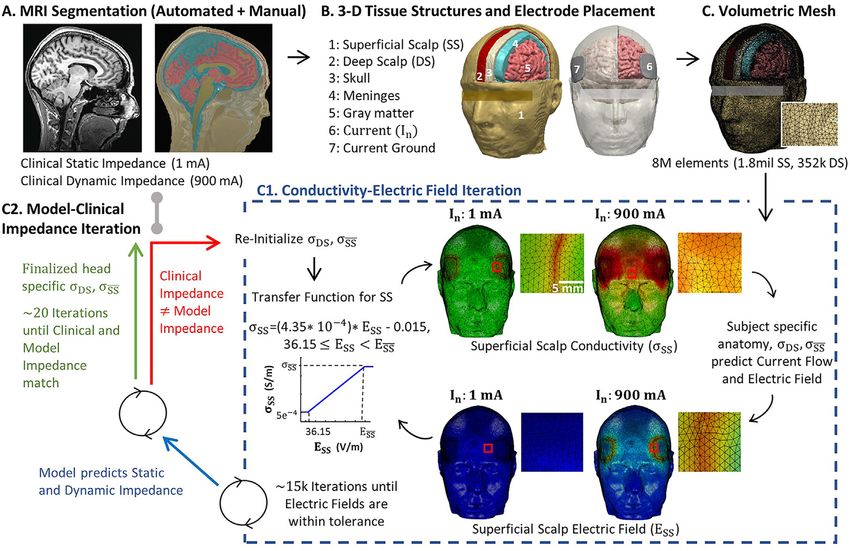
G. Unal, J.K. Swami, C. Canela et al.                                                                                                             Brain Stimulation 14 (2021) 1154e1168

Fig. 1. Novel adaptive computational pipeline for ECT current flow FEM models. We developed the first image-derived numerical models of transcranial electrical stimulation
(tES) incorporating local changes in tissue conductivity in response to local current flow (electric fields). (A) T1-weighted anatomical MRIs were collected from ECT patients, with
static impedance and dynamic impedance data. (B) Volume conductor models were created preserving image resolution using methods previously developed for low-intensity tES
[23,24,45] - however here we divide scalp into Superficial Scalp (SS) and Deep Scalp (DS) compartments. Skull, meninges, gray matter, and white matter compartments are assigned
standard fixed tissue conductivities. Clinical electrode montages are reproduced (e.g. BF) with boundary conditions corresponding to static impedance (In ¼ 1 mA) and dynamic
impedance (In ¼ 900 mA) testing. (C) For each subject and electrode montage, a volumetric mesh was generated from the segmented data. (D) The model was initialized with a deep
scalp conductivity (sDS ) and a maximum superficial scalp conductivity (sSS ). Independently for 1 mA and 900 mA current, an iterative model then computed current flow based on
tissue resistivities, updating superficial scalp conductivity (sSS ) in each element based on local electric fields using a transfer function, and then recalculated brain current flow (blue
dashed square). The model converges after ~15 k iterations, producing a model prediction of static impedance (for 1 mA) and dynamic impedance (for 900 mA). (E) Model predicted
static and dynamic impedance were compared with clinical static and dynamic impedance from the subject. If there was any significant mismatch, the model was reinitialized with
updated deep scalp conductivity (sDS ) and a maximum superficial scalp conductivity (sSS ), and the FEM was re-run until convergence (blue dashed square). When model static and
dynamic impedance matched clinical data, a patient specific deep scalp conductivity (sDS ) and a maximum superficial scalp conductivity (sSS ) was set.

   center of the electrodes ends up approximately 3e5 cm above                                   2.7. Computation and subject specific tissue parameterization
   the canthus of the eye.
2. Right Unilateral (RUL) disk electrode montage: The center of the                                  These modeled electrodes and gels were incorporated into the
   frontotemporal disk electrode is aligned with the midpoint of an                              segmentation. Volume meshes were generated from the
   imaginary line between the tragus and lateral canthus of the                                  segmented data and exported to COMSOL Multiphysics 5.5 (COM-
   eye. The bottom of the disk electrode is placed superior to the                               SOL Inc., MA, USA). The resulting mesh comprised >9,000,000
   imaginary line. The superior electrode disk is centered and to                                tetrahedral elements (>15,000,000 degrees of freedom).
   the right of the vertex, which is the intersection of imaginary                                   The Laplace equation V. (s V V) ¼ 0 (V: scalar electric potential;
   lines from nasion to inion, and the intertragal line.                                         V: gradient vector; s: conductivity) was solved and the boundary
                                                                                                 conditions were used such that current in static models (1 mA) and
   Stimulation electrodes and gels were modeled in SolidWorks                                    dynamic models (900 mA; unless otherwise stated) is applied to
(Dassault Systemes Corp., Waltham, MA). For the BF montage, we                                  one of the electrode terminals, while the other electrode is
represented ECT adhesive pad electrodes with dimensions of                                       grounded. Superficial-scalp conductivity was expressed as a func-
4.2  4.9 cm and thickness of ~1.7 mm, and gel conductivity of                                   tion of electric field (equation (1)). The finite element method
0.018 S/m (based on stand-alone measurements of Thymapad                                         (FEM) model was implemented using COMSOL. To converge the
electrodes). For RUL montage we represented circular metal elec-                                 solution (Fig. 1 C1), a linear system solver of conjugate gradients
trodes with a diameter of 5 cm and paste conductivity of 0.018 S/m.                              was used with a relative tolerance of 1*103 with a nonlinear sys-
                                                                                                 tem solver using the Newton-Raphson method (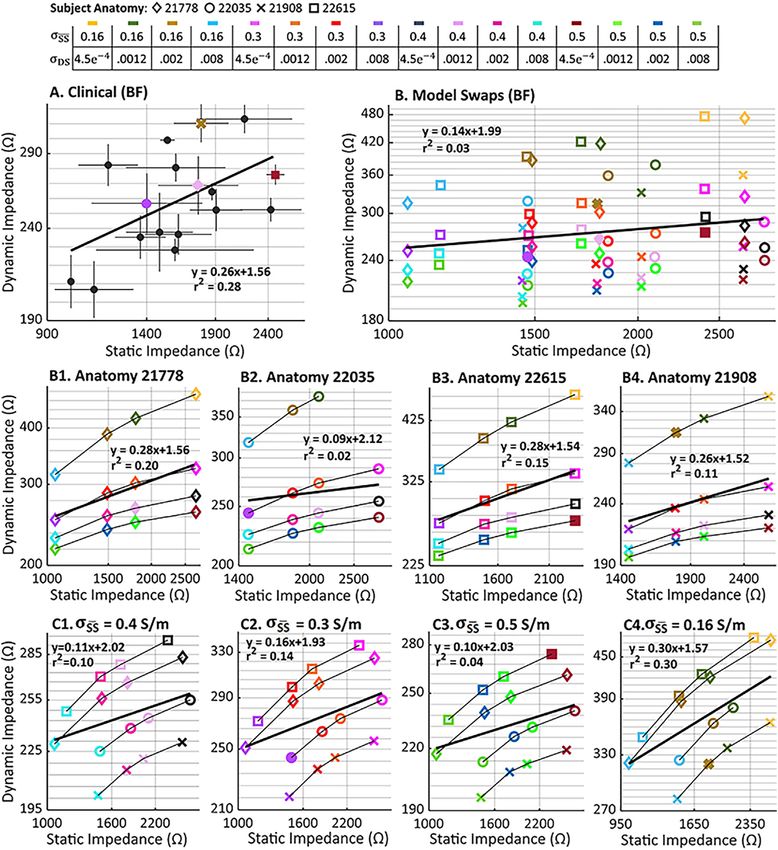
G. Unal, J.K. Swami, C. Canela et al.                                                                                   Brain Stimulation 14 (2021) 1154e1168

the purpose of our model the result is considered instant (or at least              ECT data varying montage electrode placement (RUL vs BL) and
much faster than ECT pulse duration and/or the process by which                 stimulus waveform (brief pulse vs ultra-brief pulse) were re-
device measures impedances). Time is not considered. All pre-                   analyzed from the New York State Psychiatric Institute trial [16] e
dictions of impedance and electric field (including in the brain)                importantly for our purposes, other stimulation parameters were
should be understood as steady state during current application.                reliably controlled and fixed (e.g. device, electrodes, operator
Effects on the brain are represented directly by electric field,                 experience, preparation technique). Across ECT conditions, dy-
following the quasi-uniform assumption [33,34] without consid-                  namic impedance reliably increased with static impedance (Fig. 2)
ering non-linear neurophysiological response such as those                      with significant interactions both across subjects within ECT con-
depending on an electric field threshold [14,35e37] or waveform                  dition and within subject across repeated sessions (not shown).
[38].                                                                           Across stimulation montages and waveforms, there was an evident
    For North Shore-Long Island Jewish Health System data including             relationship between static and dynamic impedances (RUL brief: F
modeled subjects (#21908, #22615, #22035, #21778), static im-                   (2,19) ¼ 9.99, p < 0.05, R2 ¼ 0.345; BL brief: F (2,38) ¼ 27.5, p < 0.05,
pedances were averaged across the first stimulation of each session,             R2 ¼ 0.42; RUL ultra-brief: F (2,21) ¼ 67.3, p < 0.05, R2 ¼ 0.762; BL
and dynamic impedances were averaged across the sessions where                  ultra-brief: F (2,22) ¼ 33.6, p < 0.05, R2 ¼ 0.604). All p-values sur-
the seizure was generated for every stimulation. An iterative                   vived the Bonferroni correction. After multiple comparison
approach (Fig. 1 C2) was used to search for each subject-specific                correction:     RUL     brief    CI:   0.0843e0.8516;        BL     brief
deep-scalp layer conductivity (sDS ) and maximum superficial-layer               CI:0.3459e0.8281; RUL ultra-brief CI: 0.6569e0.9566; BL ultra-
conductivity (sSS Þ such that model static impedance and dynamic                brief CI: 0.4572e0.9192. This analysis shows that when a consis-
impedance matched each subject's clinical values.                               tent ECT preparation procedures are followed, a correlation be-
                                                                                tween static impedance and dynamic impedance is evident; this is
                                                                                consistent with some aspect of individual anatomy increasing both
2.8. Statistical analysis
                                                                                static and dynamic impedance.
                                                                                    We further analyzed within-subject variance across ECT ses-
    Normality test of ECT trial data (static and dynamic impedance)
                                                                                sions in static and dynamic impedance (Fig. 2 error bars). Evalua-
from the New York State Psychiatric Institute, from the North Shore
                                                                                tion of the impact on static impedance and dynamic impedance by
- Long Island Jewish Health System, and from the Medical Univer-
                                                                                subject was modeled using a Kruskal-Wallis (static: H
sity of South Carolina was assessed using Lilliefors. Normality of
                                                                                (87) ¼ 579.47, p < 0.001; dynamic: H (87) ¼ 472.93,
static impedance over instruments, subjects, and time (electrode
                                                                                p < 0.001). In a linear regression with subjects as a categorical co-
preparation section) was evaluated with Kolmogorov-Smirnov test.
                                                                                variate there was significant within-subject correlation between
The impedance data that was further transformed in log base 10
                                                                                static and dynamic impedance (significant in 11 of 30 patients with
(log10) with linear regression indicating the relationships between
                                                                                >9 treatment sessions, p < 0.05; overall model significant,
static impedance and dynamic impedance within and across pa-
                                                                                p < 0.001); a post-hoc analysis of covariance was significant (F
tients (New York State Psychiatric Institute, North Shore - Long
                                                                                (28,352) ¼ 7.07, p < 0.001). Thus, for a given subject, presenting a
Island Jewish Health System), static impedance and seizure charge
                                                                                higher relative static impedance at a given session, a higher relative
threshold, and dynamic impedance and seizure charge threshold
                                                                                dynamic impedance is expected. This result can be explained either
(North Shore - Long Island Jewish Health System), the average
                                                                                by differences in tissue (scalp) properties across sessions, or by
charge and dynamic impedance (Medical University of South Car-
                                                                                differences in electrode preparation across sessions (see below).
olina). Bonferroni post-hoc analysis was performed to correct for
                                                                                Notwithstanding within subject variance, we confirm difference in
multiple comparisons. A Kruskal- Wallis ANOVA determined dif-
                                                                                both static and dynamic impedances across subjects are reliable
ferences in the static and dynamic impedances, across all subjects
                                                                                across sessions (static impedance [BL brief: H (23) ¼ 136.58,
and sessions based on differences in pulse width and montage
                                                                                p < 0.001; BL ultra-brief: H (39) ¼ 203.57, p < 0.001; RUL brief: H
(New York State Psychiatric Institute) and each instrument, subject
                                                                                (21) ¼ 141.49, p < 0.001; RUL ultra-brief: H (20) ¼ 125.59,
and time point (electrode preparation section) followed with a
                                                                                p < 0.001], dynamic impedance [BL brief: H (23) ¼ 91.7, p < 0.001;
post-hoc. Wilcoxon signed rank test was used to compare the dy-
                                                                                BL ultra-brief: H (39) ¼ 165.26, p < 0.001; RUL brief: H
namic impedances and charge of subjects at 600 and 900 mA
                                                                                (21) ¼ 141.49, p < 0.001; RUL ultra-brief: H (20) ¼ 125.59,
(Medical University of South Carolina).
                                                                                p < 0.001]). Barring systematic within-subject errors in electrode
                                                                                preparation (e.g., electrodes were always poorly misplaced on
3. Results                                                                      given subject), this result combined with analysis of averaged
                                                                                subjects’ data (Fig. 2), is consistent with individual differences
3.1. Relation between static impedance and dynamic impedance in                 (anatomy and/or tissue properties) impacting correlation between
single-center ECT trial                                                         static and dynamic impedances.

    While static impedance and dynamic impedance has long been                  3.2. Impact of electrode preparation technique on static impedance
recognized as measures of individual resistance to electroconvul-
sive therapy (ECT), their etiology, correlation, and consequences e                 In a sample of healthy subjects, we measured static impedance
including how they impact on seizure induction e remain a matter                across systematically varied adhesive electrode preparation tech-
of speculation. Practically, an atypically high static impedance may            niques (Fig. 3). Each condition was tested repeatedly across subjects
suggest an undesirably high dynamic impedance, and hence the                    (n ¼ 3) and the changes over time were monitored. Static imped-
need to correct electrode setup [39](see below). However, such                  ance differed among conditions for both instruments (Thymatron:
aberrant impedances may be distinct from less extreme and                       H (5) ¼ 59.82, p < 0.05; SpECTrum: H (5) ¼ 63.75, p < 0.05). Post hoc
naturally occurring variation in head impedance (e.g. under ideal               analysis corrected for Bonferroni revealed that static impedance
electrode site preparation). We conducted a retrospective analysis              increased in the absence of the adhesive (alcohol skin cleaning
of static impedance and dynamic impedance from 90 patients (with                only). All electrode preparation conditions using an adhesive so-
a total of 622 ECT stimulations) from a previously reported clinical            lution applied to the electrode surface (Pretac or PVP-K90) resulted
trial [16].                                                                     in a comparable and minimal static impedance for each given
                                                                         1158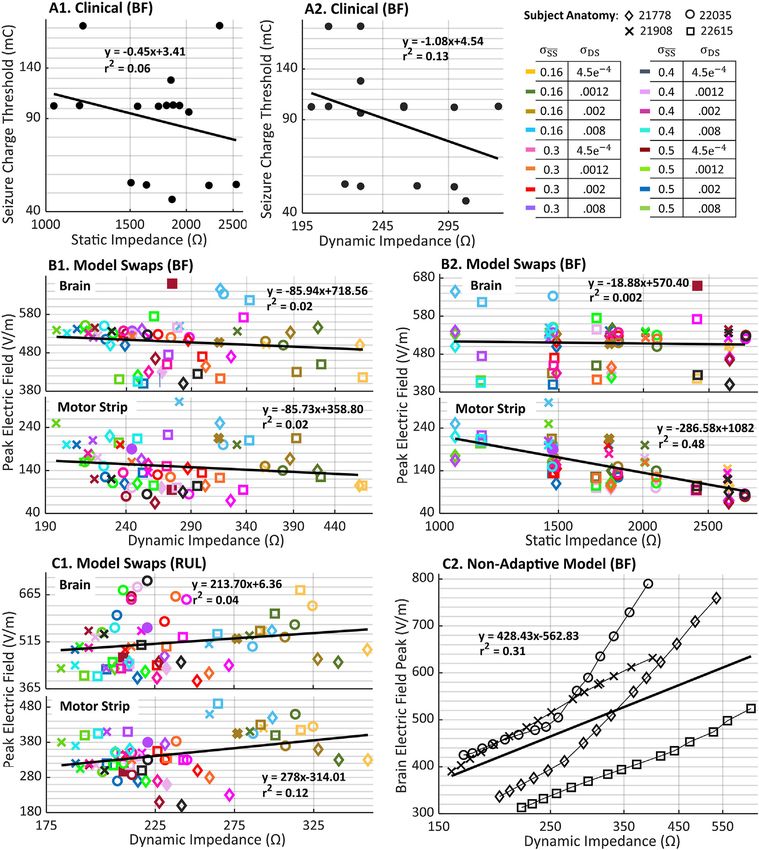
G. Unal, J.K. Swami, C. Canela et al. Brain Stimulation 14 (2021) 1154e1168
Fig. 2. Retrospective analysis of data from a single center ECT trial comparing RUL and BL electrode placements and brief and ultra-brief pulse stimulation. In a New York
State Psychiatric Institute patient sample receiving BF ECT, across (A) RUL Brief Pulse (black), (B) BL Brief Pulse (yellow), (C) RUL Ultrabrief Pulse (red), and BL Ultrabrief pulse (green)
there was a significant correlation between patient static impedance and dynamic impedance. The average impedance across sessions is represented for each subject as well as the
full range of variance (error bars).
subject. Reduction in electrode contact area by 50 % increased static 3.3. Development of individualized adaptive tissue models of ECT
impedance a factor of ~1.5e2.7 (Fig. 3).
Static impedance measures by the SpECTrum were greater than Previously MRI-derived head models to predict subject-specific
Thymatron at each time point (time ¼ 0: H (1) ¼ 13.0124, p < 0.001; brain current flow were developed [24,40] and validated [41,42] for
mean difference, 12.67 þ- 6.88, p < 0.001; time ¼ stable: H low-intensity tES, such as tDCS, and then subsequently applied to
(1) ¼ 17.7067, p < 0.001; mean difference, 14.78 þ- 6.88, p < 0.001) ECT [14,43]. These models assumed non-adaptive tissue resistivity.
reflecting how each device uniquely probes and calculates static Here we developed a novel ECT modeling pipeline (Fig. 1) with
impedance. Static impedance measures decreased significantly over adaptive tissue conductivity, such that local scalp conductivity
time for all subjects, conditions, and instruments (H (1) ¼ 5.38, changes with electric field strength (Fig. 4). The analysis was con-
p < 0.05). Additionally, difference was observed across all subject ducted on data from four ECT patients from the North Shore-Long
pairings for each device, besides the pairing of Subject 1 and Subject Island Jewish Health System. Each patient's anatomical MRI was
3 on the SpECTrum (Thymatron: s1, s2: H (1) ¼ 61.0792, p < 0.001; s1, segmented and an iterative search process identified the maximum
s3: H (1) ¼ 30.3514, p < 0.001; s2, s3: H (1) ¼ 17.4964, p < 0.001; superficial scalp conductivity (sSS ) and the deep scalp conductivity
SpECTrum: s1, s2: H (1) ¼ 31.6038, p < 0.001; s1, s3: H (1) ¼ 3.4103, (sDS ) that produced a prediction of static and dynamic impedance
p ¼ 0.065; s2, s3: H (1) ¼ 21.728, p < 0.001), consistent with subject values corresponding to the patient's clinical data. The resulting
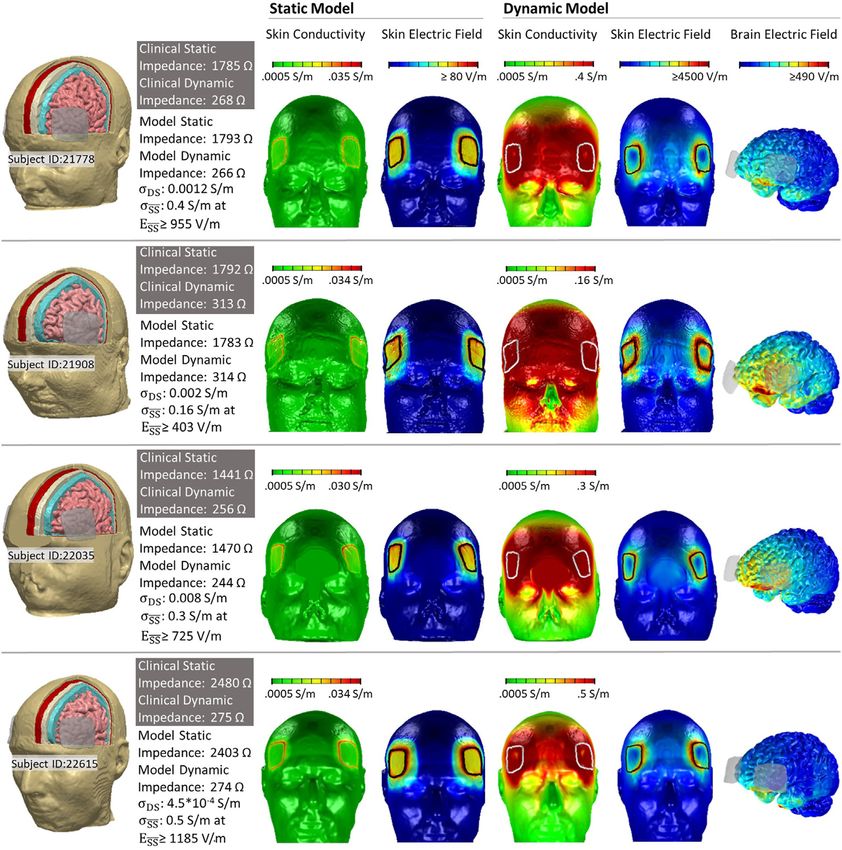
anatomy/tissue properties impacting static impedance. subject specific parameters were: Subject 21908, sSS ¼ 0.16 S/m at
Even under our tightly controlled experimental conditions and ESS 403 V/m, sDS ¼ 0.002 S/m; Subject 22615, sSS ¼ 0.5 S/m at ESS
with optimal preparation (use of adhesive), moderate variability 1185 V/m, sDS ¼ 4.5*104 S/m; Subject 22035, sSS ¼ 0.3 S/m at
was observed between repetition trials. Under realistic clinical
ESS 725 V/m, sDS ¼ 0.008 S/m; Subject 21778, sSS ¼ 0.4 S/m at ESS
conditions, variability both in the quantity (area coverage) and
955 V/m, sDS ¼ 0.0012 S/m.
quality (e.g. extent of adhesion) of electrodes could produce sub-
Stimulation with 1 mA (Fig. 4, static model) produced peak scalp
stantial impedance variance. Nevertheless, this supports our
electric fields under and around electrode edges (>80 V/m) with
modeling analysis where difference between individuals is not
moderate increases in conductivity (~0.03 S/m) around the elec-
dominated by idiosyncrasy in the quality of electrode-skin contact
trode perimeters. Stimulation with 900 mA (Fig. 4, dynamic model)
(i.e. as models assume complete electrode-skin contact) but rather
produced high electric fields across the scalp forehead with peaks
reflects subject's head properties.
1159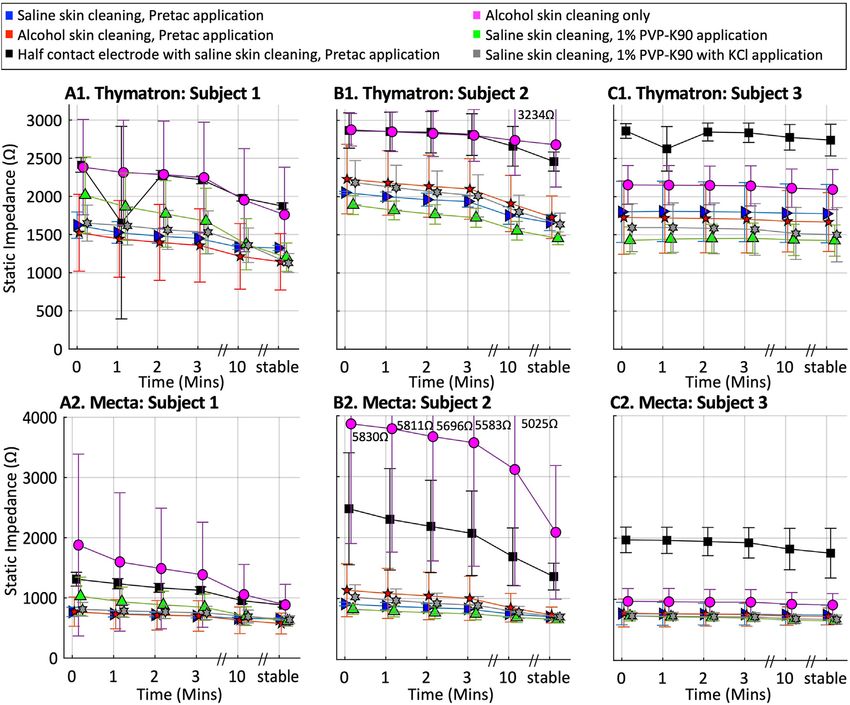
G. Unal, J.K. Swami, C. Canela et al.                                                                                                      Brain Stimulation 14 (2021) 1154e1168

Fig. 3. Static impedance over time under six electrode preparations. Repeatedly across three subjects (mean ± S.D.) and both the Thymatron (A1, B1, C1) and SpECTrum (A2, B2,
C2) devices, static impedance was measured under varied electrode preparation techniques. Prior to electrode placement the skin was gently cleaned with either isotonic saline or
alcohol (99 %) and allowed to dry. Thymapads electrodes were lightly coated with Pretac, polyvinylpyrrolidone (PVP) with or without KCl, or not at all, before being placed on the
skin. Static impedance was measured immediately after electrode application (t ¼ 0) and at every minute until a stabilized.

around electrodes (>4500 V/m), and an associated increase in scalp                           resulting in 60 synthesized heads (plus the 4 originals). Under an
conductivity (0.15e0.5 S/m). The resulting brain current flow dur-                            assumption that a theoretical subjects head anatomy, deep-layer
ing ECT also predicted peak electric fields >490 V/m.                                         scalp conductivity (sDS ) and maximum superficial-layer scalp
                                                                                             conductivity (sSS ) can vary independently, each synthesized head
3.4. Adaptive scalp response and the relation between static and                             represented a novel hypothetical subject. This approach allows
dynamic impedance                                                                            systematic comparison of the relative impact of anatomy and scalp
                                                                                             properties to ECT outcomes as predicted by the synthetic models.
    The role of head anatomy in ECT outcomes remains unclear, and                                The relationship between static impedance and dynamic
is complex to understand experimentally when gross anatomy,                                  impedance is evident though imperfect (Clinical BF: F (2,15) ¼ 5.84,
tissue properties, and neurophysiology all vary across individuals.                          p < 0.05, R2 ¼ 0.28) in the North Shore-Long Island Jewish Health
The role of gross anatomy can be considered using computational                              System clinical BF ECT series (Fig. 5 A). The predicted relationship
models by 1) fixing head anatomy and manipulating tissue (scalp)                              between static impedance and dynamic impedance across all the
properties; or 2) artificially changing (e.g. dilating) a single                              synthetic heads was complex (Fig. 5 B) though interactions are
anatomical layer (scalp). These approaches are used first to explain                          evident when considering individual head anatomy (Fig. 5 B1, B2,
the relation between dynamic and static impedance, and then how                              B3, B4) or a given sSS (Fig. 5 C1, C2, C3, C4).
they impact delivery of current to the brain.                                                    Thus, simulations with swapped-scalps predict that variation in
    For each head we fitted deep-layer scalp conductivity (sDS ) and                          scalp properties are relatively more important than gross anatomy
maximum superficial-layer scalp conductivity (sSS ). Subsequently,                            in determining static impedance and dynamic impedance. Specif-
it is possible to examine the role of scalp properties by simulating                         ically, extreme variations in static impedance and dynamic
the “swapping” of the scalp properties across different heads                                impedance are governed by sSS and sDS respectively. Therefore,
(Fig. 5). Starting from a base set of four head anatomies (Subject                           because sSS and sDS vary independently a dispersion of static and
22615, square; Subject 21778, diamond; Subject 22035, circle;                                dynamic conductivities is produced. A weak interaction persists
Subject 21908, x with corresponding sDS and sSS for each subject),                           because sDS has (in addition to a strong effect on static impedance)
we then swapped (mixed) scalp properties across heads (colors),                              a weak effect on dynamic impedance (Fig. 5 B1, B2, B3, B4 lines

                                                                                      1160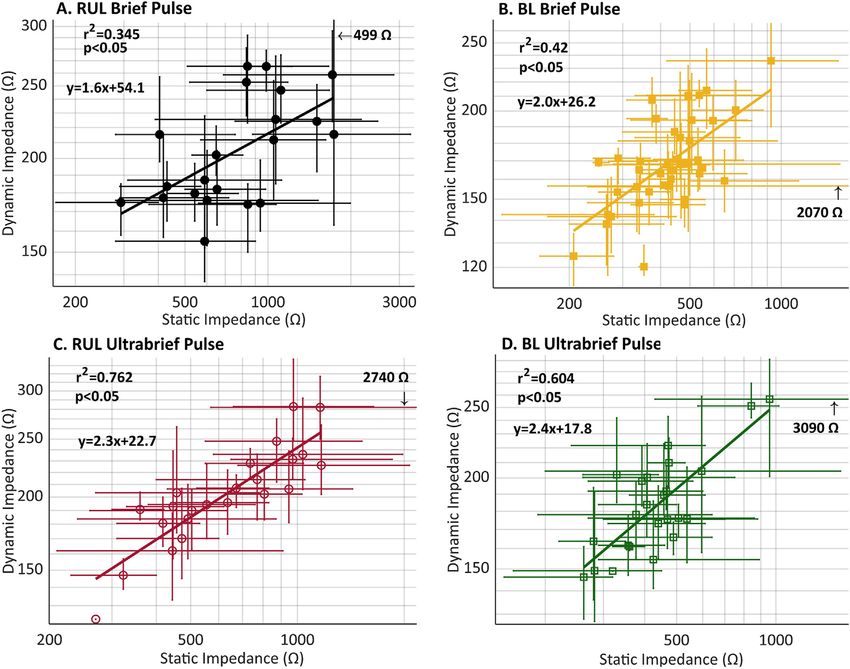
G. Unal, J.K. Swami, C. Canela et al.                                                                                                        Brain Stimulation 14 (2021) 1154e1168

Fig. 4. Dynamic ECT models for four ECT subjects. Dynamic FEM models simulated current flow across four subjects who have received ECT (Subject IDs: 21778, 21908, 22035,
22615). (First Column) Models anatomy was based in subject anatomical MRI. Static impedance and dynamic impedance values were recorded for each subject (gray box). Each
subject model was assigned a specific deep scalp conductivity (sDS ) and a maximum superficial scalp conductivity (sSS ) as indicated, such that adaptive FEM simulation predicted
corresponding static impedance (based on 1 mA applied current) and dynamic impedance (based on 900 mA applied current) as indicated. (Second and Third Column) Results from
the static impedance (1 mA current) simulation showing resulting superficial scalp conductivity and scalp electric field. (Third, Fourth, Fifth Column) Results from the dynamic
impedance (900 mA current) simulation showing resulting superficial scalp conductivity, scalp electric field, and brain electric field. We emphasize in these novel adaptive sim-
ulations that brain current flow was determined by tissue conductivity, superficial scalp conductivity was simultaneously determined by local electric field. Even for the 1 mA
(static) model local changes in scalp conductivity are predicted. For the 900 mA (dynamic) model, the saturation of the transfer function between superficial scalp electric field and
conductivity results in a more diffuse saturation of scalp conductivity (front of head) compared to scalp electric field (around electrodes).

represent fixed head and sSS , so only sDS varying). Head anatomy                              increase the contribution to dynamic impedance of high
moderate both static and dynamic impedance (see also below). The                              superficial-layer scalp conductivity (sSS ) compared to deep-layer
importance of deep-layer scalp (sDS ) conductance, with head                                  scalp conductivity (sDS ). Meaning, it is the same adaptive dy-
anatomy as a moderator, on static impedance is evident when                                   namic scalp conductivity properties that result in reduced dynamic
noting that for a given head and sDS ; static impedance is nearly                             impedance compared to static impedance, that introduce vari-
fixed, despite variation in dynamic impedance. This vertical                                   ability in the scale of reduction and so therefore, correlation be-
dispersion is also why a relationship between static and dynamic                              tween static and dynamic impedance.
impedance is not evident across swapped-scalp models (e.g. for                                    Across (almost all) variations in tissue properties, the relative
static impedance >2600 ohm a wide range of dynamic impedance                                  (rank) order of dynamic impedance was fixed (from higher to
is possible). For a given superficial-layer scalp conductivity (sSS ), as                      lowest: Subject 22615, square; Subject 21778, diamond; Subject
anatomy and deep-layer scalp conductivity (sDS ) varied, correlation                          22035, circle; Subject 21908, cross). Across variation in adaptive-
between static impedance and dynamic impedance increased with                                 tissue properties, the rank order of static impedance was not
decreasing sSS (Fig. 5 C1, C2, C3, C4).                                                       consistent across heads, though some trends were evident. Subject
    Thus, we predict the degree of correlation between static                                 22035 presented the lowest relative static impedance. Subject
impedance and dynamic impedance expected in any data set would                                22615 presented the highest relative static impedance. In any case,
be limited by conditions (montage, waveform) or individuals which                             neither rank order for static impedance or dynamic impedance
                                                                                              corresponded to the rank order of any global anatomical feature

                                                                                       1161
G. Unal, J.K. Swami, C. Canela et al.                                                                                                         Brain Stimulation 14 (2021) 1154e1168

Fig. 5. Relation between Dynamic Impedance and Static Impedance in clinical data and adaptive models including scalp swaps. (A) Dynamic impedance and static impedance
were modestly correlated in North Shore-Long Island Jewish Health System patient sample receiving BF ECT (mean ± S.D.). Four subjects (colored symbols) were selected for
adaptive FEM simulation. (B) In these four subjects, static and dynamic impedance values were simulated by assigning subject specific deep scalp conductivity (sDS ) and a
maximum superficial scalp conductivity (sSS ). The conductivities (in S/m) are called “endogenous” for our purposes here (Subject 22035 sDS ¼ 0.008, sSS ¼ 0.3; Subject 21778
sDS ¼ 0.0012, sSS ¼ 0.4; Subject 21908 sDS ¼ 0.002, sSS ¼ 0.16; Subject 22615 sDS ¼ 4.5*10-4, sSS ¼ 0.5). In scalp swaps, all deep scalp conductivity (sDS ) and a maximum superficial
scalp conductivity (sSS ) were varied across all subject anatomies, resulting in 64 simulates swapped-conductivity heads (including the endogenous 4 heads). For each head, static
impedance and dynamic impedance was predicted using our adaptive pipeline. There was only a weak correlation between simulated static and dynamic impedances. (B1, B2, B3,
B4) Replotting the same model swap results but categorized by subject anatomy. Note, for a given head anatomy and a given deep scalp conductivity (sDS ), varying superficial scalp
conductivity (sSS ) changes dynamic impedance but not static impedance. This vertical distribution of dynamic impedances for a given static impedance reduces overall correlation,
even within a single anatomy. For a given head anatomy and superficial scalp conductivity (sSS ), decreasing superficial scalp conductivity (sSS ) monotonically increases both static
impedance and dynamic impedances, explaining the source of overall correlation. (C1, C2, C3, C4) Replotting the same model swap result but categorized by a given sSS for all
subjects. Note, correlation between static and dynamic impedances increases with the decrease in superficial scalp conductivity (sSS ), consistent with changes in superficial scalp
conductivity reducing overall correlation.

(head circumference, skull thickness, inter-electrode distance). This                          framework to explain clinical observations and reconcile incon-
suggested that it is not possible to predict (relative) static or dy-                          gruent findings (see Discussion).
namic impedance based on any simple anatomical measure
(consistent with clinical observations [5]).
   The salient result here is not that our adaptive modeling                                   3.5. Adaptive scalp response and the relation between brain current
approach can match the clinical impedance data, since adjusting                                intensity and static or dynamic impedance
subject sSS and sDS (Fig. 5) could ensure model approximation of
subject-specific clinical data. Rather, these models provide a                                      In the North Shore- Long Island Jewish Health System BF ECT
                                                                                               clinical series, there was no evident relation between static
                                                                                        1162
G. Unal, J.K. Swami, C. Canela et al. Brain Stimulation 14 (2021) 1154e1168
Fig. 6. Relation between brain electric field (or seizure threshold) in clinical data and adaptive scalp models including scalp swaps. In theory, conditions that result is higher
electric fields (at the region of seizure initiation) will be associated with reduced charge required to trigger a seizure, i.e. lower seizure threshold. (A) In a North Shore-Long Island
Jewish Health System patient sample receiving BF ECT, the relation between increasing static impedance (A1) or increasing dynamic impedance (A2) and decreasing charge
threshold for seizure initiation. (B) The predicted relation between brain electric field and dynamic impedance (B1) or static impedance (B2) can be simulated for the BF electrode
montage using adaptive FEM models of the 64 swapped-conductivity heads (including the endogenous 4 heads). Brain wide peak electric field is considered (higher panel) as well
as motor strip peak electric field (lower panel). Note: In both cases (B1, B2), the electric field represented is for the applied 900 mA case. Only weak correlations are predicted, with
the strongest correlation (negative direction) for the case of static impedance and motor strip peak electric fields. (C1) Using adaptive FEM modeling, the relation between dynamic
impedance and static impedance was further predicted in same heads for the RUL electrode montage. Weak correlation was predicted, with the strongest relationship (positive
direction) for dynamic impedance and motor strip peak electric field. (C2) Conventional (non-adaptive tissue) FEM of the four anatomical head, where for each uniform scalp
conductivity was varied to adjust dynamic impedance, predicted quasi-linear relationship for each head between dynamic impedance and brain electric field. Variability between
heads resulted in a weaker group correlation between dynamic impedance and brain electric field. We note the prediction in non-adaptive conventional stimulation of increasing
electric field with increased dynamic impedance is expected. While the predictions from adaptive FEM suggest a more complex and nuanced relationship between dynamic
impedance and electric field (and so charge needed to produce seizures).
impedance and seizure charge threshold (Fig. 6 A1) or dynamic in the motor strip. There was no evident correlation between static
impedance and seizure charge threshold (Fig. 6 A2). Both com- (Fig. 6 B1) or dynamic (Fig. 6 B2) impedance, and brain-wide peak
parisons were not statistically significant at p < 0.05 (A1. Clinical BF: electric field or motor strip electric field. The exception between a
F (2,14) ¼ 0.84, p ¼ 0.375, R2 ¼ 0.0566; A2. Clinical BF: F negative relation between static impedance and motor strip peak
(2,14) ¼ 2.07, p ¼ 0.172, R2 ¼ 0.129). Across the swapped BF head electric field.
model stimulations (4 originals plus 60 synthesized scalp heads), While these adaptive models were parametrized based on BF
we predicted peak electric fields, both brain-wide and specifically ECT data, we used the same swapped heads to predict the relation
1163G. Unal, J.K. Swami, C. Canela et al. Brain Stimulation 14 (2021) 1154e1168
between static impedance or dynamic impedance and brain cur- 3.6. Response to moderated ECT voltage and current: Model
rent delivery for RUL ECT (Fig. 6 C1). Relationships were weak, and validation against classical clinical data
trended positive. We further considered non-adaptive models in
order to highlight the unique behavior of adaptive models (Fig. 6 While modern ECT uses currents of 800e900 mA, in two earlier
C2). In non-adaptive models, for each subject head, the (uniform) trials the current and/or voltage of ECT was systematically varied
scalp conductivity was incrementally decreased, producing a range within subjects, which can also be modeled with adaptive-
of impedance (note, in these non-adaptive models we distinguish conductivity simulations (Fig. 8 A and Fig. 8 B). Dynamic imped-
static impedance or dynamic impedance). As expected, in non- ance as a function of voltage from Umlauf et al., 1951 and Maxwell
adaptive models, brain electric field increased monotonically for et al., 1968, and dynamic impedance as a function of current for
each subject with increased impedance. This slope varies across Umlauf et al., 1951 were replotted for each individual subject (gray
heads but remains significant across the group. lines) and group average (yellow Maxwell et al., 1968; black Umlauf
MRI-derived head models can be artificially altered [44] et al., 1951). Group data are fit by a power law:
including dilation of specific tissue layers [25,45]. Keeping tissue
conductivity properties fixed (as optimized for each subject), we R ¼ a Vb (2)
first dilated only superficial scalp layer by ~6x (Fig. 7, middle row).
Superficial-scalp dilation increased static impedance, decreased
dynamic impedance, and decreased brain current delivery in all R ¼ a Ib (3)
four heads. Further dilation of deep scalp layer by ~2x (Fig. 7, bot-
tom row) increased static impedance in three of the four heads, where R is Dynamic Impedance (in Ohms), V is voltage applied (in
increased dynamic impedance in all four heads, and decreased Volts), I is current applied (in mA) and a and b are constants.
current delivery in three of the four heads in comparison with the Alongside these clinical data, results from reducing the applied
results from superficial-scalp dilation. Notably, these simulations voltage and current in our adaptive-conductivity models heads is
show a dissociation among static impedance, dynamic impedance, shown and fit to power law. The models broadly reproduce the
and electric field in the sense that specific changes can affect them power law relationship for decreased ECT intensities
relatively differently (Table 2). This also reinforces the unique (100e900 mA). Noting these models were parameterized based
outcomes, and so value, of adaptive-resistivity models. only on static (1 mA) and dynamic (900 mA) clinical data. Absolute
matching of parameters (a, b) is not expected given the difference
Fig. 7. Tissue Dilation in Adaptive FEM model of ECT, and relationship between static impedance, dynamic impedance, and brain electric field. Our adaptive FEM models
suggest a complex relationship among head anatomy, tissue properties, and resulting current flow and resistance. In addition to allowing variance of just select tissue conductivity,
computational models can access the role of isolated anatomy, including through superficial tissue dilation [25]. We considered standard (original) anatomy (top row), dilating
superficial scalp 6-fold (middle row), and further dilating deep scalp 2-fold (bottom row). In the last case, dilated deep scalp replaces overlying superficial scalp. Compared to the
standard anatomy, dilating superficial scalp 6-fold increased static impedance, decreased dynamic impedance, and decreased brain electric field. Further dilating deep scalp 2-fold,
increase static impedance, increase dynamic impedance, and decreased further brain electric field. These adaptive FEM simulations show a subtle non-monotonic relationship
between static impedance, dynamic impedance, and brain electric fields.
1164G. Unal, J.K. Swami, C. Canela et al. Brain Stimulation 14 (2021) 1154e1168
Table 2
Tissue dilation in adaptive FEM stimulation of four ECT subjects. Static/dynamic impedance along with brain/motor electric field from adaptive computational simulations
for each endogenous head before and after tissue dilations. These values are indicated for each head's standard (original) anatomy (third column), dilation of superficial scalp 6-
fold (fourth column), and further dilation deep scalp 2-fold (last column). Electric field values are for 900 mA and reported as overall peaks in the brain as well as the motor
cortex as a region of interest.
Subject ID Standard Anatomy Superficial Scalp Dilation 6x Superficial Scalp Dilation 6x + Deep Scalp 2x
Static/Dynamic Impedance #22615 2403/274 ( U) 2931/206 ( U) 3820/219 (U)
#21778 1793/266 ( U) 2428/199 ( U) 2944/217 (U)
#21908 1783/314 ( U) 2453/262 ( U) 2742/295 (U)
#22035 1440/244 ( U) 2151/199 ( U) 2083/216 (U)
Brain/Motor Electric Field for Dynamic Models #22615 660/95 (V/m) 411/68 (V/m) 463/64 (V/m)
#21778 460/115 (V/m) 320/85 (V/m) 300/70 (V/m)
#21908 507/215 (V/m) 438/150 (V/m) 413/120 (V/m)
#22035 470/160 (V/m) 400/140 (V/m) 380/115 (V/m)
in protocols. Umlauf et al., 1951 and Maxwell et al., 1968 used si- dynamic impedance in ECT stems largely from limitations built into
nusoidal stimulation while our models were parameterized based ECT devices (e.g. voltage compliance) and clinical standards (e.g.
on rectangular pulse trains; It is known that impedance will vary preparation quality control) [10] and thus consider only impedance
with pulse/sinusoidal waveforms [46]. extremes. Nonetheless, there has been discussion spanning de-
For non-adaptive models with fixed scalp conductivity, there is a cades on whether less extreme variation in impedance parameters
(trivial) linear relationship between applied current and brain (deriving from endogenous difference in anatomy) can be better
electric field [47]. Because scalp impedance may impact delivery of leveraged to understand and optimize ECT dosing and behavioral
electric field to the brain, we speculated adaptive-models changing outcomes. Our adaptive-conductivity ECT models make a range of
impedance with current intensity would result in a non-linear predictions on these matters.
relation between ECT pulse intensity and brain electric field. Supporting our analysis, we consider data from ECT treatments
However, we did not observe a significant deviation from basic using a range of devices, electrode placement, and waveforms/
linearity (Fig. 8 C and 8 D). pulse widths (Fig. 2, Fig. 5, Fig. 6, Fig. 8) showing a definitive but
Contemporary data from the Medical University of South Car- imperfect relationship between static and dynamic impedance -
olina BF/RUL clinical ECT series were analyzed (Fig. 8 E). Subjects consistent with endogenous differences between subjects increase
received either BF or RUL ECT with circular disk electrodes on static and dynamic impedance together. We also show static
MECTA device using 600 mA and 900 mA. For 900 mA ECT, but not impedance is impacted by electrode preparation technique
600 mA ECT, subject treatment charge was significantly correlated (including both electrode-skin contact area and adhesion quality),
with dynamic impedance: F (2,6) ¼ 10.1, p < 0.05, R2 ¼ 0.628. There but endogenous individual difference remains (Fig. 3).
was no significant difference in charge between 600 mA and Adaptive ECT models predict that individual difference in static
900 mA ECT (Wilcoxon signed rank test, Z ¼ 0.70, p ¼ 0.54). There and dynamic impedance largely reflect difference in individual
was a significant decrease in dynamic impedance from 600 mA to scalp properties, with head anatomy playing a moderating role. A
900 mA ECT (Wilcoxon signed rank test, Z ¼ 1.96, p ¼ 0.02), which component of individual scalp conductivity that is insensitive to
was reproduced in the adaptive models (Fig. 8 E). current passage (sDS ) governs static impedance (to low currents).
Though limited scalp conductivity changes are predicted even at
low current (Fig. 4), they do not meaningfully impact static
4. Discussion impedance (Fig. 5). Dynamic impedance (to high current) is largely
governed by the individual's maximum adaptive scalp conductivity
Current passage through the scalp (skin) depends on numerous (sSS ) in response to current passage, with a smaller influence of the
layers and ultra-structures, each with a complex (non-linear, time- current-insensitive scalp impedance (sDS ). The dual impact of in-
dependent) impedance to current flow [18,48e52] e which is dividual sDS may explain an intrinsic but imperfect relationship
computationally intractable for tES head models [23]. The pipeline between static impedance and dynamic impedance. Contrariwise,
developed here to simulate adaptive-scalp conductivity during tES the insensitivity of static impedance to the scalp adaption to cur-
represent two scalp layers, with just two respective associated rent flow (sSS ) explains the weakness of any relationship between
subject-specific parameters: a deep-scalp layer with fixed con- static and dynamic impedance. Namely, variations in just sSS result
ductivity (sDS ) and a superficial-scalp layer where electric fields
in the same static impedance being associated with a wide range of
increase conductivity up to a maximum (sSS ). Ongoing modifica-
possible dynamic impedance. If a given clinical trial reports a cor-
tions and refinements of our pipeline are welcome (see below) but relation between static and dynamic impedance (Fig. 1) or not [5]
we suggest the relevance of adaptive-scalp conductivity should be can reflect difference in electrode/skin preparation or stimulation
considered in efforts to inform tES/ECT with computational models. current. Protocol (e.g. montage, waveform) and subject (e.g. age,
The physical properties of the ECT stimulus markedly effect both sex) differences in impedance would also depend on these scalp
efficacy and cognitive side effects. It is the combination of ECT dose properties [9,53].
(electrode montage, waveform, and stimulus intensity) and head While static and dynamic impedance are ubiquitously available
resistive features, that determine how much and where current is ECT measures supporting model validation (Fig. 8), tES current flow
delivered to the brain. That head resistivity varies across subjects models have translational value only in informing treatment pro-
has been known for decades based on clinical measurement of tocols [1,32,35,43,54,55]. These efforts consider the electric fields
static impedance and dynamic impedance. But it has been hard to generated across the brain relevant for both seizure threshold and
explain if and how these head resistances impact on stimulation side-effects. While non-adaptive models predict a direct relation
during ECT (brain current delivery) because their etiology is un- between impedance and brain electric field intensity (Fig. 6 C2),
clear. The ongoing universal reliance on static impedance and
1165G. Unal, J.K. Swami, C. Canela et al. Brain Stimulation 14 (2021) 1154e1168
Fig. 8. Relationships between varied applied voltage or current in ECT and measured dynamic Impedance: clinical and modeling results. While in conventional ECT the
current level if fixed, in historical experiments the current and/or the voltage was reduced while monitoring dynamic impedance. In Umlauf et al. (1951), ECT dosage (using 60 Hz
sinusoidal waveforms, BT electrode montage) was varied, with resulting impedance reported as a function of both applied voltage (A) and applied current (B) [5]. Individual subject
data (gray) is reported, alongside group average (black). In Maxwell et al. (1968), the voltage of ECT (using 50 Hz sinusoidal waveform, BFT electrode montage) was reported against
dynamic impedance (group average only, yellow) [11]. Using adaptive FEM, for each head (Subject IDs: 21778, 21908, 22035, 22615), we systematically varied the current intensity
applied in the model and simulated the resulting dynamic impedance (B) while also reporting the associated voltage (A). Average clinical data and individual model data were fit by
a power law. While absolute difference between clinical cases and models are expected (e.g. given variation in protocol and the dependence of conductivity on waveform), the
power law fits well the clinical and modeling data. Noting the significant decrease in change in impedance (reflecting decrease scalp resistivity) with increasing voltage/current, we
predicted the associated peak brain electrical fields. Increasing voltage (C) or current (D) increased brain electric field in linear manner. Our adaptive-conductivity models show
linear relation between electric field and applied voltage and applied current. (E) In a Medical University of South Carolina ECT patient series, stimulation intensity was varied
between 600 and 900 mA, with associated seizure thresholds and dynamic impedances reported. Predictions of dynamic impedance from the endogenous adaptive models at 600
and 900 mA are also shown.
adaptive models suggest a complex relationship (Fig. 6 B). Indeed, impact (unmeasurable) brain current flow and how they are re-
adaptive ECT models predict a non-monotonic relationship be- flected in (measurable) impedance parameters, may support efforts
tween static impedance, dynamic impedance, and brain currents to optimize ECT therapy.
(Fig. 7). Nevertheless, understanding how adapting scalp properties
1166You can also read