Greater Montréal's 2020 2000-2019 in Review - Fondation du Grand Montréal
←
→
Page content transcription
If your browser does not render page correctly, please read the page content below

Greater Montréal’s
                            2020
              2000-2019 in Review

Created by:                  YEARS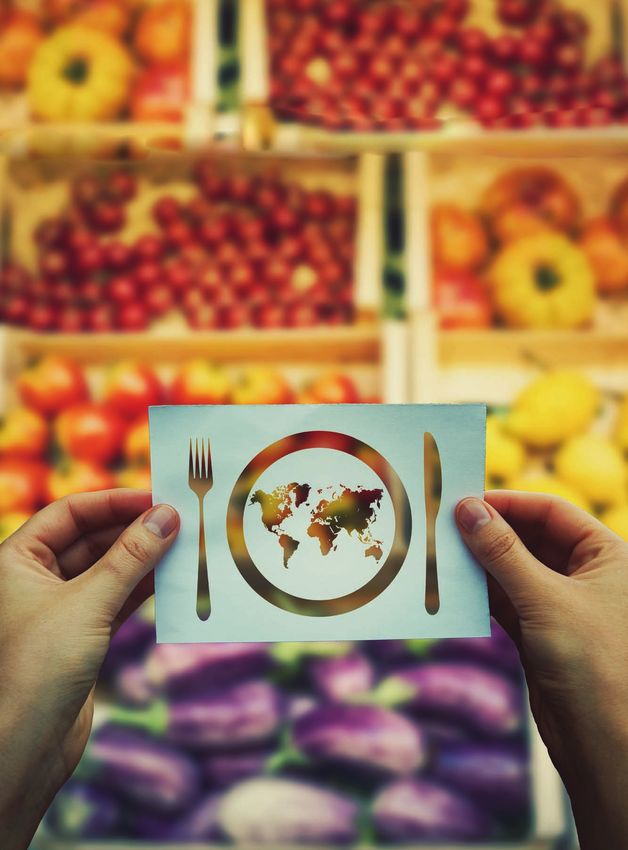
Table of contents
A MESSAGE FROM THE
3 A word from FGM's President and CEO PRESIDENT AND CEO
4 Part 1: the Vital Signs report OF THE FOUNDATION OF GREATER MONTRÉAL
4 The 16 Sustainable Development Goals (SDGs)
As part of a series of initiatives coinciding with its 20th anniversary, the Foundation of Greater
8
Montréal (FGM) presents a special edition in the Vital SignsTM of Greater Montréal series of reports.
Demographic context As a community foundation, FGM plays a role that goes beyond just promoting philanthropy; it also
has a duty to inform, to unify, and to encourage collective action in our community. By publishing Vital
12 SDG 1: No Poverty
Signs®, FGM brings forward its own contribution to public debate, and to the search for solutions, with
regard to the challenges that Greater Montréal will have to take up today and in the future.
16 SDG 2: Zero Hunger As was the case when we published the previous Vital SignsTM report in 2017, the United Nations’
Sustainable Development Goals (SDG) are the matrix through which the report was created. The SDG
20 SDG 3: Good Health and Well-Being
framework, a positive, inspiring, and comprehensive program for human development, is also the
North Star that guides FGM in its commitment to the community and in giving support to its donors.
24 SDG 4: Quality Education What, then, does the picture look like when we use the SDGs to assess Greater Montréal’s current
situation? Using the targets set in the SDG framework, we can certainly say that the metropolitan
How to use this report
28
region has been economically vibrant over the last few years. The stagnation of the first decade of the
SDG 5: Gender Equality 21st century has given way to vigorous economic growth and a significant drop in the unemployment
rate. This is an impressive turnaround, proof of the diversity and dynamism of businesses in the
START CONVERSATIONS. TAKE ACTION.
32 SDG 6: Clean Water and Sanitation If you or your organization is moved or
motivated by what you read, use this
metropolitan region. Unfortunately, this transformation has not benefited other vital sectors of our
society; we see that major problems persist. Indeed, Montréal is, for example, the capital of child
poverty in Quebec, and levels of food insecurity are higher here than anywhere else in the province.
34
report as a starting point for positive
Despite substantial efforts, social exclusion, high numbers of young people dropping out of school,
SDG 7: Affordable and Clean Energy action.
and mental health issues are still part of the landscape in Greater Montréal today. In all of these areas,
36
PASS IT ON. Share the report with your we absolutely need a major shift in our way of doing things, so that we can build a community that is
SDG 8: Decent Work and Economic Growth friends, colleagues, employees, students, sustainable and resilient, as healthy socially as it is economically.
neighbours, library, community centre or
40 SDG 9: Industry, Innovation and Infrastructure
an elected official at any level.
FIND OUT MORE. Learn about the many
So as to offer as wide a perspective as possible on these issues, we have divided this year’s report into
two parts. In the first part, you will not only discover how Montréal stands now in relation to the SDGs,
but also how the city has evolved with regard to these barometers over the last two decades. There are
44 SDG 10: Reduced Inequalities
organizations in our community working
to improve it, and see how you too can
limits to what the available data can tell us, but nonetheless, this longitudinal survey will help you take
the measure of the successes and challenges that have marked the start of this 21st century in Greater
help.
48 SDG 11: Sustainable Cities and Communities CONTACT US. We know about the
Montréal. In the second part, we have asked several individuals who will be the leaders of tomorrow to
lay out their vision of what Greater Montréal could be in 2030. Working in a multitude of sectors, these
issues of our community as well as the individuals will be at the forefront of the Decade of Action, a United Nations initiative that is meant to
52 SDG 12: Responsible Consumption and Production
organizations working to improve them.
If you would like to make a difference, we
carry us through to the SDG deadline in 10 years. Through the missions their organizations pursue,
and the projects they are bringing to fruition, these leaders will help us see what the Greater Montréal
of tomorrow could look like.
54
can help and guide you. www.fgmtl.org
SDG 13: Climate Action This is the abridged version of Greater
I would like to thank the Institut du Québec, which was responsible for researching and writing this
Montreal’s Vital SignsTM 2020 report.
56 SDG 14: Life Under Water The full version is available on the FGM
website.
report. A thank you also goes to the Lucie and André Chagnon Foundation for its support for this
initiative, and to the members of the Vital SignsTM strategic committee for giving their time, their
expertise and their advice.
58 SDG 15: Life On Land
I hope this publication will be of use to anyone seeking to get a clearer picture of the health of
60
our community. I hope that it will stimulate discussion, and serve as a tool to drive even stronger
PLEASE NOTE:
SDG 16: Peace, Justice and Strong Institutions engagement by all to achieve the Sustainable Development Goals. This document is an abridged
This report was completed in February version of Vital SignsTM of Greater Montréal 2020; I heartily encourage you to consult the full version
64 Part 2: Outlook on 2030 from Future Leaders
2020, prior to the COVID-19 crisis. The
report is an overview of conditions
of the report, which is available on FGM's website.
prevailing between 2000 and 2019. It
78 Sources and Acknowledgements - includes no coverage of the situation in
Greater Montréal since the start of 2020. Yvan Gauthier
FGM Staff and Board of Directors
President and CEO
Foundation of Greater Montréal
3
The 16 Sustainable Development Goals (SDGs) used
for the Vital SignsTM report
Goals Targets* Goals Targets*
SDG 1 1.1 Eradicate extreme poverty for 1.2 Reduce at least by half the 1.3 Implement nationally SDG 5 5.1 End all forms of discrimination 5.4 Recognize and value unpaid 5.5 Ensure women’s full and
No Poverty all people everywhere, currently proportion of men, women and appropriate social protection Gender Equality against all women and girls care and domestic work through effective participation and equal
measured as people living on less children of all ages living in poverty systems and measures for all, everywhere. the provision of public services, opportunities for leadership at
End poverty in all its Achieve gender infrastructure and social protection all levels of decision-making in
than 1,90 USD. in all its dimensions according to including floors, and by 2030
forms everywhere equality and empower 5.2 Eliminate all forms of violence policies and the promotion of political, economic and public life.
national definitions. achieve subtantial coverage of the
all women and girls against all women and girls in shared responsibility within the
poor and vulnerable.
the public and private spheres, household and the family as
including trafficking and sexual and nationally appropriate.
other types of exploitation.
SDG 2 2.1 End hunger and ensure access 2.2 End all forms of malnutrition, 2.3 Double the agricultural
Zero Hunger by all people, in particular the poor including achieving, by 2025, the productivity and incomes of small-
and people in vulnerable situations, internationally agreed targets on scale food producers, in particular
End hunger, achieve including infants, to safe, nutritious stunting and wasting in children women, indigenous peoples, family SDG 6 6.1 Achieve universal and equitable 6.2 Achieve access to adequate and 6.3 Improve water quality by
food security and and sufficient food all year round. under 5 years of age, and address farmers, pastoralists and fishers, Clean water access to safe and affordable equitable sanitation and hygiene for reducing pollution, eliminating
improved nutrition the nutritional needs of adolescent including through secure and equal and sanitation drinking water for all. all and end open defecation, paying dumping and minimizing release of
and promote girls, pregnant and lactating women access to land, other productive special attention to the needs hazardous chemicals and materials,
sustainable Ensure availability of women and girls and those in halving the proportion of untreated
and older persons. ressources and inputs, knowledge,
agriculture and sustainable vulnerable situations. wastewater and subtantially
financial services, markets and
management of water increasing recycling and safe reuse
opportunities for value addition and
and sanitation for all globally.
non-farm employment.
SDG 3 3.1 Reduce the global maternal 3.4 Reduce by one third premature 3.7 Ensure universal access
Good Health mortality ratio to less than 70 per mortality from non-communicable to sexual and reproductive
and Well-Being 100,000 live births. diseases through prevention and healthcare services, including for SDG 7 7.1 Ensure universal access to 7.2 Increase substantially the share 7.3 Double the global rate of
treatment and promote mental family planning, information and Affordable and affordable, reliable and modern of renewable energy in the global improvement in energy efficiency.
Ensure healthy 3.2 End preventable deaths of health and well-being. education, and the integration of Clean Energy energy services. energy mix.
lives and promote newborns ans children under 5 reproductive health into national
well-being for all years of age, with all countries 3.5 Strenghten the prevention and Ensure access to
strategies and programmes.
at all ages aiming to reduce neonatal mortality treatment of substance abuse, affordable, reliable,
to at least as low as 12 per 1,000 including narcotic drug abuse and 3.8 Achieve universal health sustainable and
live births and under-5 mortality to harmful use of alcohol. coverage, including financial modern energy for all
at least as low as 25 per 1,000 live risk protection, access to quality
births. 3.6 By 2020, halve the number of essential healthcare services and
global deaths and injuries from access to safe, effective, quality
3.3 End the epidemics of AIDS, road traffic accidents. SDG 8 8.1 Sustain per capita economic 8.3 Promote development-oriented 8.6 By 2020, substantially reduce
and affordable essential medecines
tuberculosis, malaria and neglected Decent Work and growth in accordance with national policies that support productive the proportion of youth not in
and vaccines for all.
tropical diseases and combat Economic Growth circumstances and, in particular, activities, decent job creation, employment, education or training.
hepatitis, water-borne diseases and at least 7 per cent gross domestic entrepreneurship, creativity
Promote sustained, product growth per annum in the and innovation, and encourager 8.8 Protect labour rights and
other communicable diseases.
inclusive and least developed countries. the formalization and growth of promote safe and secure working
sustainable micro-, small- and medium-sized environments for all workers,
economic growth, 8.2 Achieve higher levels of entreprises, including through including migrant workers, in
full and productive economic productivity through access to financial services. particular women migrant, and
SDG 4 4.1 Ensure that all girls and boys 4.5 Eliminate gender disparities 4.6 Ensure that all youth and a employment and diversification, technological those in precarious employment.
Quality Education complete free, equitable and quality in education and ensure equal substantial proportion of adults, decent work for all upgrading and innovation, including 8.5 Achieve full and productive
primary and secondary education access to all levels of education both men and women, achieve through a focus on high-value employment and decent work for 8.10 Strengthen the capacity of
Ensure inclusive and leading to relevant and Goal-4 and vocational training for the literacy and numeracy. domestic financial institutions to
added and labour-intensive sectors. all women and men, including for
equitable quality effective learning outcomes. vulnerable, including persons with encourage and expand access to
younger people and persons with
education and disabilities, indigenous peoples and banking, insurance and financial
disabilities, and equal pay for work
promote lifelong 4.2 Ensure that all girls and boys children in vulnerable situations. services for all.
of equal value.
learning opportunities have access to quality early
for all childhood development, care and
pre-primary education so that they
are ready for primary education.
* by 2030, unless specified otherwise
4 5
Goals Targets* Goals Targets*
SDG 9 9.1 Develop quality, reliable, 9.3 Increase the access of action in accordance with their SDG 14 14.1 By 2025, prevent and take action for their restoration can produce maximum sustainable
Industries, Innovation sustainable and resilient small-scale industrial and other respective capabilities. Life Below Water significantly reduce marine in order to achieve healthy and yield as determined by their
and Infrastructure infrastructure, including regional entreprises, in particular in pollution of all kinds, in particular productive oceans. biological characteristics.
and transborder infrastructure, to developing countries, to financial 9.5 Enhance scientific research, Conserve and from land-based activities,
Build resilient support economic development services, including affordable upgrade the technological sustainably use the 14.4 By 2020, effectively regulate 14.5 By 2020, conserve at least
including marine debris and
infrastructure, and human well-being, with a focus credit, and their integration into capabilities of industrial sectors oceans, seas and harvesting and end overfishing, 10 per cent of coastal and marine
nutrient pollution.
promote inclusive on affordable and equitable access value chains and markets. in all countries, in particular marine ressources illegal, unreported and unregulated areas, consistent with national and
and sustainable for all. developing countries, including for sustainable 14.2 By 2020, sustainably manage fishing and destructive fishing international law and based on the
industrialization and 9.4 Upgrade infrastructure and encouraging innovation and development and protect marine and coastal practices and implement science- best available scientific information.
foster innovation 9.2 Promote inclusive and retrofit industries to make them subtantially increasing the number ecosystems to avoid significant based management plans, in order
sustainable industrialization and sustainable, with increased of research and development adverse impacts, including by to restore fish stocks in the shortest
significantly raise industry’s share resource-use efficiency and workers per 1 million people and strengthening their resilience, and time feasible, at least to levels that
of employment and gross domestic greater adoption of clean public and private research and
product, in line with national and environmentally sound development spending.
circumstances, and double its share technologies and industrial
in least developed countries. processes, with all countries taking SDG 15 15.1 By 2020, ensure the 15.2 By 2020, promote the 15.5 Take urgent and significant
Life On Land conservation, restoration and implementation of sustainable action to reduce the degradation
sustainable use of terrestrial and management of all types of of natural habitats, halt the loss of
SDG 10 10.1 Progressively achieve 10.4 Adopt policies, especially Sustainably manage inland freshwater ecosystems and forests, halt deforestation, restore biodiversity and, by 2020, protect
Reduced Inequalities and sustain income growth of fiscal, wage and social protection forests, combat their services, in particular forests, degraded forests and subtantially and prevent the extinction of
the bottom 40 per cent of the policies, and progressively achieve desertification, halt wetlands, mountains and drylands, increase afforestation and threatened species.
Reduce inequality population at a rate higher than the greater equality. and reverse land in line with obligations under reforestation globally.
within and among national average. degradation and halt international agreements.
countries biodiversity loss 15.3 Combat desertification, restore
degraded land and soil, including land
affected by desertification, drought
and floods, and strive to achieve a
SDG 11 11.1 Ensure access for all to of those in vulnerable situations, 11.6 Reduce the adverse per land degradation-neutral world.
Sustainable Cities adequate, safe and affordable women, children, persons with capita environmental impact
and Communities housing and basic services and disabilities and older persons. of cities, including by paying
upgrade slums. special attention to air quality
Make cities inclusive, 11.4 Strengthen efforts to protect and municipal and other waste SDG 16 16.1 Significantly reduce all forms 16.4 Significantly reduce illicit 16.7 Ensure responsive, inclusive,
safe, resilient and 11.2 Provide access to safe, and safeguard the world’s cultural management. Peace, Justice and of violence and related death rates financial and arms flows, strengthen participatory and representative
sustainable affordable, accessible and and natural heritage. Strong Institutions everywhere. the recovery and return of stolen decision-making at all levels.
sustainable transport systems for assets and combat all forms of
all, improving road safety, notably Promote just, peaceful 16.2 End abuse, exploitation, organized crime.
by expanding public transport, and inclusive societies trafficking and all forms of violence
with special attention to the needs against and torture of children. 16.5 Substantially reduce corruption
and bribery in all their forms.
16.3 Promote the rule of law at the
SDG 12 12.2 Achieve the sustainable 12.4 By 2020, achieve the 12.5 Substantially reduce waste national and international levels 16.6 Develop effective, accountable
Responsible management and efficient use of environmentally sound generation through prevention, and ensure equal access to justice and transparent institutions at all
Consumption and natural ressources. management of chemicals and reduction, recycling and reuse. for all. levels.
Production all wastes throughout their life
12.3 Halve per capita global food cycles, in accordance with agreed
Ensure sustainable waste at the retail and consumer international frameworks, and
consumption and levels and reduce food losses along significantly reduce their release
production patterns production and supply chains, to air, water and soil in order to
including post-harvest losses. minimize their adverse impacts in
human health and the environment.
SDG 13 13.1 Strengthen resilience and 13.2 Integrate climate change
Climate Action adaptive capacity to climate-related measures into national policies,
hazards and natural disasters in all strategies and planning.
Take urgent action countries.
to combat climate
change and its
impacts
* by 2030, unless specified otherwise
6 7
DEMOGRAPHIC
Indeed, since 2016, Montréal has seen considerable momentum in terms of
population growth, while the rest of Quebec is growing at a slower rate.
Population growth in Montréal CMA and elsewhere in Quebec
(annual variation in % and average annual growth from 2009 to 2019)
CONTEXT
Graph 1
.
. 1.5%
1.5%
Greater Montréal, 20 years later .
1.3%
1.2%
1%
1%
0.9%
1.2%
1%
0.9% 0.9% 0.9%
Almost 15 years have gone by since the publication of the first edition of the Vital SignsTM of Greater Montréal report by the Foundation 0.7% 0.8%
0.7% 0.6%
of Greater Montréal. Years that saw the region experiencing an economic rebirth but also continuing to face major challenges: feed all its . 0.6% 0.6%
0.5%
citizens, without exception, ensure decent income and housing for all, and take on the environmental crisis. Greater Montréal in 2020 is 0.5%
0.4% 0.4%
not the Greater Montréal of 2000, so we need to look at the road that’s been travelled since then. 0.3%
0.2%
To measure the progress, and the shortfalls, of the region using the appropriate indicators, we chose a guiding framework: the United .
Average
Nations’ Sustainable Development Goals. This framework allows us to assess a variety of data according to their relative importance, thus
setting aside indicators that only show part of the region’s reality.
This document is divided according to the 16 Sustainable Development Goals that we have concluded are relevant. Where possible, Montréal Quebec outside Montréal
data are used to trace an historic picture, and are linked to the targets that have been set for each Goal. The indicators we have selected Source: Institut de la statistique du Québec
sometimes to refer to the City of Montréal, the island of Montréal, the Communauté Métropolitaine de Montréal (CMM) or the Census
Metropolitain Area (CMA). The choice of geographic context stems from the availability of data, and the context is specified. Lastly, when
regional data are not available, we have used province-wide data.
Children
In all, 824,409 children under 18 lived in the Montréal CMA in 2018. While this is an increase
A look at the demographics in absolute numbers over the period of 2001 to 2018, the relative weight of this group in the
population has gradually diminished, going from 21.6 % in 2001 to 20.7% in 2006, then to
19.6 % in 2011 and 19.4 % in 2018.
A region experiencing growth Distribution by age group in Montréal CMA (in%)
Graph 2
Figure 1: Map of the Montréal metropolitan
region, 2016 .
Source: Statistics Canada .
According to the Institut de la statistique . .
du Québec1, the Montréal Census
Metropolitan Area (CMA) had 4,318,505
.
inhabitants in 2019 , which represents 2 .
an average annual increase of 1% when
. .
.
compared with 2009 (3,9 million). .
Over the last 10 years, Montréal’s
.
population increased at a greater
rate than that of the rest of Quebec.
0-4 years 5-12 years 13-17 years
Source: Institut de la statistique du Québec
1
http://www.stat.gouv.qc.ca/statistiques/population-demographie/structure/rmr-totaux.htm
8 2
Note that 2019 population data is preliminary. 9
Births                                                                     Mother tongue                                                  Immigration
The number of births in the Montréal CMA                                   In the Montréal CMA, the vast majority                         The Montréal CMA is one of the three
remained relatively stable, having increased                               (93.8%) of children under 15 years of                          regions in Canada where the concentration
by 2.8% since 2006 to reach 44,675 in 2018.                                age have a single mother tongue, either                        of immigrants is the highest. Indeed, among
During this period, this figure remained                                   French (64.7 %), English (12.3%) or another                    immigrants who landed in Quebec between
higher than in the rest of Quebec.                                         language (16.8%).                                              2008 and 2017 and who still resided there
                                                                                                                                          in 2019, 72.2% lived in the administrative
In 2018, the birth rate stood at 10.5%, its                                The situation differs quite a bit from one
                                                                                                                                          region of Montréal, in Laval and in Greater
lowest level since 2006. The total fertility                               municipality to another within the Montréal
                                                                                                                                          Longueuil. The rest lived in another region
rate stood at 1.51 children per female, under                              CMA, although French continues to be the
                                                                                                                                          (24.8%) or had a domicile that could not be
the rate of 1.59 for the whole of Quebec                                   most common mother tongue. In 2016,
                                                                                                                                          clearly established (3.0%).
and for Gatineau (1.57), but above those of                                French was the mother tongue of 47.5% of
Quebec City (1.46) and Trois-Rivières (1.46)3.                             children under 15 in Montréal, while that                      In 2016 in Montréal4, 321, 675 children
                                                                           proportion reached 56.9% in Laval, 71.7%                       under 15 had at least one parent who was
In 2016, in the Montréal CMA, 451,875
                                                                           in Longueuil and 86.3% in the rest of the                      born abroad, which represents 46.6% of
couples had children, as well as 172,240
                                                                           Montréal CMA.                                                  the total population in this group. That is
single parent families. Most couples had
                                                                           Conversely, the percentage of youths                           a percentage that is far greater than the
two children, and more than three-quarters
                                                                           under 15 whose mother tongue was neither                       number for the whole of Quebec, (29.4%),
of the single parent families were headed
                                                                           French nor English was 25.6% in Montréal,                      but less than the numbers found in Toronto
by a woman. Most single parent families
                                                                           23.3% in Laval, 15.1% in Longueuil and barely                  (71%) or Vancouver (63.7%).
only had one child.
                                                                           4.4 % in the remainder of the Montréal CMA.

An aging population
Even though the Montréal CMA saw a greater influx of young people than the rest of Quebec did, the aging of the
population is still a clear reality here. The proportion of elderly individuals in the region has increased.
The average age in the Montréal CMA stands at 40.8 years, and a bit more than 40% of the population is aged between
35 and 65.

Demographic pyramid, Montréal CMA, 2006 and 2019

Graph 4
                                                   Pyramide des âges, RMR de Montréal, 2006 et 2019
                  200,000               150,000               100,000                50,000                   0          50,000         100,000      150,000          200,000

9090 ansand
  years  et plus
             over
   8585
      toà89
          89years
             ans
   8080
      toà84
          84years
             ans
    75toà79
   75     79years
             ans
    70toà74
   70     74years
             ans
   6565
      toà69
          69years
             ans
   6060
      toà64
          64years
             ans
    55toà59
   55     59years
             ans
   5050
      toà54
          54years
             ans
   4545
      toà49
          49years
             ans
   4040
      toà44
          44years
             ans
   3535
      toà39
          39years
             ans
   3030
      toà34
          34years
             ans
   2525
      toà29
          29years
             ans                                                                                                                                                                        Worth Noting
    20toà24
   20     24years
             ans
                                                                                                                                                                                        Over the last 20 years, Montréal’s population has grown faster than that
      15toà 19
     15      19years
                ans
     10to
        à 14years
          14 ans
                                                                                                                                                                                        of Quebec overall. Greater Montréal’s population is not aging to the same
     10
                                                                                                                                                                                        extent as that of the rest of Quebec. This can be attributed to several
      5 5toà99years
               ans
      0 0toà44years
               ans
                                                                                                                                                                                        factors, including the impact of immigration.

                                                      Hommes  - 2019
                                                      Men - 2019                  Hommes  - 2006
                                                                                  Men - 2006                  Femmes - 2019
                                                                                                              Women               Femmes - 2006
                                                                                                                                  Women    2006        Source: Statistique Canada,
                                                                                                                                                       tableau: 17-10-0135-01

10              To consult the definitions of the terms «birth rate» and «total fertility rate», see chapter 2 of
                                                                                                                                                                                                                                                                    11
            3

                Bilan démographique du Québec (2019), from the Institut de la statistique du Québec.
            4
                Data are from Statistics Canada’s 2016 Census.
1 No Poverty Graph 1-1 Evolution of the percentage of people in poverty in Montréal and Quebec based on the Market
Basket Measure, base year 2008 (%)
End poverty in all Source: Statistique Canada, Tableau : 11-10-0136-012
its forms everywhere
Poverty persists,
though it has eased
a bit
Despite experiencing economic growth
over the past several years, the Montreal
region is still grappling with problems
caused by poverty. In certain areas
and neighbourhoods in particular, Gauging poverty1
the difficulties are persistent. Greater Poverty can by measured through a variety of indicators, all of
Montréal’s residents, with the exception which have their strengths and weaknesses. The Low Income
of some individuals experiencing Measure is calculated based on a household’s adjusted income,
homelessness, all earn more than $1.90 US weighted according to its size. An income is considered low if it is
per day (which is the poverty line set by the at 50% or less of the median weighted income. This measurement
World Bank); and yet, that doesn’t mean is effective in comparing interprovincial and international data, but
that poverty has been eliminated. Some of does not factor in cost of living, which can vary among regions.
the region’s neighbourhoods and sectors This measure is relative, since it varies according to the income
continue to be home to too many people level in society in general. For instance, an increase in median Quebec Montréal CMA
living in poverty. income can result in an increase in the percentage of individuals
In general, if we go by the Market Basket considered as having low incomes, without their situation having
Measure (see side box), the situation in actually worsened.
Greater Montréal has admittedly gotten Another indicator is the Market Basket Measure (MBM), which is
The way people experience
better, as is the case for Quebec as a
whole. By that standard, in 2017, 11.6% of
based on the cost of the various products and services necessary
to ensure a modest, basic standard of living for a family of two
poverty varies with age
Montrealers did not have enough income parents and two children. This measure is adjusted to take into Even if MBM constitutes an absolute and general measurement of
to purchase the basic goods and services account variations in the cost of living from one region to another poverty, it looks at people in different age groups in different ways.
needed to live a full life in our society. and for different types of families. MBM allows us to capture the For instance, the elderly are more likely to live in poverty in Greater
In 2006 (the first year for which this relation between incomes and families’ needs. However, it is not Montréal. In 2017, 21.3% of families that included at least one
measurement is available), that percentage easily comparable from region to another. It is an absolute measure elderly person were experiencing poverty. We should note, though,
stood at 14.6%. of poverty, since it indicates the exact percentage of individuals that the picture has brightened a bit since 2006.
Again, using this standard, the poverty rate
for Greater Montréal is 2.6 points higher
who don’t have enough to be able to participate actively in society.
That is the percentage that needs to be brought down as much
A similar situation can be seen among young people. Indeed, Montréal, the child poverty
an examination of the data from the 2016 Census leads to the
than that of Quebec for 2017. as possible.
conclusion that poverty affects two age groups in particular: capital of Quebec
young people between 20 and 24 years of age, and persons older
than 653. A 2018 analysis of poverty by federal electoral riding
from the Campaign 2000 organization found that the
four Quebec ridings experiencing the highest child
poverty rates were located in Montréal4. Conversely,
Montréal’s suburbs stood out in a positive way, since
they featured some of the lowest child poverty rates
in Canada.
1
From Côté and Scarfone, 2019, and adapted by Crespo, 2019. 2
Statistics Canada published a preliminary version of the data based on a 2018 basket. As it is subject to revision, we did not include this version.
12 3
https://www12.statcan.gc.ca/census-recensement/2016/as-sa/fogs-spg/Facts-cma-fra.cfm?LANG=Fra&GK=CMA&GC=462&TOPIC=6 13
4
Mettons fin à la pauvreté des enfants et des familles, Campagne 2000, 2018.
https://campaign2000.ca/wp-content/uploads/2018/06/June2018-FR-Campaign-2000-Riding-by-Riding-Child-Poverty-Report-FR.pdf6
Table 1-1 Poverty is persistent Thus, 5.3% of the population in the Montréal CMA were in the low
income category for the eight years comprised between 2010 and
One element that stands out from our survey of the 2017. Worse yet, not only has that percentage not diminished since
available data is the persistence of poverty. That people 2000, but it has actually increased. Breaking the cycle of poverty
should have to live in poverty even temporarily is dramatic appears to be very difficult for these individuals.
Number of children Percentage of
(0 to 17 years) children (0 to enough, but the fact that this situation is repeated year
Federal riding Province or territory after year attests to a more serious underlying issue. In
in low income 17 years) in low
families income families (%) this vein, the statistics that illustrate poverty in Greater Graph 1-3 Percentage of individuals having reported
Churchill–Keewatinook Ask Montréal paint a very disturbing picture. 8 years of low income in Greater Montréal
Manitoba 21,870 64.2%
between 2000 and 2017
Desnethé–Missinippi–Churchill River Saskatchewan 15,300 57.8%
Winnipeg Centre Manitoba 7,730 41.1% Graph 1-2 Persistence of poverty, based on the
Low Income Measure, Montréal CMA,
Toronto Centre Ontario 4,210 40.0%
2010 to 2017 (%)
Ville-Marie–Le Sud-Ouest–Île-des-Soeurs Québec 5,260 38.1%
Nunavut Nunavut 5,150 36.1%
Kenora Ontario 6,090 34.7% 8
6 7 0 years at low income
5 0 année à faible revenu
Hamilton Centre Ontario 6,240 34.2% 4
3 1 years at low income
1 année à faible revenu
Dauphin–Swan River–Neepawa Manitoba 6,910 33.8% 2 22 years àatfaible
années low income
revenu
Sydney–Victoria Nouvelle-Écosse 4,500 33.0% 33 years àatfaible
années low income
revenu
1
44 years àatfaible
années low income
revenu
Humber River–Black Creek Ontario 8,840 32.9%
55 years àatfaible
années low income
revenu
Bourassa Québec 7,130 32.9% 0
66 years àatfaible
années low income
revenu
Scarborough–Guildwood Ontario 7,720 32.9% 7 years àatfaible
7 années low income
revenu
Winnipeg North 88 years àatfaible
années low income
revenu
Manitoba 8,250 32.3%
Windsor West Ontario 8,680 32.1%
Source: Statistique Canada, Tableau 11-10-0025-01
Saint-Léonard–Saint-Michel Québec 8,730 31.9% Source: Statistique Canada, Tableau: 11-10-0136-01
Edmonton Griesbach Alberta 7,610 31.7%
Ottawa–Vanier Ontario 5,720 31.3%
Social support Graph 1-4 Percentage of individuals on social assistance,
Etobicoke North Ontario 9 050 30.8% 0-64 years of age, November 2019
Battlefords–Lloydminster The government program that best
Saskatchewan 6 260 30.4%
demonstrates the social support
Regina–Qu'Appelle Saskatchewan 6 110 30.2% given to people living with poverty is .
York South–Weston Ontario 7 630 29.9% social assistance. While the number of
Scarborough Centre Ontario 6 980 29.3%
beneficiaries has dropped overall through 7.4%
the years, it remains higher on the island
Saskatoon West Saskatchewan 6,580 29.3% .
of Montréal than for Quebec as a whole in
Scarborough Southwest Ontario 6,960 29.3% people under 65 years of age.
5.3%
Scarborough–Agincourt Ontario 5,500 29.1% .
4.5%
4.1% 4.2%
Papineau Québec 5,680 29.1%
3.6%
Don Valley East Ontario 5,480 28.7%
.
Ottawa South Ontario 6,930 28.6%
Prince Albert Saskatchewan 5,850 28.3%
.
Source: Mettons fin à la pauvreté des enfants et des familles, Campagne 2000, 2018 Island of Montréal
https://campaign2000.ca/wp-content/uploads/2018/06/June2018-FR-Campaign-2000-Riding-by-Riding-Child-Poverty-Report-FR.pdf
Source: https://www.mtess.gouv.qc.ca/publications/pdf/00_AS-statistiques-2019-11.pdf
Worth noting
Poverty in Greater Montréal has gone down in absolute numbers. However, pockets of
poverty still exist in certain areas, and some individuals remain trapped in situations of
poverty for long periods of time.
14 15
2 Zero Hunger Two ways of understanding
hunger on the island of Montréal
End hunger, guarantee food security, What is food insecurity?
Out of
improve nutrition and promote
Statistics Canada has defined the following situations1:
100
sustainable agriculture
Marginal food insecurity
Indications that there are fears of, or obstacles to, adequate and sure
Montrealers
access to food, due to income level.
Moderate food insecurity
14
Indications that the quality or quantity of food consumed is inadequate. are experiencing food insecurity.
Percentage of the population experiencing food insecurity, Hunger: still a
2015-2016. Of these,
serious problem Severe food insecurity
9
Indications of reductions of food intake and disruption of eating patterns.
Graph 2-1
As was noted in the 2017 Vital SignsTM report,
In all of these situations, healthy eating is compromised.
Source1 Whole of Quebec
the island of Montréal is more affected than have income from employment.
3.0 4.9 2.4 10.4
other areas in the province by the problem of
food insecurity, in that 13.6% of its population
experiences food insecurity, including 3.1% in a
Out of
Montréal 3.4 7.0 3.1 13.6
situation of severe food insecurity.
40.6% of the population living on the island of
Looking at this from another angle, 11.7% of those on the island of Montréal
who had employment income were experiencing food insecurity. People who 100
Montréal and having a household income of experience poverty are often working people. Montrealers who work,
less than $20,000 experienced food insecurity, Single parent families are the ones most often suffering due to this phenomenon:
12
Marginal insecurity Moderate insecurity Severe insecurity
versus 36.4% for all of Québec –a difference 23.1% of those living on the island of Montréal and 19.9% of those in Quebec as a
that is probably attributable to the relatively whole experience food insecurity. On the island of Montréal, more than one couple
Percentage of the population experiencing food insecurity, higher cost of life in the city . in 10, with or without children, is experiencing food insecurity.
experience food insecurity.
2015-2016, by income.
We note as well that for the whole of Quebec,
as well as for the island of Montréal, more than Proportion of the population experiencing food insecurity according to type of household, 2015-2016.
Graph 2-2
one person in 10 having an income of $40,000
to $59,999 nonetheless experienced food
Source1 Graph 2-4
insecurity.
41 Over the last 20 years, the number
35
of food baskets provided by Person living alone
food banks has nearly doubled.
18 17
This increase is likely due to a
13
11 combination of two factors: demand
Single parent family
6 5 for assistance remaining steady,
simultaneous with an increase in
Under $20,000 $20,000 to $39,999 $40,000 to $59,999 $60,000 and over
Whole of Quebec
services offered by food banks.
Couples, with or
Distribution of the population experiencing food insecurity by income source.
without children
Graph 2-3
It can be difficult even
for those with a job
Source1 6.3%
In a similar vein, a disturbing statistic is that
66,4% of individuals who experience food
Other
21.2% insecurity also earn employment income.
We can thus conclude that a significant
number of our fellow citizens who are
66.4% experiencing food insecurity are employed,
6.1%
but that their incomes do not allow them to
ensure an adequate food intake.
Montréal Whole of Quebec
Direction de la Santé Publique de Montréal, Enquête sur l’insécurité alimentaire,
Employment income Old Age Security Employment insurance, Other Compilation spéciale à partir du FMGD de l’ESCC 2015-2016 de Statistique Canada. Document à paraître.
CNESST, social assistance
16 Direction de la Santé Publique de Montréal, Enquête sur l’insécurité alimentaire, Statistics Canada, Household food insecurity, 2011-2012 https://www150.statcan.gc.ca/n1/pub/82-625-x/2013001/article/11889-eng.htm
17
1 1
Compilation spéciale à partir du FMGD de l’ESCC 2015-2016 de Statistique Canada.
Document à paraître.
Out of the 345,184 visits to food assistance programs for the whole of Quebec in March 2019, 122,811 were made to
Moisson Montréal – over a third, even though the Island of Montréal represents a little under a quarter of Quebec’s
population. Moisson Montréal’s 2009-2010 report tallied 115,467 food bank visits per month.
In March 2019, 46,411 visits were made to Moisson Rive-Sud, a substantial increase of 26% as compared to the
number of visits in 2018. On the other hand, Moisson Laval reported a decrease in use, with visits down by 15%,
to 26,697.

Table 2-1

                                                                                                            Proportion of food bank
                                                                Total number of visits to
                                                                                                            users who are children
                                                                food assistance programs
                                                                                                            aged 18 or below

 Moisson Laval                                                                26,697                                      58.0 %
 Moisson Lanaudière                                                            23,717                                     32.6 %
 Moisson Laurentides                                                          33,566                                      28.9 %
 Moisson Montréal                                                             122,811                                     35.2 %
 Moisson Rive-Sud                                                              46,411                                      37.3 %

Source: Les Banques alimentaires du Québec (Site Internet, consulté en février 2020), Bilan-Faim 2019.
https://www.banquesalimentaires.org/bilan-faim/

More than 35% of households that resorted to food banks                                              There was a slight increase in the proportion of obese
had children under 18 – a percentage comparable to the                                               and overweight adults from 2009-2010 to 2013-2014, in
Canadian average (34%). The proportion was also 35% for                                              Québec (50.5% to 52.5%) as well as in Canada (52.0% to
the island of Montréal, and roughly the same on the South                                            53.8%). In general, the obesity rate was the percentage
Shore at 37%. However, 58% of Laval households using                                                 that went up, although on the island of Montréal, the
these services included children.                                                                    proportion was stable, at 50.8% for 2013-2014.
On this point, the frequency of junk food intake is down on                                          When it comes to youth (ages 12-17), the situation is
the island of Montréal, as it is in Quebec overall. That said,                                       barely more promising, as the percentage of obese and
intake of fruits and vegetables still remains inadequate.                                            overweight individuals in this age group increased in
School age children in particular benefit from an adequate                                           Canada (19.9% to 21.9%), in Quebec (18.4% to 22.2%)
and healthy diet.                                                                                    and on the island of Montréal (16.0% to 19.9%).

The TOPO 2017 survey revealed that among sixth grade
students on the island of Montréal, 38% did not eat
breakfast every day. In all, one student in seven had not
had breakfast at all in the school week preceding the
survey2.

          Worth noting
          Despite economic growth, a significant proportion of Greater Montréal’s
          population uses food banks. Many of these individuals are gainfully
          employed.

          2
              Centre Intégré Universitaire de Santé et de Services Sociaux of the Centre – South region of the island of Montréal (2018), Portrait des jeunes montréalais de 6e année. Results of the TOPO 2017
18            Survey by the direction régionale de santé publique.                                                                                                                                                19
3 Good Health and Well-Being Infant mortality A regional comparison can be established using a 2012 to 2016
average. While the rest for the province overall was at 4.7 ‰, we note
For Quebec as a whole, the estimated
large discrepancies among administrative regions. The Nord-du-
Ensure healthy lives and promote infant mortality rate for 20182 stood at
4.2 ‰. That represents the lowest rate ever
Québec region posted, by far, the highest rate, at 17,2 ‰, while the
Montérégie posted the lowest, at 3,5 ‰. The rate for the Montréal
well-being for all at all ages
recorded in the province. The trend over
region (4.6 ‰) was near the average, and those of all the other
the last 20 years has been a slight decrease
administrative regions stood between 4 and 6 ‰.
of the rate, and the average rate since 2000
has been 4.6 ‰.
Infant mortality rate, 2012-2016
Graph 3-1
Better health overall, Highlights of the Canadian Community Health Survey
5.8
17.2
but with an increase Table 3-1 5.7
5.5
in anxiety disorders Montréal Quebec Canada
5.4
5.3
among youth Well-being
5.2
5.2
What is the state of Montrealers’ health, as Perception of health is good or excellent 62.1 61.4 60.8 4.9
self-reported by them? How do we establish Capitale-Nationale 4.9
Perception of mental health is good or
comparisons with Quebecers as a whole, and 71.3 72.6 69.4 Quebec (province-wide rate) 4.7
excellent 4.6
Canadians as a whole? Table 1, which shows
Perceived stress level, very or extremely 4.5
the highlights of the Canadian Community 25.4 23.7 21.4
stressed 4.5
Health Survey (CCHS) for 2017-20181, carried Laurentides 4.4
out among residents 12 years old and over and Health issues
Estrie 4.4
published in October 2019, for the Montréal Body Mass Index, self-reported and 4.3
35.8 36.5 36.1
metropolitan region, sheds some light on this. corrected, adults 18 and over, excess weight 3.5
Several elements are noteworthy. For instance, Body Mass Index, self-reported and
24.2 25.9 26.9
a larger proportion of Montrealers than corrected, adults 18 and over, or obesity Source: Taux de mortinatalité, de mortalité périnatale, néonatale et infantile, Québec et régions administratives, 2012-2016
Canadians perceive their mental health to be Institut de la Statistique du Québec, 2012-2016
Asthma 7.7 8.2 8.1 http://www.stat.gouv.qc.ca/statistiques/population-demographie/deces-mortalite/315.htm.
good or excellent, and yet Montrealers also
perceive their stress levels to be higher than Mood disorders, including depression,
5.9 6.3 8.8
those of Quebecers and Canadians in general. bipolar disorder, mania and dysthymia
Health-related behaviours The opioid crisis Total number of deaths thought to be linked to opioid consumption
When it comes to health problems, adult
Montrealers report a rate of obesity (based Self-reported physical activity, 150 minutes In several developed countries, deaths
54.8 52.6 56.0 Graph 3-2
on the Body Mass Index) lower than that per week, adult (18 years or over) caused by opioid overdoses are on the
of Canadians, and less of a tendency to rise. According to the Organization for
Self-reported physical activity, 150 minutes
experience mood disorders than people 51.2 53.2 57.8 Economic Cooperation and Development
per week, youth (12 to 17 years)
elsewhere in the country. (OECD), Canada is the country that is
Excessive drinking 20.3 22.0 19.3 second hardest-hit, just after the United
As regards health behaviours, adults in States.
Currently smoke, occasionally or daily 17.4 17.9 16.0
Greater Montréal report a higher level of
physical activity than do Quebecers as a whole, Health system In 2018 alone, 4,460 individuals are thought
although adolescents are less active than their to have died as a result of having taken
Has a regular health care provider 73.4 78.5 84.9
Canadian counterparts. Montrealers engage in opioids. British Columbia (1,525) was the
Had flu shot in the last 12 months 22.2 22.4 32.0 most affected province, followed by Ontario
less excess drinking than other Quebecers, but
smoke more than Canadians as a whole. Personal resources (1,471), Alberta (775) and Québec (424).
The Quebec mortality rate (per 100, 000
As well, there seem to be more weak spots Life satisfaction, satisfied or very satisfied 93.8 94.1 93.1
inhabitants) amounts to less than half of
in the health system in Montréal: fewer Feeling of belonging to a local community, the Canadian average (5.1 versus 12.4). Quebec
60.7 61.1 68.9
Montrealers have access to a regular health strong or very strong
In the Montréal region, 150 deaths are 2016 2017 2018 2019 (January-June)
care provider than Quebecers or Canadians,
Note: significant differences between Montreal and all of Quebec or Canada are displayed in bold believed to have been attributable to drug
and they are far less likely to get a flu shot than and underlined. Source: https://sante-infobase.canada.ca/labo-de-donnees/surveillance-nationale-opioides-mortalite.
other Canadians are. or opioid use. html
20 Source: https://www150.statcan.gc.ca/n1/fr/catalogue/82-625-X. Taux de mortinatalité, de mortalité périnatale, néonatale et infantile, Québec et régions administratives, 2012-2016. Institut de la Statistique du Québec, 2012-2016
21
1 2
http://www.stat.gouv.qc.ca/statistiques/population-demographie/deces-mortalite/315.htm.Life expectancy Life expectancy as of 65 years of age
Life expectancy as of 65 years of age is Graph 3-3
slightly less in Montréal than in Toronto,
Vancouver or Calgary, for men as well as
women. Indeed, for 2014-2016, it was 22.8
years for women in Montréal, versus 24.9 24
24.9
24.4
23.8
years in Toronto, 23.2 years in Calgary and 22.1
22.8 22.9 23.2
24.4 years in Vancouver. For men, the gaps 20.7
21.3
20.5 20.5
21.4
were similar, as can be seen in graph 3-33. 18.7
19.6
Mental health Men Women Men Women Men Women Men Women
In 2012, 12.2% of Quebecers aged 15 or over Montréal Toronto Calgary Vancouver
experienced an episode of depression, a
slight drop from 2002 (14.6%). Women are Source: Statistique Canada, tableau 13-10-0063-01
overrepresented in this statistical category,
experiencing depression at a rate of 15.0%
versus 9.3% for men. Between 2002 and
2012, improvement was noted in all age Adjusted suicide rate, 2016
groups, except for young people between
15 and 24 years of age, for whom the rate Table 3-2
remained stable (12.6% to 12.7%). More
specific data exist that indicate that there Nunavik 113.1
is no correlation between a depressive
episode and income levels. Abitibi-Témiscamingue 20.4*
Gaspésie–Îles-de-la-Madeleine 18.1*
Anxiety disorders among high
Chaudières-Appalaches 16.2
school youth
The Quebec Health Survey of High School Mauricie et Centre-du-Québec 16.1
Students carried out in 2016-2017 found
Côte-Nord 15.4*
that in Montréal, diagnoses of anxiety
disorders, depression or eating disorders Saguenay–Lac-Saint-Jean 14.5
were up between 2010-2011 and 2016-2017
for all age groups in high school, having Nord-du-Québec 14.2**
gone from 12.3% to 16.4%. In 2016-2017,
12.2% of boys reported having been so Bas-Saint-Laurent 13.6*
diagnosed, compared to 20.5% of girls. Estrie 13.5
These rates remain lower than those noted
Terres-Cries-de-la-Baie-James 13.1*
for Québec as a whole (average of 19.5%,
13.8% for boys and 25.4% for girls). Outaouais 12.6
Laurentides 12.6
Suicides Capitale-Nationale 11.9
Among Québec regions, with the Lanaudière 10.9
notable exception of Nunavik, Abitibi-
Montérégie 10.9
Témiscamingue and Gaspésie-Îles-de-
la-Madeleine are the most impacted by Montréal 9.6
suicide. Montréal’s rate is slightly below the Laval 8.8
Quebec average, while Laval’s suicide rate
Whole of Quebec 12.1**
is the lowest in
the province. * Coefficient of variation greater than 16.6% and less than 33.3%. The value must be interpreted
Worth noting
with caution.
** Coefficient of variation greater than 33%, the value is presented for information only.
Montrealers’ health is good, but mental health issues and stress levels are
Source: https://www.inspq.qc.ca/sites/default/files/publications/2497_suicide_quebec.pdf cause for concern. Life expectancy is good, though in some cases less than
in other cities in Canada.
22 Source: Statistique Canada
23
34 Quality Education The administrative regions adjacent to Montréal show graduation rates that are slightly higher
than the Quebec average for public schools, with the exception of the Lanaudière region. The
Montérégie, which by itself is home to 11 school boards, posts widely varying results, with the
Ensure inclusive and quality education for all lowest graduation rate at 52.1% and the highest at 81.7%.
If we look at historical trends, graduation and qualification rates have gone up throughout
and promote lifelong learning Quebec over the last few years, including in Montréal. The following graph demonstrates this.
Rate of graduation and qualification after 5 years (in %)
Graph 4-31
2010 cohort 2011 cohort 2012 cohort 2013 cohort
Rate of graduation and qualification, 2013 cohort tracked The dropout rate remains
until 2017-2018 (5 years), in %
very high .
.
Graph 4-1 1
Male Female An educated population . . .
is the ultimate goal . .
.
.
. . .
.
88.9
. .
84.1 On the territory of the island of Montréal, 68.8% .
79.9 81
of students obtain their secondary school diploma
72.7 72.2
73.3 or qualification in five years, which is 0.6% higher
68.2 68.8 than in the Quebec education network as a whole.
c s
However, the rate is quite a bit lower in the Pointe- be ls ol
e oo ho
Qu h
60.9
60 de-l’Île (60.9 %) and Montréal school boards (60%). f sc sc
lo lic te
Al b iva
Graduation rates generally allow us to see what Pu Pr
s
proportion of students in Quebec, and elsewhere
ec ol
s ol e
ag s
e
ag s al rd rd s al n
eb ho oy d tre rd so d
u c ho sc gu tion gu tion on
tré
lB
oa
lB
oa ge ar on Boa ar ar in Canada, complete their studies in five years. To
fQ ics te lan titu lan titu M o o o ur l Bo M l . - Pe l Bo
lo bl iva ch s ish s ho ho B o - o r-B hoo
Al Pu Pr en in gl in le
Sc
al
Sc e- o
rit Sch
ish o
gl Sch ste Sc
do so, we track the number of third-year students
Fr En -l'Î ue En Le
tré
e -d
e
M
on
M
ar
g
who obtain their secondary school diploma two
int
Po years later. This rate is measured on a Quebec-
wide basis by the ministère de l’Éducation et de The other key indicator for Rate of departure from school without diploma or qualification, 2016-2017 (in %)
l’Enseignement supérieur (MÉES). The following measuring academic success
graph shows significant disparities across Quebec, is the rate of students leaving Graph 4-41
and within the territory of Montréal. secondary school without a
Graph 4-21
The data also show that fewer boys than girls diploma or a qualification. More
obtain their diploma within the five-year window. commonly referred to as the
Male Female 18.8
The rate for boys is 61.6% overall in the public «dropout rate», it corresponds 17.4
15.9 15.9
school network, and is higher in Montréal (64%). to the number of students 15.1 14.8
13.7 13.7
88.9
Again, we note that school boards for Pointe-de- having abandoned their 13.1 13.4
12.8
l’Île and Montréal school boards graduate fewer secondary studies in a given 10.9
79.9
than 6 adolescent boys out of 10 within 5 years year, without a diploma in hand.
72.7 72.2 It is in a sense the inverse of 6.2
71.3 71.2 Graduation rates are also available for the
68.2 68.8 68.4 the proportion of students (out
66.7 administrative regions that surround the island
of all students registered in
of Montréal. However, these results may include ec s ol
s ys al n
secondary school) who obtain eb ho
ol
ho ar
d
oa
rd eo rd re d rso rd
school boards that are not part of the Montréal u c sc l Bo B rg Boa nt oar Pea Boa
a diploma or a qualification, or fQ li cs te oo o ol u
Bo ol
o
-M ol
B . - l
lo iva ch ch e- o -B o
CMA. The following graphic shows graduation rates Al Pu
b r rit Sch ish o er ho
P eS lS gl Sch Lest Sc
pursue their studies. -l'Î
l
tré
a
g ue En
for these four administrative regions. de on ar
be
c
ol
s ls e e e- M M
oo ag s ag s nt
Qu
e
ch
o
sc
h gu tion gu tion The dropout rate is tracked Po
i
f
lic
s te lan titu lan titu
lo iva ch s ish s
Al Pu
b
Pr en in gl in province-wide, and by school
Fr En
board. Graphs 4-4 and 4-5
summarize the results for
Quebec in 2016-2017.
24 Source: Ministère de l’Éducation et de l’Enseignement supérieur
25
1Rate of departure from school without diploma or qualification, 2016-2017 (in %) According to the Montreal Hooked on School organization2, dropping out of school has other major impacts:
Graph 4-5
• 30% of dropouts do not participate in the labour market;
Male Female • Two out of three recipients of social assistance are dropouts;
• Dropouts are more likely to have health problems and have a life expectancy that is 7 years less than the average;
22.8 • 62% of individuals who go through the prison system are dropouts;
21.2
• The average employment income of a dropout is 31% lower than that of an individual with a secondary school diploma (DES);
• Females who drop out, though proportionately a smaller number, are especially disadvantaged when it comes to employment:
18.8
16.3 16.5
15.9
14.8 15.4 - Even fewer of them are employed than their male dropout counterparts (the gap is 22%);
13.3 12.8 - The salaries they earn are on average is 21% lower than those of male dropouts.
11.5 11.6
8.8
7.4
There are wide disparities when it comes to the highest level of schooling declared by Quebecers. In Quebec as a whole, 11.3% of residents
5.2
aged 25 to 64 have no diploma. The administrative regions of Montréal, Laval and the Montérégie do better than the Quebec average,
with rates of 7.7%, 9.9% and 10.9% respectively, whereas two other neighbouring regions, the Laurentians (12.1%) and Lanaudière (14.0%),
c ol
s
ol
s rd rd ys al n
post rates that are higher than the provincial average. While one resident out of two on the island of Montréal has obtained a certificate,
be ho ho oa oa eo rd tre rd rso rd
Qu
e c sc B B rg Boa on Boa ea oa
cs ol ol u
o l . -P ol B
diploma, or university degree, graduation rates remain below the Quebec average.
of bl
i te ho ho -B oo M
- o l B
r- ho
Al
l
Pu iva c Sc ite ch ish o ste Sc
Source: Ministère de l’Éducation et
Pr eS al er S gl Sch
l'Îl gu En Le
- tré ar
de l’Enseignement supérieur
de on
e- M M
i nt
Po
While there has certainly been progress, Quebec still lags behind the Canadian average, for both boys and girls.
The comparison is even more unfavourable to Quebec when it is measured against Ontario.
Highest level of education (Change from 2001 to 2016, in percentage points)
Graph 4-6
Rate of high school graduation or qualification obtained within a regular time frame,
2015-2016. Public and private school networks combined
Table 4-1 Rest of Quebec Greater Montréal
Total (%) Boys (%) Girls (%) Gap B-G (p.p.)
Canadian average .
79 75 83 8
No diploma
Newfoundland and Labrador 80 78 83 5 .
Prince Edward Island 78 74 82 8
New Brunswick 86 82 85 3
Quebec 74 68 80 12 Secondary school diploma
.
Ontario 81 77 85 8
Manitoba 82 79 85 6
Saskatchewan 78 76 81 5 .
Certificate or diploma from trade school
Alberta 77 75 79 4 .
British Columbia 79 77 81 4
Note: Nova Scotia data not available
Source: Statistics Canada Certificate of CEGEP studies (DEC)
.
Worth noting
Greater Montréal has more
It’s important to bear in mind that dropping out of school has not just social, but also economic ramifications. According to a study carried residents with diplomas
out in 2019 by Aviseo Conseil for the Chamber of Commerce of Metropolitan Montréal (CCMM), an individual who has completed their than it did 20 years ago.
secondary studies will earn, on average, $500,000 more over the course of their career than someone who has not completed them1. . Unfortunately, the dropout rate
Certificate, diploma, or university degree remains high.
.
Table 4-2 1
Loss of income for individuals Loss of tax revenues Impact on GDP
Men $432,300 $111,600 $982,600
Source: Statistique Canada, Recensements de la population de 2001 et 2016.
Women $492,500 $100,200 $1,119,400 Traitement: Communauté métropolitaine de Montréal (CMM), 2018.
26 Chambre de commerce du Montréal métropolitain (CCMM), Persévérance scolaire et conciliation études-travail: une piste de solution à la pénurie de main-d’œuvre, 2019: Réseau Réussite Montréal - https://www.reseaureussitemontreal.ca/perseverance-a-montreal/perseverance-et-decrochage/decrochage-scolaire/
27
1 2
https://www.ccmm.ca/fr/publications/etude/perseverance-scolaire-et-conciliation-etudes-travail---une-piste-de-solution-a-la-penurie-de-main-d-oeuvre/You can also read