Half Year Results FY 2021 - MAH ...

Page created by Bradley Torres
 
CONTINUE READING
Half Year Results FY 2021 - MAH ...
Half Year Results FY 2021
Half Year Results FY 2021 - MAH ...
Financial Highlights
                       1H21 Revenue                                               1H21 underlying EBITDA1                                              1H21 underlying EBIT(A)1

                   $652.5m                                                              $121.2m                                                                $46.5m
                       q 5% on 1H20                                                         p 6% on 1H20                                                        p 5% on 1H20

                  1H21 reported NPAT                                              1H21 operating cash flow2                                                       Order Book3

                     $44.8m                                                               $96.7m                                                                $4.2bn
                      p 56% on 1H20                                                         p 7% on 1H20

                  Net Tangible Assets                                                      ROACE / ROE4                                                   1H21 Interim Dividend

                   22.9 cps                                                   13.4% / 12.0%                                                                  0.30 cps
                       p 4% on FY20                                                                                                                            p 20% on 1H20

              FY21 Revenue Guidance5                                               FY21 EBIT(A) Guidance5                                                 FY21 Secured Revenue6

      $1.3bn – $1.4bn                                                        $90m – $100m                                                                        $1.3bn
1. Underlying numbers excludes total adjustments of $3.5m, refer to reconciliation on slide 29
2. OCF: Net operating cash flow excluding interest and tax and M&A costs
3. Pro forma as at 23 February 2021. Excludes civil, short term underground churn and JV revenue. Includes Batu Hijau revenue adjustment, Deflector and Warrawoona (preferred)
4. ROACE: Underlying EBIT(A) annualised / Average (Total Assets – Current Liabilities), ROE: Underlying NPAT (A) annualised / Average Equity
5. Guidance assumes an exchange rate of AUD:USD 0.75, and excludes one-off items and amortisation related to the GBF Group acquisition
6. FY21 secured revenue of $1.3bn (includes Deflector and excludes short term civil and underground churn work)

MACMAHON – Half Year Results to 31 December 2020                                                                                                                                  2
Half Year Results FY 2021 - MAH ...
1H21 Key Developments / FY21 Outlook
                                         •   Increased earnings and cashflow
                                         •   Effectively managed COVID-19 impacts
           Financials                    •   Solid balance sheet: gearing 20.0%, ND/EBITDA 0.5x, cash and available facilities of $255m
                                         •   Capital discipline: cash conversion 79.8% and ROACE 13.4%
                                         •   Interim dividend: 0.30 cents per share (20% franked)

                                         •   Record production volumes on key projects
                                         •   Awarded $250m contract for Foxleigh project – February start
       Surface Mining
                                         •   Appointed preferred for Calidus’ (ASX:CAI) Warrawoona $220m project
                                         •   TMM awarded civil contract at Strandline’s (ASX:STA) Coburn project

                                         •   GBF secured 4 year $220m contract extension for Silver Lake’s (ASX:SLR) Deflector mine
                                         •   GBF secured contract to construct and refurbish existing decline at the Bellevue (ASX:BGL) mine
   Underground Mining                    •   GBF awarded contract extension for Pantoro’s (ASX:PNR) Wagtail and Nicolsons mines
                                         •   Successfully ramped up at Tropicana Boston Shaker contract
                                         •   Safely completed winding and shaft engineering activities at Olympic Dam

                                         • FY21 guidance:
                                           ‒ Revenue $1.3 – $1.4bn (revised from $1.4 – $1.5bn, due to accounting treatment of certain
                                              revenue at Batu Hijau)
            Outlook                        ‒ EBIT(A) $90 – $100m (unchanged)
                                           ‒ FX assumption increased from 0.72 to 0.75
                                         • Pro forma order book of $4.2bn, including preferred Warrawoona contract of $220m
                                         • Over 20 tender opportunities worth $7bn, $3.8bn tenders currently submitted and under preparation

MACMAHON – Half Year Results to 31 December 2020                                                                                               3
Half Year Results FY 2021 - MAH ...
People, Safety & Sustainability
                  Injury Frequency Rates and Workforce
                                         7,040             7,059
                                                                              6,284
       5,649            5,572

                                                                              4.70

                                                                              0.13

        1H19            FY19             1H20              FY20               1H21

                                          TRIFR (Total Recordable Injury Frequency Rate)
        Contractors   Employees           LTIFR (Lost Time Injury Frequency Rate)

 • Safety and Wellbeing                                                                    • Recruitment campaigns for skilled workers
    ‒ Remains a core business priority                                                         ‒ Evident tightening in Western Australian labour market
    ‒ Strong Minds, Strong Mines award winning physical and mental                             ‒ Go for Gold (east coast to west coast)
      health program now offered to wider mining industry
                                                                                               ‒ Farmer Wants to Mine, Macmahon Maintenance Masters
    ‒ LTIFR: remains low and below industry benchmarks
                                                                                           • Grow our own Program
    ‒ TRIFR: leadership team implementing various action plans to
                                                                                               ‒ Apprentices: 79 (added 29 since June)
      address increasing trend
                                                                                               ‒ Graduates: 36 (added 11 since June)
 • COVID-19
    ‒ Various measures continue to protect our people and operations,                      •   Diversity
      with some disruption and incremental costs to manage                                     ‒ 6% of Australian workforce is Indigenous
 • Sustainability                                                                              ‒ 15% of Australian workforce is female
    ‒ Completed an ESG materiality assessment
                                                                                               ‒ Indonesia workforce, 99%+ Indonesian with focus on locals

MACMAHON – Half Year Results to 31 December 2020                                                                                                             4
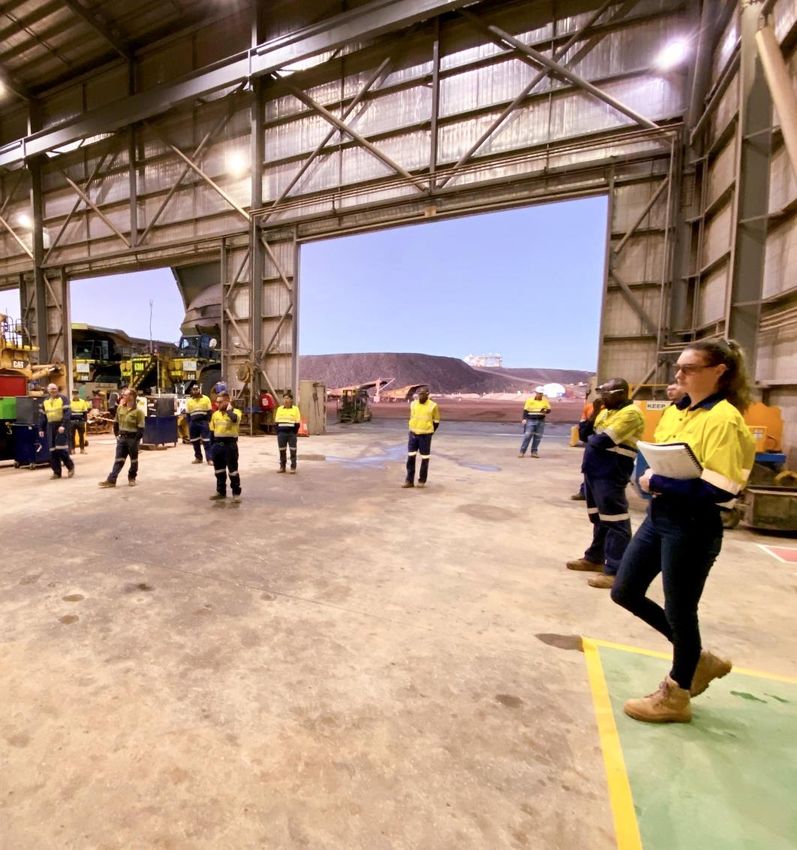
Half Year Results FY 2021 - MAH ...
Key Projects
                                                                                                     End (unless    Global
Project                                Clients     Location              Commodity     Type          extended)      Cost Curve1

Tropicana                                                                              Surface       2023
                                                   Western Australia,
                                                                         Gold
                                                   Australia
Boston Shaker                                                                          Underground   May 2024

                                                   Western Australia,
Telfer                                                                   Gold          Surface       Jan 2023
                                                   Australia

                                                   Western Australia,
Mount Morgans                                                            Gold          Surface       Dec 2022
                                                   Australia

                                                   Western Australia,
Mount Monger                                                             Gold          Underground   April 2023
                                                   Australia

                                                   Western Australia,
Deflector                                                                Gold          Underground   May 2025
                                                   Australia

                                                   Western Australia,
Bellevue Gold                                                            Gold          Underground   Est Aug 2021
                                                   Australia

                                                   Queensland,
Byerwen                                                                  Coking coal   Surface       Nov 2023
                                                   Australia

Batu Hijau                                         Sumbawa, Indonesia Copper/Gold      Surface       2031

Civil / Rehabilitation                 Various     Indonesia/Australia   Various       Surface

1. Minespans 2020 data by McKinsey

MACMAHON – Half Year Results to 31 December 2020                                                                                  5
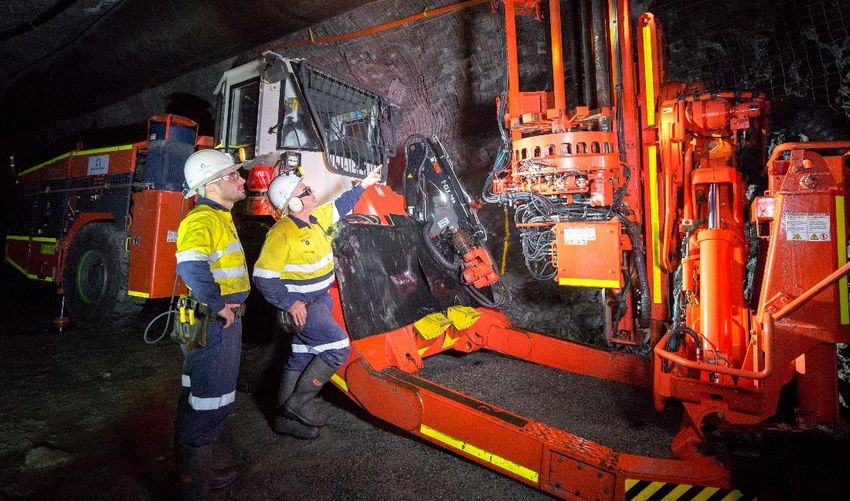
Half Year Results FY 2021 - MAH ...
Batu Hijau Project
Cornerstone project that underpins long term outlook
                                                                                 Sumbawa Island
• Macmahon has life of mine alliance contract for Batu Hijau                                                                     Map location
• Second largest copper-gold mine in Indonesia (behind Grasberg)
• Commenced in 2017, successfully executing Phase 7 cut back
                                                                                  Batu Hijau
Batu Hijau is a world class asset                                                              Elang
• First quartile of the global copper cost curve1
                                                                                About the client
• Reserve2 of 6.9bn lbs of copper and 8moz of gold
                                                                                • Batu Hijau is owned by AMNT, an Indonesian mining company
• Finalising significant cut back (Phase 8), expected to extend current
                                                                                  backed by prominent local investors including MedcoEnergi and
  in-pit mining by another 6 years from 2022 to 2028
                                                                                  Salim Group (large Indonesian conglomerate)
                                                                                • AMNT is a supportive 44.3% indirect shareholder of Macmahon
Elang - potential beyond Batu Hijau
                                                                                • Strategic investment aligns interests
• Large undeveloped copper-gold porphyry deposit
• Located 62 km east of Batu Hijau
• Expected to be developed after Batu Hijau Phase 8

                                                     Grades      Contained
                                        Total        Cu     Au     Cu     Au
JORC mineral resources2                  (mt)       (%)   (g/t) (blbs) (mozs)
Batu Hijau                                966      0.38   0.29    8.00   8.58
Elang                                   3,211      0.31   0.31 22.00 31.30

1.   GlobalData
2.   As at 31 December 2019

MACMAHON – Half Year Results to 31 December 2020                                                                                                  6
Half Year Results FY 2021 - MAH ...
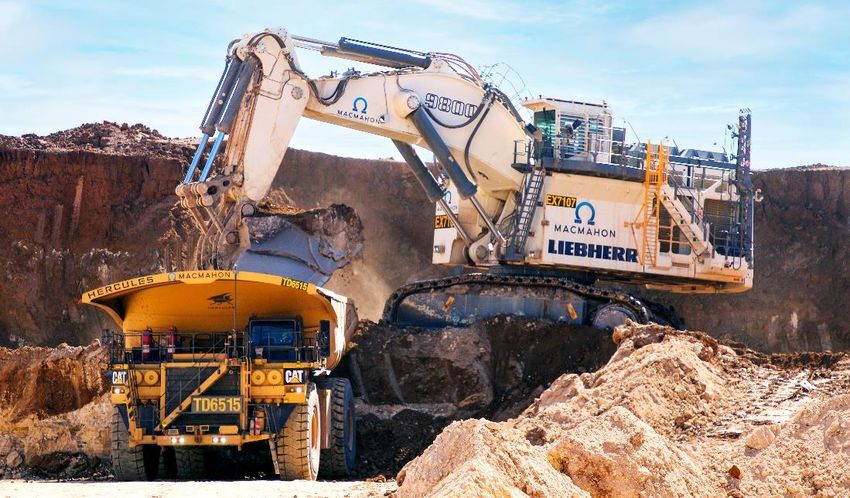
Deflector, WA (Silver Lake Resources)

1H21 Results
MACMAHON – Half Year Results to 31 December 2020                                 7
Half Year Results FY 2021 - MAH ...
Financial Performance
                                 Revenue ($m)                                                   Underlying EBIT(A) ($m)
 750                                                687     694              60
                                                                     653
                                                                                                                          48    47
                                           561                               50                                   44
                                542
                                                                                                   40
 500                 440                                                     40                            35
                                                                                          32
                                                                             30
          270
 250                                                                         20
                                                                                   10
                                                                             10

          1H18      2H18       1H19       2H19     1H20    2H20      1H21         1H18   2H18     1H19    2H19   1H20   2H20   1H21

                                                             EBITDA margin
                        Underlying EBITDA ($m)             18.0%    18.6%                      Underlying EBIT(A) Margin
                                                   16.6%                     8%                    7.4%
                                                            125      121                 7.2%                                  7.1%
 125                                                                                                                    6.9%
                                                    114                                                          6.4%
                                         16.5%                                                            6.3%
                              16.4%
 100                                       92                                6%
                   16.7%        89
                     73
  75    17.0%                                                                4%   3.6%
          46
  50
                                                                             2%
  25

                                                                             0%
         1H18       2H18       1H19       2H19     1H20    2H20      1H21         1H18   2H18      1H19   2H19   1H20   2H20   1H21

MACMAHON – Half Year Results to 31 December 2020                                                                                      8
Half Year Results FY 2021 - MAH ...
On track to deliver expected earnings
                                                                                                                   Updated
                                                                      Revenue ($m)                                Guidance
                                                                                                                 1,300–1,400
                   1,400                                                                     Guidance
                                                                                           1,300–1,400
                   1,200

                   1,000                                               Guidance
                                                                       950–1,050
                     800
                                                   Guidance                                              1,380
                     600                            620–680
                                                                                   1,103
                                                                                                                   1H21
                     400
                                                                710                                                 653
                     200              360

                                     FY17                      FY18                FY19                  FY20       FY21

                                                                                                                  Guidance
                                                              Underlying EBIT(A) ($m)                            unchanged
                                                                                                                   90–100
                     100
                                                                                            Guidance
                                                                                               85–95
                       80                                              Guidance
                                                                          70–80
                       60
                                                   Guidance
                                                      40–50
                                                                                                          92
                       40                                                           75                             1H21
                       20                                       42                                                  47

                                       -2
                      -20
                                      FY17                     FY18                FY19                  FY20      FY21

MACMAHON – Half Year Results to 31 December 2020                                                                               9
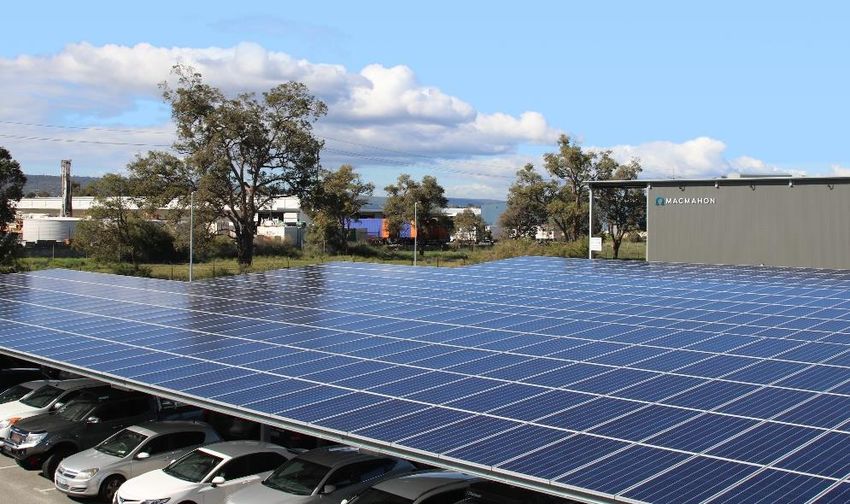
Half Year Results FY 2021 - MAH ...
Profit and Loss
$ Millions                               1H20              1H21            Change
                                                                                                • Revenue decreased by 5%
Revenue                                  686.7             652.5             q 5%
                                                                                                   ‒ Change in accounting treatment on certain client provided consumable
EBITDA1                                  114.0             121.2             p 6%
                                                                                                     items at Batu Hijau.
 EBITDA margin                          16.6%             18.6%
                                                                                                   ‒ Macmahon did not have control over the movement of tyres and lubricants
EBIT(A)1                                  44.1              46.5             p 5%                    due to COVID-19. Consistent with AASB 152, the Company has not
                                                                                                     recorded these consumables.
 EBIT(A) margin                          6.4%              7.1%
                                                                                                   ‒ As there is no margin associated with these consumable items, earnings
Net finance costs                        (7.6)              (6.2)
                                                                                                     have not been impacted.
PBT(A)1                                   36.5              40.3            p 10%
                                                                                                   ‒ Excluding this change, revenue grew approximately 3% across the
 PBT(A) margin                           5.3%              6.1%                                      remainder of the business.
Tax (expense)/benefit                    (5.0)               7.9                                • EBITDA and EBIT(A) growth of 6% and 5% respectively, driven by organic
- DTA recognition benefit                                   17.9                                  growth across the business.

NPAT(A)1                                  31.5              30.4             q 3%               • EBITDA and EBIT(A) margin improved to 18.6% and 7.1% respectively.
 NPAT(A) margin                          4.6%              4.6%
                                                                                                • Tax Benefit was attributable to recognition of a Deferred Tax Asset (DTA)
          1
EPS(A) (basic)                        1.50 cps           1.45 cps            q 4%                 of $17.9m due to change in Australian tax legislation, which allows a tax
                                                                                                  deduction for new Australian capex through to FY22. Over this period,
Reported NPAT                             28.7              44.8            p 56%
                                                                                                  effective tax rate expected to be ~30%, but effective cash tax rate expected
Reported EPS (basic)                  1.37 cps           2.13 cps           p 55%                 to be ~15%.

Dividends per share                   0.25 cps           0.30cps            p 20%               • Interim dividend increased to 0.30cps (20% franked).

1. Underlying earnings, refer to reconciliation on slide 29
2. Under AASB 15, if a customer contributes goods, to facilitate fulfilment of the contract, an assessment is required as to whether the Company obtains control of these contributed goods

MACMAHON – Half Year Results to 31 December 2020                                                                                                                                              10
1H21 Revenue Diversification
     Commodity                                                        Clients
                                                         5%
                                                                       AMNT                   9%
                                                   15%                                  7%           27%
                                                                       AngloGold
         Gold
                                                                       QCoal          11%
         Copper / Gold                                          53%
                                                                       Silver Lake
         Coking Coal
                                               27%                                    12%
                                                                       Newcrest
         Other                                                                                       20%
                                                                       Dacian                 14%

                                                                       Other

    Country                                               1%          Activity
                                                                                                3%

                                                                                        22%
                                                   27%
                                                                        Surface
      Australia
      Indonesia                                                         Underground
      Other
                                                                                                     75%
                                                               72%

MACMAHON – Half Year Results to 31 December 2020                                                           11
Cash Flow – Net Debt Waterfall

                                            -24.5

                                                             -15.8
                                                                             -3.1       -138.9
                            121.2                                                                                                                   $0
 $0                                                                                    Sustaining
                                                                                         -46.1

            -60.9
                                                                                       Extension
                                                                                        -137.9
                                                                                          -33.5
                                                                                                                                      -129.0
                           Operating Cash Flow
                                 $96.7m                                                 Growth
                                                                                         -59.3

                                     Net Operating Cash Flow $77.9m
                                                                                                      -7.4                  3.4
                                                                                                                  -3.0

        Net debt at 30     EBITDA       Working capital Interest and tax   M&A costs    Capex       Dividends   Software   Other   Net debt at 31
          Jun 2020                                                                                                                   Dec 2020

• EBITDA cash conversion of 79.8%, anticipating to achieve full year cash conversion target of 85%
• Excluding additional contract wins, FY21 capex expected to be $230m (from $175m):
  o $95m sustaining capex (unchanged)
  o $40m extension capex – for Mount Monger, Deflector, Nicolsons, Batu Hijau
  o $95m growth capex – for Foxleigh, Byerwen, Boston Shaker, Solomon, Bellevue

MACMAHON – Half Year Results to 31 December 2020                                                                                                         12
Balance Sheet
$ Millions                                              FY20                1H21
Cash                                                    141.8               148.4    • Solid balance sheet and liquidity position
Receivables                                             202.6               212.0      ‒ Gearing 20.0%
Inventories                                              57.3                58.6      ‒ Net Debt / EBITDA of 0.5x
Property, plant and equipment                           457.0               508.8      ‒ Cash and available banking facilities of $255m
Intangible assets and goodwill                           21.3                23.1
                                                                                     • Refinanced existing facility into new enhanced $170m facility
Other assets                                             42.9                51.4
Total assets                                            923.0              1,002.3     ‒ Maturity date extended by 2 years to July 2023
Payables                                                153.9               147.2      ‒ Competitive interest rate of sub 3% plus swap rate
Borrowings                                              202.7               277.4
                                                                                     • Borrowings comprise primarily of equipment lease facilities
Other liabilities                                        68.6                61.2
                                                                                       ‒ Equipment lease facilities $196.0m
Current liabilities                                     268.6               269.4
                                                                                       ‒ Bank finance $68.3m
Total liabilities                                       425.2               485.8
Total Equity                                            497.8               516.6      ‒ Property lease $13.1m

Net Debt1                                                60.9               129.0    • Solid ROACE of 13.4%, but impacted due to timing of new capex and
Net Tangible Assets (NTA)                             22.1 cps            22.9 cps     commencement of work – expect ROACE of 15% over long term
            2
Gearing                                                 10.9%               20.0%
                 3
                                                                                     • Balance sheet supports sustainable dividends and provides financial
ND/EBITDA                                                0.3x                0.5x      flexibility to enable continued execution of growth strategy
ROACE4                                                  14.8%               13.4%
       5
ROE                                                     14.6%               12.0%
1. Includes AASB 16 Leases
2. Net Debt / (Net Debt + Equity), Net debt includes AASB 16 Leases
3. Net Debt / Annualised underlying EBITDA
4. Underlying EBIT (A) annualised / Average (Total Assets – Current Liabilities )
5. Underlying NPAT (A) annualised / Average Equity

MACMAHON – Half Year Results to 31 December 2020                                                                                                             13
Capital Allocation Policy & 1H21 Dividend

                                         Policy adopted to balance growth and cash returns to shareholders

    Objectives                1. Maintain financial strength              2. Invest in growth             3. Return cash to shareholders

                           1. Maintain strong balance sheet
                           2. Ensure appropriate liquidity and gearing with regard to revenue visibility and outlook
     Priorities
                           3. Retain flexibility to fund tender pipeline and accretive acquisitions
                           4. Return cash to shareholders via dividends and/or share buyback

                           • Investment in growth
                              ‒ Capex $138.9m, sustaining capex $46.1m
                              ‒ FY21 capex guidance $230m: sustaining capex $95m; extension capex $40m; growth capex of $95m
   1H21 Capital
  Allocation and           • Returned to Shareholders
     Dividend
                              ‒ FY21 interim dividend of 0.30 cents per share (20% franked), represents 20.7% of underlying EPS
                              ‒ Record date 17 March 2021
                              ‒ Payment date 7 April 2021

MACMAHON – Half Year Results to 31 December 2020                                                                                           14
Byerwen, Queensland (QCoal)

Strategy and Outlook
MACMAHON – Half Year Results to 31 December 2020                      15
Key Strategic Priorities

                                                                    Mining Value Chain
                                                          Develop                 Open-Cut             Underground                                       Rehab
                                                            Civil /               Operations /           Operations /              Process
                                                                                                                                     Process           Operations /
                                                          Engineering             Engineering            Engineering                                   Engineering
           Explore                 Evaluate                                                                                         Process
                                                                           Plant & Maintenance                                                         Plant &
                                                                          Supply / Hire / Maintain                                                  Maintenance

                                                                   Key Strategic Focus
                               Execution and                                              People
  Safety                       Relationships                Technology                    and Culture                   New Work                 Diversification
  __________________           __________________           __________________            __________________            __________________       __________________

  • Continue focus on          • Enhance margins            • Integrate high              • Build proactive and         • Grow and diversify     • Mining related Civil
    improving safety             and execution                performing systems            positive culture              market share
                                                                                                                                                 • Underground
                               • Improve productivities     • Deliver value via                                         • Capitalise on $7.0bn
                                                                                                                                                 • Rehabilitation
                                                              tech enabled                                                tender pipeline
                                                              efficiency tools                                                                   • Engineering

MACMAHON – Half Year Results to 31 December 2020                                                                                                                          16
Sustainability - Completed materiality assessment
           Safety, Health and Wellbeing                                  Environment                  Social & Community involvement                             Governance

                                                                                                                                Medical supply donation:
                                        Safety performance                 Rehabilitation –              Sponsor of            The Perkins (raised $235k),      7 board members –
   New role of Environment                 LTIFR – 0.13                    FY20 completed               CME DETECT            SJOG Hospital, Ramsay Health         4 independent
     and Sustainability                    TRIFR – 4.70                     107 hectares                project ($25k)                    Care                      (incl. Chair)

Strong Minds, Strong Mines –      COVID-19 Response –                  FY20 GHG emissions –           QCoal Ca$hEdUp –                Regional and           Code of Conduct Policy –
   WAAMH Award, program         financial, accommodation,                (tonnes per CO2-e)            financial education             local sport           Anti-bribery and Corruption
      offered to industry    physical and mental health, EAP        Scope 1: 6,119 / Scope 2: 1,803      in regional QLD              sponsorships                   and Conflicts

                                                                                                                Indigenous Engagement:

                                           Grow our Own –                                                                                                    Modern Slavery Statement
    People development –               450 people in structured      Climate Change Statement-                                                                – to be published in March
 registered training organisation   training programs (graduates,       continual improvement          Jangga Aboriginal Trainee Program – with Qcoal         – Commenced awareness
              (RTO)                        apprenticeships,               in energy efficiency           EEO Recognition – QLD mining award 2020                 training across Group
                                             traineeships)

                                                                                                           Carey Mining
  New to Industry Training               Diversity Policy –          Solar panels at head office –                               Doorn-Djil Yoordaning –             Updated
                                                                                                          ‘Get Into Mining’
         Programs                      Indigenous – 6% (Aus)             expected to produce                                       Indigenous regional             Whistleblower
                                                                                                        Indigenous program
  – 25% Female participation            Female – 15% (Aus)                 650,000kWh pa                                               employment                     policy

MACMAHON – Half Year Results to 31 December 2020                                                                                                                                           17
Order Book1 $4.2 billion

  1,600
                  Order Book Run-off ($m)                                                                                 Order Book Movement ($m)
                                                                                     5,000

  1,400                          Plus:
                            Short-term work                                                       4,500
                                                                                     4,500                                                                                                  220
  1,200                                                                                                                                                                                                4,208
                                                  Plus:                                                                     322        4,170
  1,000                                      Short-term work                                                                                          No                      220
                                                                                     4,000                                                         earnings
                                                                                                                                                    impact       3,768
    800                                                                                                          653                                 401
                                                                                     3,500
    600

    400         1H21                                                                 3,000
                 653
    200

       0                                                                             2,500
                                                                                                June 20 Order    1H21     New Work   December 20    Batu Hijau   Adjusted    Deflector     Preferred 23 Feb 21 Pro
                 FY21             FY22              FY23            FY24+                           book        Revenue               Order book     (revenue  December 20               (Warrawoona) Forma Order
                                                                                                                                                   adjustment) Order book                                book
                            Preferred (Warrawoona)

• Secured $322m of new work in 1H21 including Foxleigh, Bellevue, Nicolsons, Strandline and Solomon
• Order book adjusted for removal of certain ‘pass-through’ consumables (Tyres and Lubricants) at Batu Hijau (no earnings impact)
• Order book of $4.2bn includes Deflector and Warrawoona (preferred contract)
• Excludes civil and underground short term work (FY20 $110m)
• Majority of order book is from:
  ‒ Gold and Copper/Gold mines
  ‒ Mines at bottom half of global cost curve
  ‒ Strategic Alliances – transparent, flexible approach driven by win-win outcomes
1. Pro forma as at 23 February 2021. Excludes civil, short term underground churn and JV revenue. Includes Batu Hijau revenue adjustment, Deflector and Warrawoona (preferred)

MACMAHON – Half Year Results to 31 December 2020                                                                                                                                                                18
Tender Pipeline $7 billion
                                           Expected Project
                                           Commencement                          12–18 Months                         2–3 Years

            Preferred /                                    Batu Hijau
            Extensions                                     Phase 81

               Tender

            Pre Tender

   Bubbles represent                = $200m                                                                      Current Client
                                                                                                    New Client
   contract value

• Well positioned to capitalise on additional growth opportunities
• Over 20 tender opportunities, majority Australian and gold projects
• $3.6bn of new client opportunities
• $1.2bn underground opportunities
• In addition to extensions, $2.2bn current submitted tenders and $1.6bn tenders under submission

1. Based on current accounting treatment of consumables (tyres and lubricants)

MACMAHON – Half Year Results to 31 December 2020                                                                                  19
FY21 Priorities and Outlook
FY21 priorities:
                                                                                                                                          Revenue Guidance
• Build on strong safety culture
                                                                                                                                                          $1.3–$1.4bn
• Effectively manage COVID-19
• Deliver FY21 contracted work
• Secure additional contract expansions / new work
                                                                                                                              $652.5m
• Enhance and diversify earnings in civil, underground, engineering
  and rehabilitation businesses
• Maintain disciplined management of capital
• Invest in mining technology and digital transformation
                                                                                                                                1H21                     FY21 Guidance
  FY21     guidance1:
  • Revenue of $1.3bn – $1.4bn                                                                                                             EBIT(A) Guidance
  • EBIT(A) of $90m–$100m                                                                                                                                     $90–$100m

       ‒ Based on AUD:USD of 0.75 vs 0.72 when
         guidance originally provided

Outlook supported by:                                                                                                          $46.5m

✓ Order book of $4.2bn
✓ Tender pipeline of $7bn
✓ Strong balance sheet
✓ Proven leadership team                                                                                                        1H21                     FY21 Guidance

1. Guidance assumes an exchange rate of AUD:USD 0.75, and excludes the impact of one-offs, and amortisation related to GBF Group acquisition.

MACMAHON – Half Year Results to 31 December 2020                                                                                                                          20
Thank You

Contact

Chris Chong
Investor Relations and Corporate Development
cchong@macmahon.com.au

Mick Finnegan
CEO & MD
mfinnegan@macmahon.com.au
                                                   Mount Monger, WA (Silver Lake Resources)

Peter Pollard
CFO
ppollard@macmahon.com.au

www.macmahon.com.au

                                                            Perth Head Office – Solar Panels

MACMAHON – Half Year Results to 31 December 2020                                               21
Batu Hijau, Indonesia (PT AMNT)   Boston Shaker, WA (AngloGold Ashanti / IGO)

                                                     Byerwen, Queensland (QCoal)                   Cancer 200: Ride for Research

Appendix
MACMAHON – Half Year Results to 31 December 2020                                                                        22
Corporate Overview
Capital Structure
                                                                        Share Price ($) – 3 years
Share Price1 (ASX:MAH)                                      $0.245
Fully paid ordinary shares (m)                               2,155     0.35
Market Capitalisation                                     $528.0m
Cash (31 December 20)                                     $148.4m      0.30
Debt (31 December 20)                                     $277.4m
Enterprise Value                                          $657.0m      0.25
Net Tangible Assets per share (31 December 20)              $0.229
                                                                       0.20
Directors
Eva Skira                           Independent Non-Executive Chair    0.15
Michael Finnegan                         CEO and Managing Director
Alex Ramlie                  Non-Independent Non-Executive Director    0.10
Arief Sidarto                Non-Independent Non-Executive Director       Feb-19                       Feb-20               Feb-21
Vyril Vella                      Independent Non-Executive Director
Bruce Munro                      Independent Non-Executive Director
Hamish Tyrwhitt                  Independent Non-Executive Director     Register – Top 20 account for 81%

Analyst Coverage
Argonaut                                                Ian Christie
CLSA                                                 Ben Brownette                                              18%
                                                                          Australian Funds
Euroz Hartleys                                        Trent Barnett                                                   30%
Moelis                                                Sean Kiriwan        Overseas Funds

Substantial Institutional Shareholders                                    PT AMNT
Paradice Investment Management                                6.5%
                                                                          Retail/Other                                8%

Index                                                      ASX300                                               44%

Liquidity – Daily Average Value                              $600k

1. As at 22 February 21

MACMAHON – Half Year Results to 31 December 2020                                                                                     23
ESG Materiality Assessment
• A sustainability materiality assessment                                      5.25
  conducted in December
                                                                                          Environment

• Contacted internal and external                                                         Social                                                              Corporate governance
  stakeholders (investors, brokers,                                              5
                                                                                                                                                                                                      Safety
  clients, suppliers)                                                                     Governance

• 15 material priorities identified                                                                                                                Climate Change
                                                                                                                                                                                         Health and wellbeing

                                                                               4.75
• Most common material topics were:                                                                                                                                             Business ethics and
                                                                                                                                                    Diversity and inclusion
  ‒ Corporate Governance                                                                                                                                                           transparency
  ‒ Safety                                                                                                                            Financial and operating
                                                                                                                                           performance                                    Workforce management
  ‒ Health and wellbeing
                                                   Influence on Stakeholders

                                                                                4.5
  ‒ Climate Change                                                                                                                       Risk management

• Current workplans are underway to                                                                                                                                       Environmental incidents,
                                                                                                                                                                          impacts and compliance
                                                                                                   Human rights and      Community partnerships
  address some material topic areas                                                                 modern slavery          and investment
                                                                               4.25
                                                                                                                                                        Indigenous engagement
Note: Business ethics and transparency
• Includes bribery and corruption                                                                                                 Land rehabilitation
                                                                                             Water management
                                                                                 4

                                                                                                           Waste management

                                                                               3.75

                                                                                3.5
                                                                                   3.25      3.5             3.75             4             4.25              4.5             4.75             5               5.25

                                                                                                                      Macmahon's Significant Impacts Scale

MACMAHON – Half Year Results to 31 December 2020                                                                                                                                                                  24
Map of Operations

MACMAHON – Half Year Results to 31 December 2020   25
Indonesia
Ranked 11 out of 89 countries                                              GDP current (US $bn) - Large growing economy

                                                                            1,200

                                                                            1,000

                                                                             800

                                                                             600

                                                                             400

                                                                             200

                                                                               -

                                                                                    1992

                                                                                    2011
                                                                                    1980
                                                                                    1981
                                                                                    1982
                                                                                    1983
                                                                                    1984
                                                                                    1985
                                                                                    1986
                                                                                    1987
                                                                                    1988
                                                                                    1989
                                                                                    1990
                                                                                    1991

                                                                                    1993
                                                                                    1994
                                                                                    1995
                                                                                    1996
                                                                                    1997
                                                                                    1998
                                                                                    1999
                                                                                    2000
                                                                                    2001
                                                                                    2002
                                                                                    2003
                                                                                    2004
                                                                                    2005
                                                                                    2006
                                                                                    2007
                                                                                    2008
                                                                                    2009
                                                                                    2010

                                                                                    2012
                                                                                    2013
                                                                                    2014
                                                                                    2015
                                                                                    2016
                                                                                    2017
                                                                                    2018
                                                                                    2019
Source: Resource Governance Institute 2017 RGI                             Source: World Bank

• Indonesia has a long successful mining history, including successful IPO of Nickel Mines (NIC:AU) – market cap $3bn
• Macmahon has successfully operated in Indonesia for many years
• Currently at Batu Hijau (since 2017) and Martabe (since 2015)

MACMAHON – Half Year Results to 31 December 2020                                                                          26
COVID-19
 Protecting our People, Community and Clients
 • Communication and education
 • Health screening and physical distancing protocols
 • Sanitation and cleaning
 • Travel restrictions

 Ensuring Business Continuity
 Australia
 • Relocation of some interstate workers
 • Employee assistance programs
 • Mental and Physical Health initiatives:
    ‒ Strong Minds, Strong Mines program implemented online
    ‒ Fatigue management program
 Indonesia
 • Batu Hijau:
    ‒ Accommodating workforce on Lombok for a two-week
      quarantine period before transferring to mine site on
      Sumbawa Island
    ‒ Face masks mandatory
    ‒ Stringent screening and frequent testing
    ‒ Site hospital: 160 beds including 40 ICU units

 Business performing in line with expectations
 • Remaining vigilant acknowledging COVID-19 environment
   continues to evolve and has potential to impact the business in
   the future

MACMAHON – Half Year Results to 31 December 2020                     27
Cash Flow
$ Millions                                                         1H20     1H21
EBITDA                                                             114.0    121.2
Movement in receivables                                            (8.8)    (12.2)
Movement in inventory                                              (2.9)     (1.3)
Movement in payables and provisions                                (13.0)   (11.5)
Other                                                               1.4      0.5
Net Interest and tax (paid) / received                             (11.2)   (15.8)
M&A costs and earn-out related to previous acquisitions            (1.3)     (3.1)
Net operating cash flow                                            78.2      77.8
Capital expenditure (cash)                                         (36.7)   (100.3)
Payment of software                                                (3.2)     (3.0)
Proceeds from sale of assets                                        0.9      3.9
Net (repayment)/proceeds of financial & lease liabilities          (8.7)     40.5
GBF acquisition (net of cash acquired)                             (18.9)    (1.8)
Dividends                                                          (10.5)    (7.4)
Other movements                                                      -       (0.1)
Net cash flow                                                       1.2      9.6
Operating cash flow1                                               90.7      96.7
EBITDA conversion                                                  79.5%    79.8%
Capex                                                              69.9     138.9
                     2
Free cash flow                                                     20.8     (42.2)

1. Net Operating cash flow excluding interest, tax and M&A costs
2. Operating cash flow less Capex

MACMAHON – Half Year Results to 31 December 2020                                      28
Reconciliation of
Non-IFRS Financial Information
$ Millions                                                                         1H20    1H21
Profit for the year (as reported)                                                  28.7    44.8
Add back:
• Share Based Payment expense                                                       1.3     0.2
• M&A costs and earn-out related to previous acquisitions                           1.3     3.1
• GBF customer amortisation (A)                                                     0.2     0.2
Less:
• Deferred Tax Asset (DTA) recognition benefit                                       -     (17.9)
Underlying Net profit after tax (NPAT)(A)                                          31.5    30.4
Add back: Tax expense / (benefit)                                                   5.0    (7.9)
Add back: DTA recognition benefit                                                    -     17.9
Underlying Profit before tax (PBT)(A)                                              36.5    40.3
Add back: Net finance costs                                                         7.6     6.2
Underlying earnings before interest and tax (EBIT)(A)                              44.1    46.5
Add back: Depreciation and amortisation expense (excluding GBF customer
                                                                                   69.9    74.7
amortisation)
Underlying earnings before interest, tax, depreciation and amortisation (EBITDA)   114.0   121.2
Weighted Average Number of Shares (m)                                              2,095   2,100
Underlying basic EPS(A) (cents)                                                    1.50    1.45

Columns may not add up due to rounding

MACMAHON – Half Year Results to 31 December 2020                                                    29
Important Notice and Disclaimer
Disclaimer as to forward looking statements              as to the accuracy or likelihood or fulfilment of any    The Guidance should not be regarded as a
                                                         forward looking statement, or any events or results      representation or warranty with respect to its
This presentation contains forward looking
                                                         expressed or implied in any forward looking              accuracy or the accuracy of the best estimate
statements, including statements of current intention,
                                                         statement, except to the extent required by law.         assumptions or that Macmahon will achieve,
statements of opinion and predictions as to possible
                                                         You are cautioned not to place undue reliance            or is likely to achieve, the particular results.
future events. These forward looking statements are
                                                         on any forward looking statement.
based on, among other things, Macmahon Holdings                                                                   This presentation does not take into account the
Limited's ACN 007 634 406 (Macmahon)                     The forward looking statements in this                   individual investment objectives, financial or tax
assumptions, expectations, estimates, objectives,        presentation reflect views held only as at               situation or particular needs of any person. It does
plans and intentions.                                    the date of this presentation.                           not contain financial advice. You should consider
                                                                                                                  seeking independent legal, financial and taxation
Forward looking statements are subject to inherent       The directors of Macmahon consider that they have
                                                                                                                  advice in relation to the contents of this presentation.
risks and uncertainties. Although Macmahon believes      used reasonable care in preparing forward looking
that the expectations reflected in any forward looking   financial information (Guidance) in this presentation.   Non-IFRS Financial Information
statement included in this presentation are              However, the Guidance is not fact, rather it is          This presentation uses non-IFRS financial
reasonable, no assurance can be given that such          predictive in character and there are margins of         information including EBITDA and EBIT which
expectations will prove to be correct. Actual events,    uncertainty surrounding any assumptions about            are used to measure both group and operational
results or outcomes may differ materially from the       future conditions and anticipated performance.           performance. Non-IFRS measures have
events, results or outcomes expressed or implied in      The Guidance may differ materially from results          not been subject to audit or review.
any forward looking statement.                           ultimately achieved and does not take into account
                                                                                                                  References to “Macmahon”, “the Company”, “the
                                                         the potential impact of some risks, such as the
Except as required by applicable law or the ASX                                                                   Group” or “the Macmahon Group” may be references
                                                         unquantified contingent liabilities noted in
Listing Rules, Macmahon does not undertake to                                                                     to Macmahon Holdings Limited or its subsidiaries.
                                                         Macmahon’s Annual Report. You are cautioned
update or revise these forward looking statements,
                                                         not to place undue reliance on the Guidance.             Not a disclosure document
nor any other statements whether written or oral, that
                                                         Forward looking information is by its very nature        This presentation is not a disclosure document and
may be made from time to time by or on behalf of
                                                         subject to uncertainties and can be affected by          should not be considered as investment advice or an
Macmahon, whether as a result of new information,
                                                         unexpected events, many of which are outside             offer or invitation to subscribe for or purchase any
future events or otherwise.
                                                         the control of Macmahon's directors. Any variation       securities in Macmahon, or an inducement to make
None of Macmahon (nor any of its officers and            to the assumptions on which the Guidance has             an offer or invitation with respect to such securities.
employees), or any other person named in this            been prepared could be materially positive or            This presentation does not purport to cover all
presentation, or any person involved in the              negative to actual financial performance.                relevant information about any potential investment
preparation of this presentation makes any               Therefore Macmahon's directors cannot                    in Macmahon or any decision relating to Macmahon.
representation or warranty (express or implied)          guarantee the achievement of the Guidance.

MACMAHON – Half Year Results to 31 December 2020                                                                                                                        30
You can also read