High planting density induces the expression of GA3 oxidase in leaves and GA mediated stem elongation in bioenergy sorghum
←
→
Page content transcription
If your browser does not render page correctly, please read the page content below
www.nature.com/scientificreports
OPEN High planting density induces
the expression of GA3‑oxidase
in leaves and GA mediated stem
elongation in bioenergy sorghum
Ka Man Jasmine Yu1, Brian McKinley1, William L. Rooney2 & John E. Mullet1*
The stems of bioenergy sorghum hybrids at harvest are > 4 m long, contain > 40 internodes and
account for ~ 80% of harvested biomass. In this study, bioenergy sorghum hybrids were grown at four
planting densities (~ 20,000 to 132,000 plants/ha) under field conditions for 60 days to investigate the
impact shading has on stem growth and biomass accumulation. Increased planting density induced
a > 2-fold increase in sorghum internode length and a ~ 22% decrease in stem diameter, a typical shade
avoidance response. Shade-induced internode elongation was due to an increase in cell length and
number of cells spanning the length of internodes. SbGA3ox2 (Sobic.003G045900), a gene encoding
the last step in GA biosynthesis, was expressed ~ 20-fold higher in leaf collar tissue of developing
phytomers in plants grown at high vs. low density. Application of GA3 to bioenergy sorghum increased
plant height, stem internode length, cell length and the number of cells spanning internodes. Prior
research showed that sorghum plants lacking phytochrome B, a key photoreceptor involved in shade
signaling, accumulated more GA1 and displayed shade avoidance phenotypes. These results are
consistent with the hypothesis that increasing planting density induces expression of GA3-oxidase in
leaf collar tissue, increasing synthesis of GA that stimulates internode elongation.
Agriculture provides food for direct human consumption, forage and feed for animals, and biomass for produc-
tion of biofuels and bioproducts. Current projections indicate that agricultural productivity will need to improve
by 75–100% by 2050 to meet the needs of the world’s increasing p opulation1–4. Increased productivity due to
the conversion of additional land for agricultural production, irrigation, high nitrogen fertilizer utilization
and genetic gains associated with the ‘green revolution’ are slowing and insufficient to meet projected needs5–7.
Moreover, increasing temperature and drought associated with climate change are expected to create additional
production challenges, especially for grain c rops8. Moreover, the increases in agricultural productivity need to
occur while reducing or eliminating agriculture’s greenhouse gas footprint, currently 23% of total greenhouse
gas emissions9.
Numerous bioenergy crops are under development including p oplar10,11, switchgrass12, sugarcane13–15,
16,17 18,19
Miscanthus , and bioenergy sorghum . These crops will be grown in different regions of production land-
scapes that are optimal for forests, perennial grasses, or annual grasses in order to maximize overall productivity,
resilience, and s ustainability20. Bioenergy sorghum hybrids are annual C4 grasses designed for deployment on
land environmentally and/or economically marginal for production of most food crops18,19. Bioenergy sorghum
produces biomass that can be used for forage or converted to biofuels and specialty bioproducts21,22. First genera-
tion bioenergy sorghum hybrids were ~ 4 m tall with the genetic potential to accumulate ~ 40 Mg of biomass per
hectare under good growing c onditions23,24. Bioenergy sorghum hybrids including sweet sorghum types have
good nitrogen use e fficiency25,26, broad a daptation27,28 and high GHG displacement metrics (75% for biomass
conversion to bioethanol; 90–95% for bioenergy)23.
Stems are the largest sinks for biomass in bioenergy sorghum accounting for ~ 80% of harvested b iomass23.
During bioenergy sorghum development, increases in radiation use efficiency (RUE) were associated with canopy
closure and the onset of rapid stem and internode e longation23. This suggested that increased sink strength due
to stem growth could contribute to biomass yield. Sorghum internode elongation is modulated by Dw1, a brassi-
nosteroid signaling p rotein29–31, Dw2, an AGCVIII k inase32, Dw3, an auxin efflux t ransporter33,34 and gibberellin
1
Department of Biochemistry and Biophysics, Texas A&M University, College Station, TX 77843‑2128,
USA. 2Department of Soil and Crop Sciences, Texas A&M University, College Station, TX 77843‑2128, USA. *email:
jmullet@tamu.edu
Scientific Reports | (2021) 11:46 | https://doi.org/10.1038/s41598-020-79975-8 1
Vol.:(0123456789)
www.nature.com/scientificreports/
(GA)35. Prior research in other plant systems showed that GA biosynthesis and signaling affects stem g rowth36,
cell elongation and cell division37. GA activates gene expression in part by interacting with and inducing the
turnover of DELLAs, repressors of GA modulated gene expression38.
The height of bioenergy sorghum plants and the length of stem internodes is increased by s hading39. Shad-
ing causes a reduction in the ratio of R:FR light that is detected by phytochromes, red-light photoreceptors that
mediate shade avoidance r esponses40–42. Sorghum genotypes that lack phytochrome B (phyB-1) express shade
avoidance phenotypes such as reduced tillering, early flowering, increased shoot growth, gibberellin accumula-
tion and increased ethylene b iosynthesis43–48. Shade induced stem elongation increases canopy height helping
plants outcompete neighboring plants for sunlight, reduces branching (tillering), and induces early onset of leaf
senescence, flowering and seed dormancy.
The biochemical basis of shade avoidance responses (SAR) and SAR-signaling pathways has been studied
extensively42,49–52. Phytochromes, cryptochromes, phototropins, and UV-B photoreceptors monitor the light envi-
ronment and mediate responses to nearby plants (proximity sensing) and canopy s hade53–56. PHYTOCHROME
B (PHYB) plays a key role in SAR-signaling by detecting variation in the ratio of red (R) and far-red (FR) l ight57.
Direct sunlight has a high ratio of R:FR, while light within canopies has a lower ratio of R:FR because red light
is absorbed by chlorophyll. Photoactivated PHYB (Pfr) enters the nucleus, interacts with PHYTOCHROME
INTERACTING FACTORS (PIFs) and mediates their degradation by E3 ligases and 26S proteases42,58. PIFs
are a family of bHLH transcription factors that act as the primary hub for signaling cascades that regulate cell
elongation59. PHYB in its inactive Pr state will not enter the nucleus, allowing the accumulation of PIFs, which
activate growth-promoting genes that contain E-box and G-box motifs, such as those involved in the biosynthesis
and transport of the plant hormones auxin, gibberellins, brassinosteroids, cytokinins and e thylene60–67.
Elevated biomass yield of bioenergy sorghum relative to grain sorghum is correlated with longer growing
seasons and increased plant height. In addition, bioenergy sorghum is typically grown at higher planting density
(~ 132,000 plants/ha)23 compared to grain crops such as maize (~ 40 to 80,000 plants/ha)68. High planting density
increases canopy shading, which is expected to induce bioenergy sorghum stem elongation as well as other shade
avoidance responses. In order to better understand the interaction among these factors, bioenergy sorghum was
grown in the field at four different planting densities and morphometric and biomass data was collected 60 days
after emergence (DAE). The results indicate that high planting density induces changes in stem growth and
morphology consistent with shade avoidance responses. The expression of GA 3-oxidase (GA3ox2) was increased
in the leaf base and leaf blade:leaf sheath (LB:LS) collars at high planting density indicating that leaf-derived GA
could play a key role in regulating internode elongation in bioenergy sorghum under field conditions.
Results
High planting density increases plant height and stem internode elongation. To analyze bio-
energy sorghum’s response to shading, the bioenergy sorghum hybrid TX08001 was planted in field plots with
0.76 m row spacing and plants within rows were thinned to a plant spacing of 1 m, 0.5 m, 0.25 m and 0.15 m
(~ 20,000 to 132,000 plants/ha). Planting density was maintained for the duration of the experiment by removal
of tillers. Plants were harvested at 60 DAE and plant height, stem and internode morphology, and stem and leaf
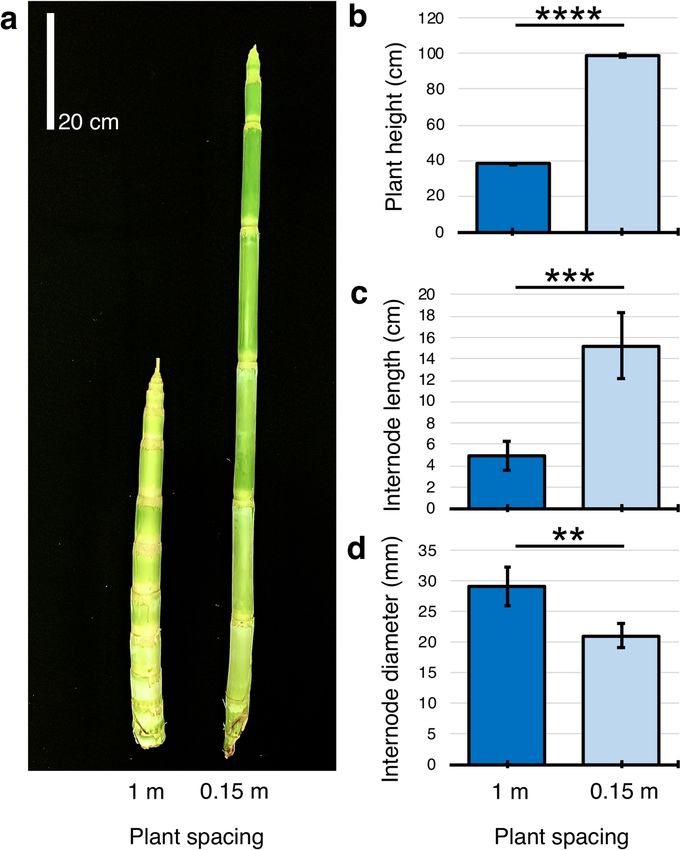
biomass were quantified (Fig. 1, see Supplementary Fig. S1). Plants grown at 0.15 m spacing (0.15 m) were signif-
icantly taller and had longer and thinner internodes compared to plants grown at 1 m spacing (1 m) (Fig. 1a–d).
However, planting density did not have a significant impact on total plant, leaf or stem dry weight, although the
dry weight of stems of plants grown at 0.15 m was somewhat higher compared to plants grown at lower planting
densities (see Supplementary Fig. S1).
The sorghum shoot apical meristem produces a phytomer comprised of a leaf blade, leaf sheath and subtend-
ing node-internode approximately every 3–4 days during the adult vegetative stage. In this study, phytomers were
numbered sequentially from the youngest, located just below the shoot apical meristem, to the oldest phytomer,
located near the base of the shoot. TX08001 plants grown at 1 m and 0.15 m contained ~ 9 visible internodes
associated with phytomers 4–12 at 60 DAE (Fig. 2). Phytomers are produced sequentially by the shoot apical
meristem during vegetative growth, therefore the youngest visible internode is associated with phytomer 4 located
near the top of the plant (Fig. 2a,b). The oldest internode (Internode 12) located near the base of the stem was
shorter than most of the internodes above it, except for the youngest non-elongated internodes located close
to the apex (Fig. 2a). Fully elongated internodes of plants grown at 0.15 m were longer than the corresponding
internodes of plants grown at 1 m (Fig. 2a). The difference in internode length increased as a function of when
elongation occurred during plant development. Internode 7 of plants grown at 0.15 m was ~ 3 times longer than
internode 7 of plants grown at 1 m. Internode 7 was the longest internode in plants grown at 0.15 m whereas
internodes 8/9 were the longest internodes of plants grown at 1 m. Internode diameters showed the opposite
response to planting density such that plants grown at high planting density (0.15 m) had smaller internode
diameters compared to low planting density (1 m) (Fig. 2b). The diameter of internode 12 at all planting densi-
ties was similar, but the diameter of internode 7 of plants grown at 0.15 m was ~ 22% smaller than plants grown
at 1 m (Fig. 2b). Overall, the volume of the stems of plants grown with 0.15 m was ~ 39% greater than plants
grown at 1 m at 60 DAE (see Supplementary Table S1). The leaves of phytomers 6–8 of plants grown at high
vs. low planting density showed relatively small differences in length and width (see Supplementary Table S2).
Taken together, bioenergy sorghum responds to higher planting density by 60 DAE, by increasing the length
and reducing the diameter of internodes.
Shade‑induced changes in cell length and number per internode. The differences in length of
internodes of plants grown at varying planting densities could be due to variation in the number of cells that
span the length of an internode, cell length or both factors. To investigate this question, plants were grown in a
Scientific Reports | (2021) 11:46 | https://doi.org/10.1038/s41598-020-79975-8 2
Vol:.(1234567890)www.nature.com/scientificreports/
Figure 1. Plant spacing alters sorghum stem growth and morphology. (a) Photograph of stems of bioenergy
sorghum plants grown for 60 days in the field at 1 m or 0.15 m spacing, (b) average height of plants grown at
1 m and 0.15 m spacing. Average length (c) and diameter (d) of elongated internodes of plants grown at 1 m or
0.15 m spacing. Asterisks indicate two-tailed P value; ****P < 0.0001, ***P = 0.0007, **P = 0.0019, by Welch’s t test
(n = 5). Error bars: SEM.
greenhouse at 1 m and 0.15 m for 60 days prior to analysis of the number and length of cells in a fully elongated
internode. Longitudinal sections that span the length of internode 7 were obtained and cell lengths and numbers
were quantified (Fig. 3). The analysis showed that there were ~ 28% more cells across the length of internode 7 in
plants growth at high density compared to low density (Fig. 3a). The analysis also showed that cells that comprise
internode 7 from plants grown 0.15 m were ~ 44% longer than cells from internode 7 of plants grown at 1 m spac-
ing (Fig. 3b). These results indicate that both cell elongation and cell proliferation contribute to the increase in
internode length observed at increased planting density.
Potential role of GA in shade‑induced stem elongation. Phytochrome B (phyB) is a key red light
photoreceptor involved in SAR-signaling45,57. The sorghum genotype 58 M encodes phyB-1, a non-functional
version of phyB45. When compared to near isogenic lines that encode PHYB (i.e., 100 M, 90 M, 80 M, 60 M),
58 M (phyB-1) exhibits phenotypes associated with shade avoidance including early flowering, elongated shoots,
reduced tillering and narrow leaves43. 58 M plants also accumulate 2–6 times higher levels of G
A46. Moreover,
treatment of 60 M or 80 M (PHYB) with GA induced the SAR-associated phenotypes observed in 58 M (phyB-
Scientific Reports | (2021) 11:46 | https://doi.org/10.1038/s41598-020-79975-8 3
Vol.:(0123456789)www.nature.com/scientificreports/
Figure 2. Plant spacing alters sorghum stem internode growth during development. Average internode lengths
(cm) (a) and diameters (mm) (b) of 9 phytomers of bioenergy sorghum grown at 1 m and 0.15 m spacing for
60 days (DAE) in the field. Phytomer 12 is located at the base of the stem. Asterisks indicate two-tail Welch’s t
test, ****P < 0.0001, ***P < 0.001, **P < 0.005, *P < 0.05, by one-way ANOVA (n = 5). Error bars: SEM.
1)44. Since phyB mediates many SAR responses, we hypothesized that increased shading of TX08001 in the field
could induce an increase in GA synthesis or signaling that results in increased stem elongation.
Most of the prior research on phyB signaling and GA biosynthesis in sorghum utilized genotypes that were
recessive for the stem dwarfing loci Dw2 and Dw3 that reduce internode lengths and most studies were conducted
at the seedling stage or post floral i nitiation44,46. Therefore, in the current study, the impact of GA on internode
elongation in the bioenergy hybrid R07020 (Dw1Dw1Dw2Dw2Dw3Dw3) was examined during the vegetative
phase by treating plants with GA3 or the GA biosynthesis inhibitor Paclobutrazol (PAC). GA (or PAC) was added
to the lower part of the stem, below phytomers that contain elongating internodes, to see if variation in GA would
alter internode growth. This was done by removing the leaf blade (LB) and leaf sheath (LS) of phytomer 7, a
phytomer located just below the internode growing zone, and applying GA3 or PAC in lanolin to the excised LS
where it joins the stem. Plants were then grown for an additional 14 days before analysis of stem and internode
lengths (Fig. 4a,b). Removal of the LS had minimal impact on stem length (see Supplementary Fig. S2), however,
addition of 1% GA3 greatly stimulated stem growth (Fig. 4a). Four to five additional phytomers were formed
during the GA3 or PAC treatments, therefore at harvest, phytomer 12 corresponds to the phytomer treated with
GA3 or PAC at the start of the experiment (Fig. 4b, downward arrow). The length of the internode associated
with phytomer 12 was not altered by GA3 or PAC treatment because the internode was fully elongated at the
start of the treatment. At the end of the treatment, phytomers 7–10 contained internodes that had reached full
elongation during the treatment and phytomers 4–6 contained internodes that were still in various stages of
elongation (Fig. 4b). GA3 treatment had minimal impact on the length of the internode in phytomer 11, caused
a small increase in the length of internode 10, and had an increasingly large impact on the lengths of internodes
9, 8 and 7 (Fig. 4b). At the start of the GA3 treatment, internode 10 was nearly fully expanded, whereas internode
7 was just beginning to start elongation, explaining why GA3 treatment had a greater impact on the growth
of internode 7. In the control, rapid internode growth begins between phytomer 4 and 5, and is completed in
phytomer 7, a developmental window spanning approximately 9 days. In GA3 treated plants, internode growth
Scientific Reports | (2021) 11:46 | https://doi.org/10.1038/s41598-020-79975-8 4
Vol:.(1234567890)www.nature.com/scientificreports/
Figure 3. Plant spacing affects the number and length of cells in sorghum internodes. (a) The average number
of cells spanning fully elongated internodes of phytomer 7 and (b) average length of cells in phytomer 7 of plants
grown at 1 m and 0.15 m spacing. Asterisks indicate two-tailed P value, ****P < 0.0001, by Welch’s t test [n = 96
(1 m), n = 84 (0.15 m)]. Error bars: SEM.
begins between phytomer 3 and 4 and is completed in phytomer 6, also approximately 9 days. This indicates that
GA3 treatment increased the extent of internode elongation, but not the duration of the elongation process. The
appearance of an additional internode in GA-treated plants could indicate that the rate of phytomer production
was increased by GA3 treatment, consistent with prior studies showing that GA3 modifies expression of genes
that regulate plastochron/phyllochron69,70. Addition of 1% PAC to the node (or to upper leaves by foliar spray-
ing, see Supplementary Fig. S3) reduced internode lengths in phytomers 5–9 and reduced the number of visible
internodes above the site of application by one (Fig. 4b). The number and length of cells located in internodes
of phytomer 7 were measured following removal of the leaf sheath (Control), treatment with PAC (+PAC) or
GA3 (+GA) (Fig. 4c–e). The length of internode cells was increased by GA3 treatment and decreased by PAC
(Fig. 4d). The number of cells spanning the length of the internode was also increased by treatment with GA,
compared to control and treatment with PAC. These results indicate that modification of GA levels can alter the
length of bioenergy sorghum internodes by altering cell lengths and the number of cells spanning internodes,
similar to shading.
Shade‑induced expression of GA3‑oxidase. Shade-induced internode elongation could be due to an
increase in GA biosynthesis, GA-signaling, and/or other factors. Variation in GA biosynthesis is often corre-
lated with the expression of genes encoding GA3ox the final step in the GA biosynthetic pathway64,69. Two sor-
ghum genes annotated as encoding GA3ox have been identified; Sobic.009G064700 (SbGA3ox1), a homolog
of OsGA3ox1, and Sobic.003G045900 (SbGA3ox2), a homolog of OsGA3ox2 and ZmGA3ox269,71. In maize,
ZmGA3ox1 is expressed at very low levels except in tassels71. Analysis of RNA-seq data from BTx623 tissues72
showed that SbGA3ox1 was expressed at very low levels in all tissues and developmental stages represented in the
sorghum transcriptome compendium including stems (see Supplementary Table S3). In rice, OsGA3ox2 is more
Scientific Reports | (2021) 11:46 | https://doi.org/10.1038/s41598-020-79975-8 5
Vol.:(0123456789)www.nature.com/scientificreports/
Figure 4. GA3 alters sorghum internode length, cell length and number. (a) Photograph of sorghum stems
from control plants 14 days after removal of the leaf sheath (LS) from phytomer 7 (− LS) and plants treated
with GA3 after LS removal (− LS, 1% GA3) (right). (b) Average length of internodes of control (blue line), and
plants treated with 1% GA3 (green line), 1% PAC (red line) or both compounds (yellow line). Site of LS removal
and GA3/PAC application is marked (solid inverted triangle). (c) Micrographs of longitudinal sections from
the middle section of fully elongated internode from phytomer 7 (solid star) stained for cellulose. (d) Average
length of cells and (e) average number of cells spanning the length of internode 7 following 14 days of treatment.
One-way ANOVA, followed by Tukey comparison test, indicated significant differences between control, + PAC
and + GA conditions with P < 0.0001 (n = 291). Different letters indicate significance. Error bars: SEM.
highly expressed in young leaves69 and in maize, ZmGA3ox2 is expressed at low and varying levels in several
organs and tissues71. SbGA3ox2 was expressed at relatively low levels in tissues of the sorghum transcriptome
compendium except dry and germinating seeds where expression was elevated (see Supplementary Table S3).
The sorghum transcriptome compendium contains RNA from vegetative and reproductive tissues, but the
compendium does not contain RNA-seq profiles comparing shaded to non-shaded plants. Therefore, qRT-PCR
was used to conduct a systematic analysis of SbGA3ox2 expression in the shoot apex, leaf blade (LB), leaf sheath
(LS), and stem tissues that comprise phytomer 3 (prior to internode elongation) through phytomer 8 (fully elon-
gated internodes) of vegetative plants grown at high and low planting density. Leaf tissue samples were collected
from the mid-point of the leaf blade (LB center), the growing zone located at the base of the leaf blade (LB base),
and the LB:LS collar tissue (see Supplementary Fig. S4). Tissues were also collected from the middle of the leaf
sheath (LS center), leaf sheath base growing zone (LS base), LS: stem collar tissue (LS collar) (see Supplementary
Fig. S4). Stem tissues collected included the nodal plexus, a stem nodal tissue where the leaf sheath joins the stem,
internodes, and the pulvinus, a tissue located between the internode growing zone and the nodal plane73 (see
Supplementary Fig. S4). Relative expression of SbGA3ox2 in these tissues was quantified using qRT-PCR (Fig. 5).
At 0.15 m spacing (high planting density), SbGA3ox2 expression was highest in the LB base and/or LB:LS collar
of each phytomer, followed by tissues in the middle of the leaf blade (Fig. 5a, LB center). SbGA3ox2 expression
in the LB:LS collar was higher in phytomers 3–5 that contain elongating internodes compared to phytomers 7–8
that contain fully elongated internodes. Plants growing at 1 m spacing (low planting density) showed expression
of SbGA3ox2 in the LB center, LB base, and LB:LS collar tissues, with somewhat higher expression in phytom-
ers 5–8 (Fig. 5b). In addition, expression of SbGA3ox2 was low in stems of phytomers 3–6, however expression
increased in the stem nodal plexus of phytomers 7–8 that contain fully elongated internodes.
Differential expression of SbGA3ox2 in leaf and stem tissues of plants grown at high planting density vs. low
planting density is shown in Fig. 6. This analysis showed that SbGA3ox2 is expressed at much higher levels in
the LB base of phytomers 3–4 and LB:LS collar tissues of phytomers 5–6 in plants grown at high planting density
compared to low planting density (Fig. 6a). In contrast, expression of SbGA3ox2 in stem nodal plexus tissue of
phytomers 7–8 was not higher in plants grown at high density compared to low density (Fig. 6b). SbGA20ox1
expression was also higher in the LB:LS collar and nodal plexus of phytomer 5 in plants grown at high plant-
ing vs. low planting density whereas minimal differences in expression were observed in the LB, LS and stem
internode (Supplemental Figure S5).
Discussion
The stems of bioenergy sorghum at the end of the growing season are typically > 4 m long, comprised of > 40
internodes, and account for ~ 80% of harvested biomass23. Long stems are correlated with high biomass yield,
however, tall plant stature and long thin internodes can also increase susceptibility to lodging74–76. Adaptation
of maize hybrids to increased planting densities (from 30,000 to 80,000 plants/ha) was a major contributor to
increased grain yield per hectare68. Bioenergy sorghum is grown at planting densities (~ 132,000 plants/ha) that
Scientific Reports | (2021) 11:46 | https://doi.org/10.1038/s41598-020-79975-8 6
Vol:.(1234567890)www.nature.com/scientificreports/
Figure 5. Relative expression of SbGA3ox2 in sorghum grown at 0.15 m (a) and 1 m (b) spacing. Tissues
were collected from the shoot apex (Apex), mid leaf blade (LB center), base of the leaf blade (LB base), tissue
between the leaf blade and leaf sheath (LB:LS collar), mid leaf sheath (LS center), base of the leaf sheath (LS
base), leaf sheath collar (LS collar), stem nodal plexus, internode, and pulvinus of phytomers (Phy) 3–8. Relative
expression is shown in bar graphs (leaf blade = green, leaf sheath = blue, stem = brown). Expression values are the
average of three biological replicates. Error bars: SEM. Photograph and diagram of the development of sorghum
phytomer tissues is shown in Supplementary Figure S4.
are higher than optimal for corn68. Adaptation of bioenergy sorghum to high planting densities may be needed
to optimize biomass yield, composition and standability. Therefore, the current study focused on understanding
how variation in planting density affects stem growth and morphology.
The results showed that increasing planting density from ~ 20,000 to ~ 132,000 plants/ha in the field resulted
in a ~ 2 to 3-fold increase in stem internode length, a ~ 22% decrease in stem internode diameter, and an overall
increase in stem volume of ~ 39% by 60 DAE. The greater length of internodes in plants grown at high density
could be accounted for by increases in cell length and the number of cells that span the length of internodes.
The planting density induced change in internode morphology occurred without a large impact on total plant
biomass accumulation or biomass allocation between leaves and stems, indicating that this initial response to
shading primarily alters the morphology of the stem, elevates the canopy and creates greater spacing between
leaves. Canopy closure at the highest planting density used in this and previous studies occurs between 60 and
90 DAE therefore proximity sensing of reflected FR light and partial direct shading are probably mediating the
observed SAR-induced internode elongation. Increased stem volume at high planting density could benefit bio-
energy sorghums that accumulate high levels of stem sucrose (~ 0.5 M)77. In addition, plant height and biomass
accumulation in bioenergy sorghum panels are correlated when measured after the juvenile phase when stem
elongation is r apid78. This predicts that longer stems in all types of bioenergy sorghum could potentially improve
biomass yield over the course of the growing season even though the initial increase in stem elongation observed
here had only limited impact on biomass accumulation. On the other hand, larger stems increase respiratory load
and longer and thinner stems could increase the propensity for lodging later in the season. Therefore, identifying
Scientific Reports | (2021) 11:46 | https://doi.org/10.1038/s41598-020-79975-8 7
Vol.:(0123456789)www.nature.com/scientificreports/
Figure 6. GA3ox2 is differentially expressed at high vs. low plant spacing. (a) Differential expression of
SbGA3ox2 in the leaf blade (LB) and leaf blade/leaf sheath collar tissue (LB:LS collar) of phytomers 3–8 of plants
grown at 0.15 m spacing (high density) and 1 m spacing (low density). (b) Differential expression of SbGA3ox2
in the stem apex, nodal plexus, internode and pulvinus of plants grown at 0.15 m and 1 m spacing. Expression
values are the average of three biological replicates. Differences in expression were analyzed by one-way ANOVA
followed by Tukey comparison test. ****P < 0.0001, **P < 0.005. Error bars: SEM.
and deploying an optimal stem size and morphology is an important long-term goal that could be aided by an
understanding of the molecular mechanism that regulates elongation in response to shading.
PHYB is a red light photoreceptor that plays an important role in shade avoidance signaling53–56. The sorghum
genotype 58 M (phyB-1) lacks phytochrome B, exhibits numerous shade avoidance phenotypes and accumulates
higher levels of GA1 in leaves compared to near isogenic genotypes that express phyB44–46. Treatment of sorghum
genotypes, that encode phyB, with GA induced the shade avoidance phenotypes observed in 58 M44. This led
previous investigators to propose that reduced phyB signaling associated with shading causes an increase in GA
that contributes to the observed SAR-phenotypes43. The previous studies also showed that GA1 is the predomi-
nant GA that accumulates in sorghum, but the investigators were not able to determine how shade and/or phyB
signaling alters GA levels.
Since GA3 oxidase is the last step in the GA biosynthetic pathway leading to the formation of GA1 and GA379
and GA3ox expression is often correlated with GA biosynthesis and accumulation, we investigated how variation
in planting density affects the expression of sorghum genes that encode GA3-oxidase in bioenergy sorghum.
Rice, maize and sorghum encode two genes for GA3ox69,71. In rice and maize, GA3ox2 is expressed at low levels
in most tissues, with higher expression in young elongating leaves of r ice69. In growing maize leaves, expression
of ZmGA3ox2 is correlated with GA1 accumulation in the leaf base although other factors such as GA2-oxidase
also shape the distribution of GA1 across the growing zone80. In maize, mutation of ZmGA3ox2 reduced GA1
levels and caused stem dwarfing71. Ectopic overexpression of GA20-OXIDASE1 (GA20-OX1) in maize increased
GA levels and produced plants with longer but thinner stems similar to sorghum grown at high vs. low d ensity81.
This indicates that variation in expression of GA20-OX1 could also cause changes in GA levels during develop-
ment or in response to environmental variation that alters C4 grass morphology and biomass c omposition81.
In the current study, qRT-PCR was used to characterize SbGA3ox2 expression in leaf and stem tissues col-
lected from bioenergy sorghum plants growing at low and high planting densities. Sorghum GA3ox2 expres-
sion was quantified in leaf tissues derived from the LB center, LB base (leaf growing zone in phytomers 3–4),
and LB:LS collar tissue that spans the ligule in sorghum and m aize82. It should be noted that delineation of the
LB base and LB:LS collar tissue in phytomers 3–4 was not possible, therefore in these phytomers both tissues
were combined in the leaf base sample (LB-base/collar tissue). The analysis showed that in plants growing at
low density, expression of SbGA3ox2 was higher in the LB center, LB base and LB:LS collar tissues compared
to the shoot apex and stem tissues of most phytomers. Expression of SbGA3ox2 in leaf tissues increased during
development from a low level in phytomers 3–4 that contain elongating leaves and short internodes to higher
levels in leaves of phytomers 5–8 which contain full length leaves, elongating internodes (phytomers 5–7) and
elongated internodes (phytomer 8). Elevated SbGA3ox2 expression in leaves was also observed in plants grown
Scientific Reports | (2021) 11:46 | https://doi.org/10.1038/s41598-020-79975-8 8
Vol:.(1234567890)www.nature.com/scientificreports/
at high planting density although expression was higher in leaves of phytomers 3–5 compared to phytomers
7–8. More significantly, SbGA3ox2 expression was > 20-fold higher in the LB-base/collar tissue of phytomers
3–4 and LB:LS collar tissue of phytomers 4–8 in plants grown at high density compared to plants grown at low
density. Increased expression of SbGA3ox2 in LB-base/collar tissue and LB:LS collar tissue of phytomers 3–5 in
plants growing at high planting density is correlated with earlier onset of internode elongation and a ~ 2 to 3-fold
increase in internode elongation compared to low planting density.
The results are consistent with the hypothesis that shading increases expression of SbGA3ox2 in LB:LS collar
tissue and this results in increased production of GA that moves to the stem where it stimulates internode growth.
LB:LS collar derived GA could move from the LB:LS collar through the leaf sheath, most likely via vascular
bundles, and enter the stem at the nodal plexus. GA entering the nodal plexus could move downwards to the
internode zone of elongation in the same phytomer and/or upwards into and through the intercalary meristem
of the phytomer above the nodal plexus. Application of GA to the nodal plexus (or excised LB:LS collars) stimu-
lated internode elongation by increasing cell length and cell proliferation similar to shade-induced internode
elongation. This hypothesis is consistent with studies showing that tobacco leaves are an important source of
GA for stem growth83 and that mutation of ZmGA3ox2 causes stem dwarfing in maize71. While GA plays a role
in shade-induced stem elongation, it is likely that other hormones such as auxin and brassinosteroids are also
involved in this response, as in other p lants42,55,56,60,84,85.
SbGA3ox2 expression also increased later in development in the nodal plexus of phytomer 8 although expres-
sion was not induced by higher planting density. Phytomer 8 and older phytomers that contain fully elongated
internodes continue to express genes involved in secondary cell wall formation77. In tobacco, it has been shown
that leaves are sources of GA for stem secondary growth and fiber differentiation83. While grasses lack secondary
growth characteristic of trees, increased expression of SbGA3ox2 in the nodal plexus of older internodes may
influence secondary cell wall formation that increases the strength and biomass of older internodes.
Additional research will be needed to determine if phyB-signaling modifies SbGA3ox2 expression and GA
levels in tissues of plants exposed to variation in shading. It will also be important to characterize the cell spe-
cific localization of SbGA3ox2 in the LB:LS collar and to further analyze GA transport from the LB:LS collar
to the stem and within the stem. Recent research has identified mechanisms involved in active GA transport86
and showed that GA is transported in the endodermis of the r oot87,88. Transport of GA from the LB:LS collar to
growing internodes could occur through the endodermis of LS and stem vascular b undles87,89. In addition, GA
distribution in organs and tissues is shaped by enzymes such as GA 2-oxidases that mediate GA turnover and
GA 20-oxidases that provide precursors for GA 3-oxidases90. GA 2-oxidase expression has been documented in
the preligule tissue of maize91 and at the transition zone of cell elongation in maize leaf blades80. In sorghum,
several GA 2-oxidases are induced in internodes that are exiting the zone of internode elongation suggesting
depletion of GA by these enzymes may help regulate the developmental progression of internode e longation92.
Methods
Plant growth and field conditions. The bioenergy sorghum hybrid TX08001 was planted in a 16
row × 100 m plot in the PIVET field site at the Texas A&M University Field Station in College Station, Texas (30°
37′ 40″ N, 96° 20′ 3″ W, 100 m above sea level). Plots were planted on May 2, 2017 and emerged on May 9, 2017.
Plants with a row spacing of 0.76 m within 4 blocks (16 rows × 10 m) were thinned to 4 different planting densi-
ties with 1 m, 0.5 m, 0.25 m and 0.15 m spacing between each plant.
To reduce border effects, all plants were harvested from inner rows of a planting block. Five plants were
selected from random locations in each planting density block 60 DAE. Plants were harvested, measured, imaged
and weighed. Measurements of individual internode lengths, leaf width and leaf length were obtained using
measuring tape. Internode diameters were measured using a Carbon Fiber Composites Digital Caliper, to the
nearest millimeter. Harvested stem images were acquired using a 12-megapixel iSight camera. Internode, leaf
and leaf sheath and root were weighed for fresh weight (FW) and then bagged individually, dried in an oven at
70 °C for three days before collecting dry weight (DW) data. The calculation of total dry weight per square meter
of land was based on plant spacing within plots.
For GA3 and PAC treatments, R07002 plants were grown in a greenhouse under 14-h long days in 5 gal-
lon SmartPots (High Caliper Growing) with Oldcastle Jolly Gardener C/25 Growing Mix (Oldcastle Lawn and
Garden) fertilized every 60 days with 1 tbsp Osmocote 14–14-14. Plants were thinned to one plant per pot and
grown at 0.15 m spacing.
For microscopic imaging, TX08001 plants were grown in a greenhouse under 14-h long days in 5 gallon
SmartPots (High Caliper Growing) with Oldcastle Jolly Gardener C/25 Growing Mix (Oldcastle Lawn and
Garden) fertilized every 60 days with 1 tbsp Osmocote 14-14-14. Plants were thinned to one plant per pot and
grown at 0.15 m spacing or 1 m spacing.
Seeds were obtained from the Texas A&M Sorghum Breeding Program (College Station, TX).
GA and PAC treatments. R07020 plants were treated with 1% GA3 (MW = 346.4 g/mol) (SIGMA-
ALDRICH G7645-1G), 1% PAC (MW = 293.7 g/mol) or an equal mixture of GA3 and PAC in lanolin at 60 DAE.
The plants were treated with the lanolin mixtures at the stem nodal plexus of phytomer 7, after removing the
leaf sheath and leaf blade of phytomer 7. The 1% GA3 mixture was made by dissolving 0.93 g of GA3 into 1 mL
of 100% ethanol and performing a dilution (100 μL of dissolved into 900 μL of ethanol) to achieve a concentra-
tion of 0.093 g/mL. Then, 100 μL of the 0.093 g/mL dissolved GA3 was added to 1 mL of melted lanolin in a hot
water bath for a final concentration of 0.0093 g/mL (~ 0.027 M). The mixture was then inverted multiple times
to ensure the contents were mixed before the lanolin solidified. The same procedure was use to prepare PAC
Scientific Reports | (2021) 11:46 | https://doi.org/10.1038/s41598-020-79975-8 9
Vol.:(0123456789)www.nature.com/scientificreports/
dissolved in DMSO, for a final concentration of 0.0093 g/mL (~ 0.032 M). The GA3 and PAC mixture was cre-
ated by mixing 0.93 g each of GA3 and PAC into 2 mL of 100% ethanol and then following the above procedure.
Four biological replicates of R07020 were treated with the PAC foliar spray outside of the greenhouse, and
were brought back into the greenhouse after 1 h. 1% PAC foliar spray was made by dissolving 0.78 g of PAC into
1 ml of DMSO and that was subsequently mixed with 9 mL of RO water. 10 mL of the PAC mixture was sprayed
onto the canopy of each replicate. 4 controls were treated with a 10 mL mixture of 1 mL DMSO and 9 mL RO
water.
RNA isolation, cDNA sequencing and qRT‑PCR. TX08001 was planted at 1 m and 0.15 m densities
in the field in May 2019 and tissue collected for gene expression analysis. At 60 DAE, phytomer tissue samples
were collected from three biological replicates at each planting density. Tissue was collected from the apex and
eight phytomers. Tissue sections were taken from the leaf blade and leaf sheath (center, above collar and collar
regions), as well as the stem (nodal plexus, 1 cm internode sections, and pulvinus). Total RNA was extracted
from all samples using the Direct-zol™ RNA Miniprep Kit (Zymo Research), and cDNA was synthesized using
SuperScript™ III First-Strand Synthesis SuperMix for qRT-PCR (Thermo Fisher Scientific, Invitrogen). The
expression of SbGA3ox2 (Sobic.003G045900) and SbGA20ox1 (Sobic.001G005300.1) was analyzed using qRT-
PCR, using PowerUP™ SYBR™ Green Master Mix (Thermo Fisher Scientific, Applied Biosystems).
The qRT-PCR methods used is described in Casto et al.93. For all qRT-PCR experiments, relative expression
was determined using the comparative cycle threshold (Ct) method. Raw Ct values for each sample were normal-
ized to Ct values of the reference gene SbUBC (Sobic.001G526600). Then, ddC t values were calculated relative
to the sample with the highest expression (lowest C t value). Relative expression values were calculated with the
2−ddCt method94. Fold change in gene expression was calculated based on dCt, values between the samples with
the lowest and highest expression according to the equation FC2dCt(max)−dCt(min). Primer specificity was tested by
dissociation curve analysis.
Microscopy. For microscopic imaging, longitudinal and horizontal hand sections were made using repre-
sentative TX08001 internodes from fully elongated internodes (phytomer 7) from 0.15 m and 1 m densities, to
investigate differences in cell number and length. Longitudinal and horizontal hand sections were also made of
using three R07020 internodes from fully elongated internodes (phytomer 7) 14 days after GA3 and PAC treat-
ments.
For cell number and length observation, the sections were stained with a 5% Calcofluor-white solution, a
fluorescent blue dye that binds to cellulose, for 1 min and imaged under DAPI fluorescence filter using Carl Zeiss
Axio Imager M2, coupled with Axiocam 503, under 5× magnification. ImageJ was used to reduce background
and measure cell lengths. Number of cells were calculated by dividing the internode length by cell length.
Statistical analysis. All statistical analyses (Welch’s t test and one-way ANOVA followed by Tukey com-
parison test) were performed using GraphPad Prism version 8.4.2 for macOS, GraphPad Software, San Diego,
CA, USA, www.graphpad.com.
Received: 25 August 2020; Accepted: 30 November 2020
References
1. Alexandratos, N. & Bruinsma, J. World agriculture towards 2030/2050: The 2012 revision. (2012).
2. Ray, D. K., Mueller, N. D., West, P. C. & Foley, J. A. Yield trends are insufficient to double global crop production by 2050. PLoS One
8, e66428 (2013).
3. Long, S. P., Marshall-Colon, A. & Zhu, X.-G. Meeting the global food demand of the future by engineering crop photosynthesis
and yield potential. Cell 161, 56–66 (2015).
4. Mullet, J. E. High-biomass C4 grasses—filling the yield gap. Plant Sci. 261, 10–17 (2017).
5. Pingali, P. L. Green revolution: Impacts, limits, and the path ahead. Proc. Natl. Acad. Sci. 109, 12302–12308 (2012).
6. Grassini, P., Eskridge, K. M. & Cassman, K. G. Distinguishing between yield advances and yield plateaus in historical crop produc-
tion trends. Nat. Commun. 4, 1–11 (2013).
7. Hall, A. J. & Richards, R. A. Prognosis for genetic improvement of yield potential and water-limited yield of major grain crops.
Field Crops Res. 143, 18–33 (2013).
8. Wei, T., Zhang, T., Cui, X., Glomsrød, S. & Liu, Y. Potential influence of climate change on grain self-sufficiency at the country
level considering adaptation measures. Earth’s Future 7, 1152–1166 (2019).
9. Arneth, A., et al. Climate Change and Land (Intergovernmental Panel on Climate Change, 2019).
10. Sannigrahi, P., Ragauskas, A. J. & Tuskan, G. A. Poplar as a feedstock for biofuels: A review of compositional characteristics. Biofuels
Bioprod. Biorefin. 4, 209–226 (2010).
11. Jung, Y. H. et al. Evaluation of a transgenic poplar as a potential biomass crop for biofuel production. Biores. Technol. 129, 639–641
(2013).
12. Fike, J. H. et al. Long-term yield potential of switchgrass-for-biofuel systems. Biomass Bioenerg. 30, 198–206 (2006).
13. Jung, J. H. et al. RNA interference suppression of lignin biosynthesis increases fermentable sugar yields for biofuel production
from field-grown sugarcane. Plant Biotechnol. J. 11, 709–716 (2013).
14. Chandel, A. K., da Silva, S. S., Carvalho, W. & Singh, O. V. Sugarcane bagasse and leaves: Foreseeable biomass of biofuel and bio-
products. J. Chem. Technol. Biotechnol. 87, 11–20 (2012).
15. de Souza, A. P., Grandis, A., Leite, D. C. & Buckeridge, M. S. Sugarcane as a bioenergy source: History, performance, and perspec-
tives for second-generation bioethanol. BioEnergy Res. 7, 24–35 (2014).
Scientific Reports | (2021) 11:46 | https://doi.org/10.1038/s41598-020-79975-8 10
Vol:.(1234567890)www.nature.com/scientificreports/
16. Brosse, N., Dufour, A., Meng, X., Sun, Q. & Ragauskas, A. Miscanthus: A fast-growing crop for biofuels and chemicals production.
Biofuels Bioprod. Biorefin. 6, 580–598 (2012).
17. Zhuang, Q., Qin, Z. & Chen, M. Biofuel, land and water: Maize, switchgrass or Miscanthus?. Environ. Res. Lett. 8, 015020 (2013).
18. Rooney, W. L., Blumenthal, J., Bean, B. & Mullet, J. E. Designing sorghum as a dedicated bioenergy feedstock. Biofuels Bioprod.
Biorefin. 1, 147–157 (2007).
19. Mullet, J. et al. Energy sorghum—a genetic model for the design of C4 grass bioenergy crops. J. Exp. Bot. 65, 3479–3489 (2014).
20. Dale, V. H., Lowrance, R., Mulholland, P. & Robertson, G. P. Bioenergy sustainability at the regional scale. Ecol. Soc. 15, 20 (2010).
21. Yang, M. et al. Accumulation of high-value bioproducts in planta can improve the economics of advanced biofuels. Proc. Natl.
Acad. Sci. 117, 8639–8648 (2020).
22. Prakasham, R. S. et al. Sorghum biomass: A novel renewable carbon source for industrial bioproducts. Biofuels 5, 159–174 (2014).
23. Olson, S. N. et al. High biomass yield energy sorghum: Developing a genetic model for C4 grass bioenergy crops. Biofuels Bioprod.
Biorefin. 6, 640–655 (2012).
24. Truong, S. K., McCormick, R. F., Rooney, W. L. & Mullet, J. E. Harnessing genetic variation in leaf angle to increase productivity
of Sorghum bicolor. Genetics 201, 1229–1238 (2015).
25. Olson, S. N. et al. Energy sorghum hybrids: Functional dynamics of high nitrogen use efficiency. Biomass Bioenerg. 56, 307–316
(2013).
26. Gelli, M. et al. Identification of differentially expressed genes between sorghum genotypes with contrasting nitrogen stress toler-
ance by genome-wide transcriptional profiling. BMC Genom. 15, 179 (2014).
27. Gill, J. R. et al. Yield results and stability analysis from the sorghum regional biomass feedstock trial. Bioenergy Res. 7, 1026–1034
(2014).
28. Lee, D. K. et al. Biomass production of herbaceous energy crops in the United States: Field trial results and yield potential maps
from the multiyear regional feedstock partnership. GCB Bioenergy 10, 698–716 (2018).
29. Hilley, J., Truong, S., Olson, S., Morishige, D. & Mullet, J. Identification of Dw1, a regulator of sorghum stem internode length.
PLoS One 11, 20 (2016).
30. Hirano, K. et al. Sorghum DW1 positively regulates brassinosteroid signaling by inhibiting the nuclear localization of BRASSI-
NOSTEROID INSENSITIVE 2. Sci. Rep. 7, 1–10 (2017).
31. Yamaguchi, M. et al. Sorghum Dw1, an agronomically important gene for lodging resistance, encodes a novel protein involved in
cell proliferation. Sci. Rep. 6, 1–11 (2016).
32. Hilley, J. L. et al. Sorghum Dw2 encodes a protein kinase regulator of stem internode length. Sci. Rep. 7, 1–13 (2017).
33. Multani, D. S. et al. Loss of an MDR transporter in compact stalks of maize br2 and sorghum dw3 mutants. Science 302, 81–84
(2003).
34. Knoller, A. S., Blakeslee, J. J., Richards, E. L., Peer, W. A. & Murphy, A. S. Brachytic2/ZmABCB1 functions in IAA export from
intercalary meristems. J. Exp. Bot. 61, 3689–3696. https://doi.org/10.1093/jxb/erq180 (2010).
35. Ordonio, R. L. et al. Gibberellin deficiency pleiotropically induces culm bending in sorghum: An insight into sorghum semi-dwarf
breeding. Sci. Rep. 4, 1–10 (2014).
36. Busov, V. B. et al. Activation tagging of a dominant gibberellin catabolism gene (GA 2-oxidase) from poplar that regulates tree
stature. Plant Physiol. 132, 1283–1291 (2003).
37. Yamaguchi, S. Gibberellin metabolism and its regulation. Annu. Rev. Plant Biol. 59, 225–251 (2008).
38. Achard, P. & Genschik, P. Releasing the brakes of plant growth: How GAs shutdown DELLA proteins. J. Exp. Bot. 60, 1085–1092
(2009).
39. Kebrom, T. H. A growing stem inhibits bud outgrowth—the overlooked theory of apical dominance. Front. Plant Sci. 8, 1874. https
://doi.org/10.3389/fpls.2017.01874(2017).
40. Morgan, P. W., Miller, F. & Quinby, J. Manipulation of sorghum growth and development with gibberellic acid 1. Agron. J. 69,
789–793 (1977).
41. Yun-jia, T. & Liesche, J. The molecular mechanism of shade avoidance in crops-how data from Arabidopsis can help to identify
targets for increasing yield and biomass production. J. Integrat. Agric. 20, 20 (2016).
42. Carriedo, L. G., Maloof, J. N. & Brady, S. M. Molecular control of crop shade avoidance. Curr. Opin. Plant Biol. 30, 151–158 (2016).
43. Pao, C.-I. & Morgan, P. W. Genetic regulation of development in Sorghum bicolar: I. Role of the maturity genes. Plant Physiol. 82,
575–580 (1986).
44. Pao, C.-I. & Morgan, P. W. Genetic regulation of development in Sorghum bicolor: II. Effect of the ma3R allele mimicked by GA3.
Plant Physiology 82, 581–584 (1986).
45. Childs, K. L. et al. The sorghum photoperiod sensitivity gene, Ma3, encodes a phytochrome B. Plant Physiol. 113, 611–619 (1997).
46. Beall, F. D., Morgan, P. W., Mander, L. N., Miller, F. R. & Babb, K. H. Genetic regulation of development in Sorghum bicolor: V. The
ma3R allele results in gibberellin enrichment. Plant Physiol. 95, 116–125 (1991).
47. Kebrom, T. H. & Mullet, J. E. Transcriptome profiling of tiller buds provides new insights into PhyB regulation of tillering and
indeterminate growth in sorghum. Plant Physiol. 170, 2232–2250. https://doi.org/10.1104/pp.16.00014 (2016).
48. Finlayson, S. A., Lee, I.-J., Mullet, J. E. & Morgan, P. W. The mechanism of rhythmic ethylene production in sorghum. The role of
phytochrome B and simulated shading. Plant Physiol. 119, 1083–1090 (1999).
49. Page, E., Tollenaar, M., Lee, E., Lukens, L. & Swanton, C. Shade avoidance: An integral component of crop–weed competition.
Weed Res. 50, 281–288 (2010).
50. Franklin, K. A. & Whitelam, G. C. Phytochromes and shade-avoidance responses in plants. Ann. Bot. 96, 169–175 (2005).
51. Aphalo, P. J., Ballare, C. L. & Scopel, A. L. Plant–plant signalling, the shade-avoidance response and competition. J. Exp. Bot. 50,
1629–1634 (1999).
52. Stamm, P. & Kumar, P. P. The phytohormone signal network regulating elongation growth during shade avoidance. J. Exp. Bot. 61,
2889–2903 (2010).
53. Mawphlang, O. I. & Kharshiing, E. V. Photoreceptor mediated plant growth responses: Implications for photoreceptor engineering
toward improved performance in crops. Front. Plant Sci. 8, 1181 (2017).
54. Ballaré, C. L., Scopel, A. L., Sánchez, R. A. & Radosevich, S. R. Photomorphogenic processes in the agricultural environment.
Photochem. Photobiol. 56, 777–788 (1992).
55. Casal, J. J. Shade avoidance. The Arabidopsis Book/American Society of Plant Biologists 10 (2012).
56. Pierik, R. & De Wit, M. Shade avoidance: Phytochrome signalling and other aboveground neighbour detection cues. J. Exp. Bot.
65, 2815–2824 (2014).
57. Smith, H. Phytochromes and light signal perception by plants—an emerging synthesis. Nature 407, 585–591 (2000).
58. Wang, H. & Wang, H. Phytochrome signaling: Time to tighten up the loose ends. Mol. Plant 8, 540–551 (2015).
59. Leivar, P. & Quail, P. H. PIFs: Pivotal components in a cellular signaling hub. Trends Plant Sci. 16, 19–28 (2011).
60. Sessa, G. et al. A dynamic balance between gene activation and repression regulates the shade avoidance response in Arabidopsis.
Genes Dev. 19, 2811–2815 (2005).
61. Hornitschek, P., Lorrain, S., Zoete, V., Michielin, O. & Fankhauser, C. Inhibition of the shade avoidance response by formation of
non-DNA binding bHLH heterodimers. EMBO J. 28, 3893–3902 (2009).
62. Yang, C. & Li, L. Hormonal regulation in shade avoidance. Front. Plant Sci. 8, 1527 (2017).
Scientific Reports | (2021) 11:46 | https://doi.org/10.1038/s41598-020-79975-8 11
Vol.:(0123456789)www.nature.com/scientificreports/
63. Halliday, K. J., Martínez-García, J. F. & Josse, E.-M. Integration of light and auxin signaling. Cold Spring Harbor Perspect. Biol. 1,
a001586 (2009).
64. Schwechheimer, C. & Willige, B. C. Shedding light on gibberellic acid signalling. Curr. Opin. Plant Biol. 12, 57–62 (2009).
65. Dobisova, T. et al. Light controls cytokinin signaling via transcriptional regulation of constitutively active sensor histidine kinase
CKI1. Plant Physiol. 174, 387–404 (2017).
66. Cho, J.-N. et al. Control of seed germination by light-induced histone arginine demethylation activity. Dev. Cell 22, 736–748 (2012).
67. Pierik, R., Cuppens, M. L., Voesenek, L. A. & Visser, E. J. Interactions between ethylene and gibberellins in phytochrome-mediated
shade avoidance responses in tobacco. Plant Physiol. 136, 2928–2936 (2004).
68. Duvick, D. N. The contribution of breeding to yield advances in maize (Zea mays L.). Adv. Agron. 86, 83–145 (2005).
69. Itoh, H. et al. The gene encoding tobacco gibberellin 3β-hydroxylase is expressed at the site of GA action during stem elongation
and flower organ development. Plant J. 20, 15–24 (1999).
70. Mimura, M., Nagato, Y. & Itoh, J.-I. Rice PLASTOCHRON genes regulate leaf maturation downstream of the gibberellin signal
transduction pathway. Planta 235, 1081–1089 (2012).
71. Teng, F. et al. ZmGA3ox2, a candidate gene for a major QTL, qPH3. 1, for plant height in maize. Plant J. 73, 405–416 (2013).
72. McCormick, R. F. et al. The Sorghum bicolor reference genome: Improved assembly, gene annotations, a transcriptome atlas, and
signatures of genome organization. Plant J. 93, 338–354 (2018).
73. Clore, A. M. Cereal grass pulvini: Agronomically significant models for studying gravitropism signaling and tissue polarity. Am.
J. Bot. 100, 101–110 (2013).
74. Gomez, F. E., Muliana, A. H., Niklas, K. J. & Rooney, W. L. Identifying morphological and mechanical traits associated with stem
lodging in bioenergy sorghum (Sorghum bicolor). Bioenergy Res. 10, 635–647 (2017).
75. Esechie, H. Relationship between lodging, certain morphological characters and yield of grain sorghum (Sorghum bicolor L.
Moench). J. Agric. Sc. 101, 669–673 (1983).
76. Bashford, L., Maranville, J., Weeks, S. & Campbell, R. Mechanical properties affecting lodging of sorghum. Trans. ASAE 19, 962–966
(1976).
77. McKinley, B., Rooney, W., Wilkerson, C. & Mullet, J. Dynamics of biomass partitioning, stem gene expression, cell wall biosynthesis,
and sucrose accumulation during development of Sorghum bicolor. Plant J. 88, 662–680 (2016).
78. Fernandez, M. G. S., Bao, Y., Tang, L. & Schnable, P. S. A high-throughput, field-based phenotyping technology for tall biomass
crops. Plant Physiol. 174, 2008–2022 (2017).
79. Hedden, P. & Thomas, S. G. Gibberellin biosynthesis and its regulation. Biochem. J. 444, 11–25 (2012).
80. Nelissen, H. et al. A local maximum in gibberellin levels regulates maize leaf growth by spatial control of cell division. Curr. Biol.
22, 1183–1187 (2012).
81. Voorend, W. et al. Overexpression of GA 20-OXIDASE 1 impacts plant height, biomass allocation and saccharification efficiency
in maize. Plant Biotechnol. J. 14, 997–1007 (2016).
82. Richardson, A. E. & Hake, S. Drawing a line: Grasses and boundaries. Plants 8, 4 (2019).
83. Dayan, J. et al. Leaf-induced gibberellin signaling is essential for internode elongation, cambial activity, and fiber differentiation
in tobacco stems. Plant Cell 24, 66–79 (2012).
84. Roig-Villanova, I. & Martínez-García, J. F. Plant responses to vegetation proximity: A whole life avoiding shade. Front. Plant Sci.
7, 236 (2016).
85. Sessa, G., Carabelli, M., Possenti, M., Morelli, G. & Ruberti, I. Multiple pathways in the control of the shade avoidance response.
Plants 7, 102 (2018).
86. Binenbaum, J., Weinstain, R. & Shani, E. Gibberellin localization and transport in plants. Trends Plant Sci. 23, 410–421 (2018).
87. Shani, E. et al. Gibberellins accumulate in the elongating endodermal cells of Arabidopsis root. Proc. Natl. Acad. Sci. 110, 4834–4839
(2013).
88. Regnault, T., Davière, J.-M. & Achard, P. Long-distance transport of endogenous gibberellins in Arabidopsis. Plant Signal. Behav.
11, e1110661 (2016).
89. Hoad, G., Retamales, J., Whiteside, R. & Lewis, M. Phloem translocation of gibberellins in three species of higher plants. Plant
Growth Regul. 13, 85–88 (1993).
90. Wang, Y. et al. Identification and expression analysis of Sorghum bicolor gibberellin oxidase genes with varied gibberellin levels
involved in regulation of stem biomass. Ind. Crops Prod. 145, 111951 (2020).
91. Johnston, R. et al. Transcriptomic analyses indicate that maize ligule development recapitulates gene expression patterns that occur
during lateral organ initiation. Plant Cell 26, 4718–4732. https://doi.org/10.1105/tpc.114.132688 (2014).
92. Kebrom, T. H., McKinley, B. & Mullet, J. E. Dynamics of gene expression during development and expansion of vegetative stem
internodes of bioenergy sorghum. Biotechnol. Biofuels 10, 159. https://doi.org/10.1186/s13068-017-0848-3 (2017).
93. Casto, A. L., McKinley, B. A., Yu, K. M. J., Rooney, W. L. & Mullet, J. E. Sorghum stem aerenchyma formation is regulated by
SbNAC_D during internode development. Plant Direct. 2, e00085. https://doi.org/10.1002/pld3.85 (2018).
94. Pfaffl, M. W. A new mathematical model for relative quantification in real-time RT–PCR. Nucleic Acids Res. 29, e45–e45 (2001).
Acknowledgements
The authors thank Dr. Brock Weers for maintaining plots and planting density and Adalynn Brock for assisting
with tissue collection and tissue grinding. This work was funded in part by the DOE Great Lakes Bioenergy
Research Center (DOE Office of Science DE-SC0018409) and supported by the Perry Adkisson Chair.
Author contributions
K.M.J.Y. and J.E.M. designed experiments and wrote the manuscript; K.M.J.Y. performed the experiments and
created all figures and tables; B.M. conducted RNA-seq analysis; W.L.R. provided seeds and planted plots; J.E.M.
supervised experimental design and article preparation. All authors reviewed the manuscript.
Competing interests
The authors declare no competing interests.
Additional information
Supplementary Information The online version contains supplementary material available at https://doi.
org/10.1038/s41598-020-79975-8.
Correspondence and requests for materials should be addressed to J.E.M.
Reprints and permissions information is available at www.nature.com/reprints.
Scientific Reports | (2021) 11:46 | https://doi.org/10.1038/s41598-020-79975-8 12
Vol:.(1234567890)You can also read