Higher yields and more biodiversity on smaller farms - The ...
←
→
Page content transcription
If your browser does not render page correctly, please read the page content below
Analysis
                                                                                                         https://doi.org/10.1038/s41893-021-00699-2

Higher yields and more biodiversity on
smaller farms
Vincent Ricciardi 1,2 ✉, Zia Mehrabi                      1,2,3
                                                                  , Hannah Wittman2,3, Dana James                    2,3
                                                                                                                           and
Navin Ramankutty 1,2,3

Small farms constitute most of the world’s farms and are a central focus of sustainable agricultural development. However, the
relationship between farm size and production, profitability, biodiversity and greenhouse gas emissions remains contested.
Here, we synthesize current knowledge through an evidence review and meta-analysis and show that smaller farms, on average,
have higher yields and harbour greater crop and non-crop biodiversity at the farm and landscape scales than do larger farms.
We find little conclusive evidence for differences in resource-use efficiency, greenhouse gas emission intensity and profits. Our
findings highlight the importance of farm size in mediating some environmental and social outcomes relevant to sustainable
development. We identify a series of research priorities to inform land- and market-based policies that affect smallholders
globally.

F
      arm size has become a key variable of interest in discussions            regional foci15,17. We present evidence from 118 studies (318 obser-
      surrounding food security, development, and the environ-                 vations) from 51 countries on the relationship between relative farm
      ment1. Most of the world’s farms are small—of the 570 million            size (along a continuum) and: (1) yields as value of crop output per
farms in the world, 84% are
Analysis NaTure SusTainabiliTy
Table 1 | Main results and mechanisms
Variable Result Mechanisms favouring small farms Mechanisms favouring large farms
Yield Smaller farms have Reliance on family labour (for example, Fig. 2). Mechanization enables higher yields with less
higher yields labour but is only cost-effective on larger fields57.
Biodiversity Smaller farms have Smaller fields have more edges that provide The link between field and farm size is relatively
(non-crop) higher biodiversity habitat5,36,58. understudied; large farms with small fields may also
Independently managed smaller fields and farms benefit biodiversity but this was untested in the
may create a more heterogeneous landscape59. reviewed literature.
Crop diversity Smaller farms have Subsistence farmers plant a greater diversity of Varietal diversity requires a minimum amount of
higher crop diversity traditional crops to meet nutritional needs30. space to prevent genetic erosion for wind-pollinated
Small farms are incentivized to cultivate landraces crops60,61.
when there are niche markets for traditional crops31. Diversified crops can reduce long-term risk at the
expense of short-term profit, which may require
financial buffers62,63.
Resource-use Inconclusive evidence In contexts where off-farm labour opportunities Increased access to information from extension
efficiency were greater, there was less available on-farm and advisory services was associated with
family labour and, in turn, greater technical greater technical efficiency, which is often only
efficiency64. cost-effective on larger fields64–67.
GHG emissions Inconclusive evidence Smaller farms may use less input-intensive Agricultural mechanization can enable higher yields
production methods but this was untested in the with less input use, and mechanization is often only
reviewed literature. cost-effective on larger fields57.
Profit Inconclusive evidence Specialty markets for traditional foods offer higher Better market access for larger farms69,70.
prices31. Recovering fixed costs requires a minimum scale69,71.
Smallholder credit access can increase access to Better access to land-based subsidies72.
inputs and markets68.
suggests that labour markets are an important reason for the inverse a Yields b Biodiversity
farm size–productivity relationship (Fig. 2b). (n = 69) (n = 87)
100
75
Smaller farms have greater crop diversity. While many field studies
have explored in situ crop diversity on small farms26–28, few directly 50
Probability of finding (%)
measured the relationship between farm size and crop diversity. 25
In our review, four studies show higher crop diversity on smaller 0
farms, while three found the opposite; much too small a sample for c d
statistical inference. But we previously conducted an in-depth quan- Resource efficiency Profitability
(n = 34) (n = 20)
titative analysis on the relationship between crop diversity and farm 100
size across 55 countries and 154 crops using a newly harmonized 75
dataset of nationality representative farmer surveys and agricul- 50
tural censuses29. We found that, except for an unexplained dip in
25
the 2–5 ha size range, there is a strong inverse relationship globally
between farm size and the number of crop species found across the 0
Small farms No trend Large farms Small farms No trend Large farms
landscape—with higher species diversity within smaller farms than are better are better are better are better
larger farms when controlling for area (Supplementary Fig. 2). Crop
diversity on small farms is selected by farmers for a range of reasons
Fig. 1 | The probability of studies finding relationships between farm size
such as improved nutrition30, market diversification31 and mitiga-
and each outcome variable. Results are as per the vote count findings
tion of drought risk32.
(for example, small farms have more biodiversity when compared to larger
farms, compared to no trend emerging between farm size and profitability).
Smaller farms harbour greater non-crop biodiversity. There
a–d, Results are shown for the following outcome variables: yield (a),
are three key pathways by which smaller farms could be benefi-
biodiversity (b), resource efficiency (c), and profitability (d). The average
cial for non-crop biodiversity covered in the literature. The first is
and 95% CIs are given (see Supplementary Table 3 for underlying data).
through ecological management practices, such as limited insecti-
Note, GHG emission studies were typically on individual farms so we could
cide use and use of organic management practices. The second is
not conduct vote counts on this variable.
through increased field edges (increased margin-to-field area ratio);
increased field edges can lead to larger available breeding habi-
tats for arthropods33,34, provide refuge for arthropods and smaller 77% of studies (95% CI = 61–99%) reported that smaller farms and
species to colonize after escaping recently disturbed fields35,36, fields have greater biodiversity at the farm and landscape levels
increase the number of pollinators and beneficial predators within compared to larger farms and fields (Fig. 1).
fields4,34 and act as conservation corridors for arthropods and small The three remaining variables we tested—GHG emissions,
mammals37,38. The third is through landscape composition, with resource-use efficiency, and profits—did not show conclusive
small-farm-dominated landscapes harbouring diverse land cover relationships for the effect size magnitude and sign (Figs. 2, 4,
types such as forests and wetlands, fields of different crops or fields and 5), even though the majority of studies concluded that larger
in different phenological stages of production39,40. In the studies we farms had greater resource efficiency than smaller farms (Fig. 1).
reviewed, there is evidence for all of these effects. When combined, For example, while the evidence we reviewed shows that GHG
Nature Sustainability | www.nature.com/natsustainNaTure SusTainabiliTy Analysis
a b
Yields
Yields (n = 33)
Yields (n = 33) Management not controlled (n = 16)
Management controlled (n = 17)
Labour not controlled (n = 17)
Labour controlled (n = 16)
GHG emissions (n = 100) Institutions not controlled (n = 26)
Institutions controlled (n = 7)
–10 0 10
Profitability (n = 15) c Resource efficiency
Resource efficiency (n = 18)
Extension not controlled (n = 7)
Extension controlled (n = 11)
Credit not controlled (n = 8)
Resource efficiency (n = 18) Credit controlled (n = 10)
Cooperative not controlled (n = 14)
Cooperative controlled (n = 4)
–10 –5 0 5 10 –10 0 10
Percentage change Percentage change
Fig. 2 | The pooled effect sizes for each outcome variable that show the percent change per 1 ha increase in farm size. a, Pooled effect size per variable
as derived from the random effect meta-regressions. The vertical black line indicates the 1:1 response ratio where, for a 1-ha change in farm size, there is
no change in the outcome variable. A response ratio 0, then larger farms have a higher effect. The number of observations (n) and 95% CIs are given per variable. b, For yield, sensitivity analyses
fit separate models to explore heterogeneity in the effect for studies that controlled for common explanations for the inverse farm size–yield relationship:
institutional characteristics, farm management and family labour. c, For resource-use efficiency, separate models were fit to test if the effect was
moderated by common development interventions to improve smallholder resource-use efficiency: extension access, farmer cooperatives/groups, and
credit access. Profit and GHG emissions had no additional models. Note, biodiversity studies typically did not include regression coefficients, so we could
not conduct a random effects meta-regression. (See Supplementary Table 4 for underlying data).
emissions per unit output tend to be higher on smaller farms, sug- focused on higher-income countries, mainly in North America and
gesting that smaller farms might be less efficient per unit output, Europe (Supplementary Fig. 4). Different regions may contain spe-
the confidence intervals around this effect crossed zero (−4% mean cies that prefer environments that larger farms foster, either through
effect; 95% CI = −10–2%). We found no clear difference between their larger fields or different farm management techniques (Table
small or large farms in technical efficiency (our proxy for resource 1). While we could not test for these factors explicitly due to our
efficiency per unit output with 0% mean effect; 95% CI = −1–2%), sample size, a dominant theme in the literature for other indica-
even after controlling for a variety of moderating factors, such as tors (yield, profitability, and resource efficiency) was that a farm’s
access to credit, extension services or cooperative membership political, socioeconomic, and geographic context (a farmer’s access
(Fig. 2c). See the Supplementary Information for further discus- to training, credit, machinery, insurance, inputs, markets, and/or
sion of these results. Similarly, while profitability per unit area also subsidies) may explain the farm size to outcome relationships. For
declined with increasing farm size, statistical confidence in the instance, the relationships between farm size, resource efficiency,
effect was also low (−2% mean effect; 95% CI = −10–5%) (Fig. 2a). and profit were the most spatially heterogeneous across all variables
examined. For certain smallholder-dominant countries (for exam-
Discussion ple, India and Ethiopia) we found that smaller farms were more
Our evidence review and meta-analysis of the current evidence base profitable, whereas larger farms were more profitable in countries
for these six outcomes associated with farm size finds strong sup- dominated by large farms, higher incomes, and better rural infra-
port for the inverse farm size–productivity and farm size–diversity structure (for example, the United States). This may suggest that
relationship (empirical findings that both have strong theoretical smallholders have better access to markets, inputs, and technolo-
support24,41–43). While a couple of emerging studies44,45, with limited gies in a smallholder-dominant system that may affect their profit-
coverage, suggest that the inverse size–productivity relationship ability and resource efficiency (see Supplementary Information for
might simply be a result of measurement errors and while we were expanded discussion).
unable to rule out this possibility, our synthesis did find the inverse Systematic evidence syntheses, such as meta-analyses, are an
farm size–yield effect was removed when controlling for labour, iterative process47. For some of the outcomes (such as GHG emis-
suggesting that smaller farms may be more productive due to the sions, profits, and resource-use efficiency) we were unable to
availability of family labour24. Similarly, we recognize that socio- identify consistent or confident outcomes from the existing liter-
political context is important and small farms may not always be ature. This may be due to the small number of included studies,
more biodiverse46 but most of the evidence base across a broad geo- limited cross-country analyses, or that these relationships are too
graphic range of agricultural systems is in support of this positive context-specific to be generalized. Future work should continue
relationship. to assess these outcomes and build on this study to include other
An important caveat to interpreting the past literature for each of important outcomes, such as mental and physical health of workers
these outcomes are regional biases and variation. Regional biases are and farmers, employment opportunities, pesticide or fertilizer use
most evident in the biodiversity literature that has predominantly efficiency, and other key ecosystem services, such as pollination, in
Nature Sustainability | www.nature.com/natsustainAnalysis NaTure SusTainabiliTy
Dorward, 1999 − Malawi (Many) (n = National) by smallholders2 and smallholders in lower-income countries are
Ghose, 1979 − India (Many) (n = 94)
also among the poorest people on the planet49. Our study shows
Khan, 1977 − Pakistan (Wheat) (n = National)
Ghose, 1979 − India (Many) (n = 150)
that smallholders are both productive and stewards of biodiversity.
Khan, 1977 − Pakistan (Cotton) (n = National) Rewarding smaller farms for their conservation benefits may be
Khan, 1977 − Pakistan (Wheat) (n = National) one policy pathway towards supporting smallholders. Biodiversity
Ghose, 1979 − India (Many) (n = 100) could be promoted on larger farms by promoting more ecologically
Khan, 1977 − Pakistan (Cotton) (n = National)
friendly management practices and increasing biodiversity refuges
Garrett, 2013 − Brazil (Soy) (n = 2,155)
Khan, 1977 − Pakistan (Rice) (n = National)
such as buffer strips and increased natural perimeters.
Ghose, 1979 − India (Many) (n = 149) These findings come at a time where donor countries need to
Barrett, 2010 − Madagascar (Rice) (n = 286) invest an estimated US$14 billion annually to achieve the goal of
Chen, 2011 − China (Many) (n = 386) SDG 2.3 to double the incomes and productivity of smallholders49.
Henderson, 2015 − Nicaragua (Many) (n = 5,743)
Our review adds to the motivation for these investments. We found
Ghose, 1979 − India (Many) (n = 85)
Khan, 1977 − Pakistan (Rice) (n = National)
that, despite smallholders’ increased yields and role in provision of
Ghose, 1979 − India (Many) (n = 148) ecosystem services, there is not enough evidence for equivalent gains
Kagin, 2016 − Mexico (Many) (n = 1,361) in smallholders’ profits. Thus, development support for smallhold-
Carter, 1984 − India (Many) (n = 406) ers is imperative from multiple viewpoints: the data not only show
Ghose, 1979 − India (Many) (n = 100)
that investing in smallholders could lead to humanitarian benefits
Newell, 1997 − India (Many) (n = 400)
Assuncao, 2007 − India (Many) (n = 3,973)
but also to increases in food production and benefits to biodiversity.
Benjamin, 1995 − Indonesia (Rice) (n = 4,605)
Rada, 2015 − China (Rice) (n = 8,589)
Rada, 2015 − China (Maize) (n = 12,478)
Abdallah, 2016 − India (cotton) (n = 569)
Rada, 2015 − China (Wheat) (n = 6,964)
Benjamin, 1995 − Indonesia (Many) (n = 4,605)
Majumder, 2016 − Bangladesh (rice) (n = 944)
Stifel, 2008 − Madagascar (Rice) (n = 163)
Carletto, 2013 − Uganda (Maize) (n = 107)
Majumder, 2016 − Bangladesh (rice) (n = 944)
Heltberg, 1998 − Pakistan (Many) (n = 930)
Headey, 2014 − Ethiopia (Teff) (n = 1,240) Kulekci, 2010 − Turkey (sunflower) (n = 117)
Headey, 2014 − Ethiopia (Maize) (n = 1,240)
Li, 2013 − China (Many) (n = 2,155) Majumder, 2016 − Bangladesh (rice) (n = 944)
Alene, 2003 − Ethiopia (maize) (n = 60)
Pooled effect −0.05 (−0.09 to −0.01)
Omonona, 2010 − Nigeria (cowpea) (n = 120)
Hussien, 2011 − Ethiopia (many) (n = 252)
−75 −50 −25 0 25
Percentage change per 1 ha
Bakhshoodeh, 2001 − Iran (wheat) (n = 164)
increase in farm size
Kilic, 2009 − Turkey (hazelnut) (n = 78)
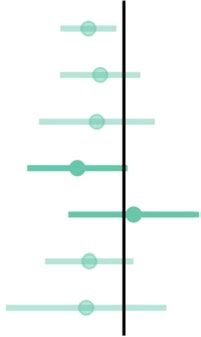
Fig. 3 | Forest plot for yields, where observations are in standardized
Bojnec, 2013 − Slovenia (many) (n = 1,784)
form and 95% CI are given. The size of each point estimate relates to the
inverse standard error. The pooled effect and 95% CI are given in the lower Tolga, 2009 − Turkey (rice) (n = 70)
plot. The country, crop name, and sample size (n) for each observation are
given on the y axis. ‘National’ sample sizes indicate that the author used Wang, 2010 − China (wheat) (n = 432)
tabulated national statistics and did not include the sample size. Please
Abedullah, 2007 − Pakistan (rice) (n = 200)
see the source data in the Supplementary Information for complete list of
references shown in the figure. Binici, 2006 − Turkey (cotton) (n = 54)
Majumder, 2016 − Bangladesh (rice) (n = 944)
addition to examining literature in languages other than English. Haji, 2007 − Ethiopia (many) (n = 150)
New primary work is also needed to further explore the functional
form of the effects we present here, and to explore how different Majumder, 2016 − Bangladesh (Rice) (n = 944)
socioecological and political conditions and measurement methods
may mediate positive or negative outcomes across farm size classes.
This could further inform policies on land reform (such as redistri- Pooled effect 0 (−0.01 to 0.02)
bution or consolidation) that address market failures so that such
policies can maximize the multidimensional benefits of farming
systems to society48. −20 0 20
To support sustainable transitions in farming practices across Percentage change per 1 ha
a range of farm sizes, more evidence-based synthesis is needed at increase in farm size
broad regional scales. Until recently, the role of farm size in the
global food system has been largely assessed by independent case Fig. 4 | Forest plot for resource efficiency, where observations are in
studies. As international commitments (for example, SDGs and standardized form and 95% CI are given. The size of each point estimate
COP21 INDCs) begin to evolve into actionable funding plans and relates to the inverse standard error. The pooled effect and 95% CI are
as countries continue to decide on land use policies that directly given in the lower plot. The country, crop name, and sample size (n) for
affect the size of farms, it is critical to identify how farm size affects each observation are given on the y axis. ‘National’ sample sizes indicate
different social, economic and environmental outcomes. that the author used tabulated national statistics and did not include the
Our study lends evidence to boost support for policies target- sample size. Please see the source data in the Supplementary Information
ing smallholders. Most of the world’s farms (84%) are operated for complete list of references shown in the figure.
Nature Sustainability | www.nature.com/natsustainNaTure SusTainabiliTy Analysis
size was associated with a decrease, increase or null relationship to the variable of
Rahman, 2016 − Nigeria (rice) (n = 400)
interest (we found no nonlinear results in the literature). For yield, resource-use
efficiency and profit, we extracted several additional variables to calculate pooled
Dauda, 2009 − Nigeria (many) (n = 250) effect sizes of regression model coefficients. To augment the sparse crop diversity
and GHG emission literature on farm size, we used results from Ricciardi et al.29 and
Savastano, 2009 − Kyrgyzstan (many) (n = 114) Clark & Tilman’s (2017)51 dataset, respectively. We leveraged the Clark & Tilman
meta-analysis database containing 742 agricultural life-cycle analysis observations
Rahman, 2016 − Nigeria (cassava) (n = 400) from 152 unique studies51; we coded observations that reported average farm size to
construct a dataset containing crop species, GHG emissions per unit output (in CO2
equivalents), average farm size and sample size for 100 observations (11 studies)
Rahman, 2016 − Nigeria (yam) (n = 400) that met our inclusion criteria. As part of our systematic assessment we extracted
information from the broader literature on causal mechanisms behind the main
Sewando, 2014 − Tanzania (cassava) (n = 98) trends, as well as factors that caused deviations from the main trends (Table 1).
Our search yielded 1,474 studies. In total, we identified 118 studies (318
Li, 2013 − China (many) (n = 2,155) observations) that met our inclusion criteria. From these, we included seven solely
in the life-cycle analysis and coded 111 studies (218 observations) as vote counts,
Lamb, 2003 − India (many) (n = 1,060)
of which we extracted regression coefficients from 40 studies (66 observations)
(Supplementary Table 2 shows summary statistics).
Myyra, 2002 − Finland (cereals) (n = 962) Synthesis of results. We ran three types of meta-regressions to synthesize the vote
count findings, extracted regression slopes and the GHG emission estimates. Due
Rada, 2015 − China (wheat) (n = 17,794) to differing data availability across variables (for example, biodiversity studies did
not typically report regression coefficients), not all variables were analysed in each
Deininger, 2003 − Nicaragua (many) (n = 1,352) meta-regression. First, we used cumulative link multilevel models (CLMM) to
synthesize the ordinal vote count findings for yield, resource-use efficiency, profit
Rada, 2015 − China (rice) (n = 20,584)
and biodiversity52,53. We used CLMMs to examine the probability of the ordinal
outcome variable (observation finding negative, null or positive relationships
with farm size). For all CLMM and subsequent models (detailed in the following
Rada, 2015 − China (maize) (n = 33,369) paragraphs), we set the study as a random effect. Hierarchical models are
commonplace in meta-analyses and applied in our study because of the a priori
Heltberg, 1998 − Pakistan (many) (n = 930) expectation that observations within studies and across similar crop types would
be correlated in the response, with random effects allowing us to account for
Gaurav, 2015 − India (Many) (n = 51,770) non-independence. In addition, as used in meta-analyses, random effects estimate
a variance component in addition to the sampling variance that fixed effects
models assume; this extra variance component has enabled meta-analyses
using random effects to be applied more generally and allows data to be
interpreted as a random population of outcomes instead of a single ‘true effect’,
Pooled effect −0.02 (−0.1 to 0.05)
as is a common interpretation of fixed effects meta-analyses47. For yields and
non-crop biodiversity, we also set crop type as random effects. For non-crop
biodiversity, we also set non-crop species type as a random effect. We tested if the
0 40 80 120
additional random effects used for yields and non-crop biodiversity changed the
Percentage change per 1 ha results compared to using only studies as random effects and found no differences
increase in farm size
in our conclusions.
Second, we used hierarchical meta-regressions of the standardized regression
Fig. 5 | Forest plot for profitability, where observations are in standardized slopes and standard errors54,55 to calculate pooled effects for yield, resource-use
form and 95% CI are given. The size of each point estimate relates to the efficiency and profit. Since certain variables contained multiple currencies,
efficiency units or measurement metrics, we relied on the Rodríguez-Barranco
inverse standard error. The pooled effect and 95% CI are given in the lower et al. technique to convert farm size regression coefficients and standard errors
plot. The country, crop name, and sample size (n) for each observation into standardized regression coefficients56. Our standardized coefficients represent
are given on the y axis. Please see the source data in the Supplementary a relative change in the outcome variable per 1-ha change in farm size (we note
Information for complete list of references shown in the figure. that these coefficients are limited by the range of the underlying farm sizes in
each study and should not be extrapolated). We used a linear model to synthesize
results because the literature predominantly provided linear coefficients. We used
Such a triple reward confirms that support for smallholders globally the same random effects variable set up as in the CLMM models. Sensitivity tests
were conducted through cumulative meta-regressions for continuous variables
is an essential pathway for sustainable development. (for example, year of study and average farm size study observed) and subsetted
meta-regression for categorical variables (for example, type of diversity metric
Methods used, if yield was defined by weight ha–1 or value ha–1, if resource efficiency was
A meta-analysis was conducted using the PRISMA guidelines50 (see Supplementary derived from data envelopment analysis or stochastic frontier and so on). All
Fig. 3 for inclusions/omissions and Supplementary Table 1 for Boolean search sensitivity tests found no differences in results. Forest plots are given in Figs. 3–5.
terms). Below, we outline our data collection and synthesis methods. An inclusion of bias analysis was conducted through funnel plots that compare the
observed outcomes to standard errors. There were no clear biases for yields and
Data. We searched the Web of Science and Scopus databases for studies in resource efficiency but a slight positive bias for profit (Supplementary Fig. 5).
English published before December 2017. We used four inclusion criteria: This meta-regression framework also enabled us to further test if the variation
(1) peer-reviewed; (2) directly measured farm size and the outcome variable(s) of in findings between different studies could be attributed to the inclusion/omission
interest; (3) reported error estimates/significance tests in determining effect size; of variables that authors used when estimating the relationship between farm size
and (4) compared farms with similar management systems (for example, compared and the variable of interest, through sensitivity analyses using moderators. For
small and large cereal farms, not small vegetable farms to large cereal farms) or yield, we assessed the importance of moderators such as the types of production
controlled for the cropping systems’ differences (for example, converted different methods, institutional characteristics (credit markets and access, extension access
crops to their value amount and/or controlled for the different types of crop species and involvement in farmer cooperatives) and types of labour (general labour
planted). The inclusion of studies that compared farms with similar management market imperfections, family labour and household size). Our logic was that, if the
systems enabled us to examine if policies should target certain farm sizes to relationship is moderated by these factors (for example, if the main relationship
grow particular crops. Future research may want to omit this inclusion criteria to became null), it would indicate that there is a systematic variable omission bias in
examine policy questions relevant to which types of crops should a country grow the literature that, once corrected for, could explain the inverse farm size to yield
given their farm size distribution. relationship. For resource-use efficiency, we conducted similar sensitivity analyses,
Studies were coded at the observational level to analyse multiple crops, years by including moderators that described development interventions (credit access,
and locations per study; studies had multiple observations if they separately extension access or farmer group membership). Our key hypothesis was that
reported different crops, years and/or locations per outcome variable. The main having similar access to credit, extension or inputs and markets (through farmer
conclusions were categorically coded as vote counts, where an increase in farm groups) may enable small farms to be equally or more efficient than large farms.
Nature Sustainability | www.nature.com/natsustainAnalysis NaTure SusTainabiliTy
Third, for the GHG emission observations, we used robust linear mixed-effects 25. Dorward, A. Agricultural labour productivity, food prices and sustainable
models where we set the study and crop type as random effects. To estimate GHG development impacts and indicators. Food Policy 39, 40–50 (2013).
emissions per unit output, we used the log average farm size of a study as a fixed 26. Zimmerer, K. S. Geographies of seed networks for food plants (potato,
effect. The key difference in the GHG emission model is that the data are at the Ulluco) and approaches to agrobiodiversity conservation in the Andean
aggregated farm level, as opposed to extracted regression coefficients for the yield, countries. Soc. Nat. Resour. Int. J. 16, 583–601 (2011).
resource-use efficiency and profit models. (Formulas and further detail on each 27. Bicksler, A. et al. Methodologies for strengthening informal indigenous
meta-regression used are available in the Supplementary information.) vegetable seed systems in northern Thailand and Cambodia. Acta Hortic. 958,
67–74 (2012).
Data availability 28. Coomes, O. T. et al. Farmer seed networks make a limited contribution to
The data that support the findings of this study are available in the Supplementary agriculture? Four common misconceptions. Food Policy 56, 41–50 (2015).
Information. Source data are provided with this paper. 29. Ricciardi, V., Ramankutty, N., Mehrabi, Z., Jarvis, L. & Chookolingo, B.
How much of our world’s food do smallholders produce? Glob. Food Sec. 17,
64–72 (2018).
Code availability 30. Fifanou, V. G., Ousmane, C., Gauthier, B. & Brice, S. Traditional agroforestry
The computer code that support the findings of this study is available in the systems and biodiversity conservation in Benin (West Africa). Agrofor. Syst.
Supplementary Information. 82, 1–13 (2011).
31. Keleman, A., Hellin, J. & Flores, D. Diverse varieties and diverse markets:
Received: 14 July 2020; Accepted: 18 February 2021; scale-related maize ‘profitability crossover’ in the central Mexican highlands.
Published: xx xx xxxx Hum. Ecol. 41, 683–705 (2013).
32. McCord, P. F., Cox, M., Schmitt-Harsh, M. & Evans, T. Crop diversification as
a smallholder livelihood strategy within semi-arid agricultural systems near
References Mount Kenya. Land Use Policy 42, 738–750 (2015).
1. Meyfroidt, P. Mapping farm size globally: benchmarking the smallholders 33. Jonsen, I. D. & Fahrig, L. Response of generalist and specialist insect
debate. Environ. Res. Lett. 12, 10–13 (2017). herbivores to landscape spatial structure. Landsc. Ecol. 12, 185–197 (1997).
2. Lowder, S. K., Skoet, J. & Raney, T. The number, size, and distribution of 34. Ahrenfeldt, E. J. et al. Pollinator communities in strawberry crops—variation
farms, smallholder farms, and family farms worldwide. World Dev. 87, at multiple spatial scales. Bull. Entomol. Res. 105, 497–506 (2015).
16–29 (2016). 35. Concepción, E. D., Fernandez-González, F. & Díaz, M. Plant diversity
3. Food Security and Nutrition in the World (FAO, 2018). partitioning in Mediterranean croplands: effects of farming intensity, field
4. Belfrage, K., Björklund, J. & Salomonsson, L. The effects of farm size and edge, and landscape context. Ecol. Appl. 22, 972–981 (2012).
organic farming on diversity of birds, pollinators, and plants in a Swedish 36. Bravo-Monroy, L., Tzanopoulos, J. & Potts, S. G. G. Ecological and social
landscape. Ambio 34, 582–588 (2005). drivers of coffee pollination in Santander, Colombia. Agric. Ecosyst. Environ.
5. Rosset, P. Re-thinking agrarian reform, land and territory in La Via 211, 145–154 (2015).
Campesina. J. Peasant Stud. 40, 721–775 (2013). 37. Horgan, F. G. Invasion and retreat: shifting assemblages of dung beetles
6. Borras, S. M. in Transnational Agrarian Movements Confronting Globalization amidst changing agricultural landscapes in central Peru. Biodivers. Conserv.
(Borras, S. M. et al.) 91–121 (Wiley-Blackwell, 2008). 18, 3519–3541 (2009).
7. Meas, T., Hu, W., Batte, M. T., Woods, T. A. & Ernst, S. Substitutes or 38. Schai-Braun, S. C. & Hacklander, K. Home range use by the European hare
complements? Consumer preference for local and organic food attributes. (Lepus europaeus) in a structurally diverse agricultural landscape analysed at
Am. J. Agric. Econ. 97, 1044–1071 (2015). a fine temporal scale. Acta Theriol. 59, 277–287 (2014).
8. Moon, W. & Pino, G. Do U.S. citizens support government intervention in 39. Lovell, S. T., Mendez, V. E., Erickson, D. L., Nathan, C. & DeSantis, S. Extent,
agriculture? Implications for the political economy of agricultural protection. pattern, and multifunctionality of treed habitats on farms in Vermont, USA.
Agric. Econ. 49, 119–129 (2018). Agrofor. Syst. 80, 153–171 (2010).
9. Altieri, M. A. Small Farms as a Planetary Ecological Asset: Five Key Reasons 40. Pekin, B. K. Anthropogenic and topographic correlates of natural vegetation
Why We Should Support the Revitalisation of Small farms in the Global South cover within agricultural landscape mosaics in Turkey. Land Use Policy 54,
(Third World Network, 2008). 313–320 (2016).
10. Konvicka, M., Benes, J. & Polakova, S. Smaller fields support more butterflies: 41. Chand, R., Prasanna, P. A. L. & Singh, A. Farm size and productivity:
comparing two neighbouring European countries with different understanding the strengths of smallholders and improving their livelihoods.
socioeconomic heritage. J. Insect Conserv. 20, 1113–1118 (2016). Econ. Polit. Wkly 54, 5–11 (2011).
11. Haji, J. Production efficiency of smallholders’ vegetable-dominated mixed 42. Dorward, A. Farm size and productivity in malawian smallholder agriculture.
farming system in eastern Ethiopia: a non-parametric approach. J. Afr. Econ. J. Dev. Stud. 35, 141–161 (1999).
16, 1–27 (2007). 43. Kremen, C. Reframing the land-sparing/land-sharing debate for biodiversity
12. Barrett, C. B., Bellemare, M. F. & Hou, J. Y. Reconsidering conventional conservation. Ann. NY Acad. Sci. 1355, 52–76 (2015).
explanations of the inverse productivity–size relationship. World Dev. 38, 44. Carletto, C., Savastano, S. & Zezza, A. Fact or artifact: the impact of
88–97 (2010). measurement errors on the farm size–productivity relationship. J. Dev. Econ.
13. Sen, A. K. An aspect of Indian agriculture. Econ. Wkly 14, 243–246 (1962). 103, 254–261 (2013).
14. Chayanov, A. V. V. The Theory of Peasant Cooperatives (Ohio State Univ. 45. Abay, K. A., Abate, G. T., Barrett, C. B. & Tanguy, B. Correlated non-classical
Press, 1926). measurement errors, ‘second best’ policy inference and the inverse size–
15. Otsuka, K., Liu, Y. & Yamauchi, F. Growing advantage of large farms in Asia productivity relationship in agriculture. J. Dev. Econ. 139, 171–184 (2019).
and its implications for global food security. Glob. Food Sec. 11, 5–10 (2016). 46. Hanesen, Z. K., Libecap, G. D., Hansen, Z. K. & Libecap, G. D. Small
16. Rada, N. E. & Fuglie, K. O. New perspectives on farm size and productivity. farms, externalities, and the Dust Bowl of the 1930s. J. Polit. Econ. 112,
Food Policy 84, 147–152 (2019). 665–694 (2004).
17. Smith, R. K., Jennings, N. V., & Harris, S. A quantitative analysis of the 47. Gurevitch, J., Koricheva, J., Nakagawa, S. & Stewart, G. Meta-analysis and the
abundance and demography of European hares Lepus europaeus in science of research synthesis. Nature 555, 175–182 (2018).
relation to habitat type, intensity of agriculture and climate. Mammal Rev. 35, 48. Garibaldi, L. A. et al. Policies for ecological intensification of crop
1–24 (2005). production. Trends Ecol. Evol. 34, 282–286 (2019).
18. Rudel, T. et al. Do smallholder, mixed crop-livestock livelihoods encourage 49. Laborde Debucquet, D., Murphy, S., Parent, M., Porciello, J. & Smaller, C.
sustainable agricultural practices? A meta-analysis. Land 5, 6 (2016). Ceres2030: Sustainable Solutions to End Hunger Summary Report
19. Cohn, A. S. et al. Smallholder agriculture and climate change. Annu. Rev. (International Institute for Sustainable Development (IISD), 2020); https://
Environ. Resour. 42, 347–375 (2017). hdl.handle.net/1813/72799
20. Graeub, B. E. et al. The state of family farms in the world. World Dev. 87, 50. Moher, D., Liberati, A., Tetzlaff, J. & Altman, D. G. Preferred reporting items
1–15 (2016). for systematic reviews and meta-analyses: the PRISMA statement. Br. Med. J.
21. Ebel, R. Are small farms sustainable by nature? Review of an ongoing 339, b2535 (2009).
misunderstanding in agroecology. Challenges Sustain. 8, 17–29 (2020). 51. Clark, M. & Tilman, D. Comparative analysis of environmental impacts of
22. De Koeijer, T. J., Wossink, G. A. A., Struik, P. C. & Renkema, J. A. Measuring agricultural production systems, agricultural input efficiency, and food choice.
agricultural sustainability in terms of efficiency: the case of Dutch sugar beet Environ. Res. Lett. 12, 064016 (2017).
growers. J. Environ. Manag. 66, 9–17 (2002). 52. Agresti, A. Categorical Data Analysis (Wiley, 2002).
23. Barrett, C. B., Bellemare, M. F. & Hou, J. Y. Reconsidering conventional 53. Christensen, R. H. B. Analysis of ordinal data with cumulative link
explanations of the inverse productivity size relationship. World Dev. 38, models—estimation with the R-package ordinal. R-package version 28 (2015).
88–97 (2010). 54. Becker, B. J. & Wu, M.-J. The synthesis of regression slopes in meta-analysis.
24. Sen, A. K. Size of holdings and productivity. Econ. Wkly 16, 323–326 (1964). Stat. Sci. 22, 414–429 (2007).
Nature Sustainability | www.nature.com/natsustainNaTure SusTainabiliTy Analysis
55. Viechtbauer, W. Conducting meta-analyses in R with the metafor package. 69. Deininger, K. & Byerlee, D. The rise of large farms in land abundant
J. Stat. Softw. https://www.jstatsoft.org/article/view/v036i03 (2015). countries: do they have a future? World Dev. 40, 701–714 (2012).
56. Rodríguez-Barranco, M., Tobías, A., Redondo, D., Molina-Portillo, E. & 70. Alene, A. D. & Hassan, R. M. The determinants of farm-level technical
Sánchez, M. J. Standardizing effect size from linear regression models with efficiency among adopters of improved maize production technology in
log-transformed variables for meta-analysis. BMC Med. Res. Methodol. 17, western Ethiopia. Agrekon 42, 1–14 (2003).
44 (2017). 71. Stifel, D. & Minten, B. Isolation and agricultural productivity. Agric. Econ. 39,
57. Batte, M. T. & Ehsani, M. R. The economics of precision guidance with 1–15 (2008).
auto-boom control for farmer-owned agricultural sprayers. Comput. Electron. 72. Rada, N., Wang, C. & Qin, L. Subsidy or market reform? Rethinking China’s
Agric. 53, 28–44 (2006). farm consolidation strategy. Food Policy 57, 93–103 (2015).
58. Ouin, A. & Burel, F. Influence of herbaceous elements on butterfly diversity
in hedgerow agricultural landscapes. Agric. Ecosyst. Environ. 93, 45–53 (2002).
59. Brown, P. W. & Schulte, L. A. Agricultural landscape change (1937–2002) in Acknowledgements
We acknowledge funding from the University of British Columbia 4-Year Doctoral
three townships in Iowa, USA. Landsc. Urban Plan. 100, 202–212 (2011).
Fellowship & Social Sciences and Humanities Research Council (SSHRC) Insight grant
60. Teshome, A., Patterson, D., Asfaw, Z., Dalle, S. & Torrance, J. K. Changes of
no. 435-2016-0154.
Sorghum bicolor landrace diversity and farmers’ selection criteria over space
and time, Ethiopia. Genet. Resour. Crop Evol. 63, 55–77 (2016).
61. Gedebo, A., Appelgren, M., Bjornstad, A. & Tsegaye, A. Analysis of Author contributions
indigenous production methods and farm-based biodiversity of amochi V.R., N.R. and H.W. conceived the idea and designed the data collection process. V.R.
(Arisaema schimperian, Schott) in two sub-zones of Southern Ethiopia. Genet. collected and coded the data. V.R., Z.M. and N.R. designed the analysis. V.R. and Z.M.
Resour. Crop Evol. 54, 1429–1436 (2007). conducted the analysis. V.R., Z.M., N.R., H.W. and D.J. contributed interpretations of
62. Assunção, J. J. & Braido, L. H. B. Testing household-specific explanations for results. All authors wrote the paper.
the inverse productivity relationship. Am. J. Agric. Econ. 89, 980–990 (2007).
63. Altman, D. G. et al. Predictors of crop diversification: a survey of tobacco
farmers in North Carolina (USA). Tob. Control 7, 376–382 (1998). Competing interests
The authors declare no competing interests.
64. Külekçi, M. Technical efficiency analysis for oilseed sunflower farms: a case
study in Erzurum, Turkey. J. Sci. Food Agric. 90, 1508–1512 (2010).
65. Latruffe, L., Balcombe, K., Davidova, S. & Zawalinska, K. Technical and scale Additional information
efficiency of crop and livestock farms in Poland: does specialization matter? Supplementary information The online version contains supplementary material
Agric. Econ. 32, 281–296 (2005). available at https://doi.org/10.1038/s41893-021-00699-2.
66. Ullah, A. & Perret, S. R. Technical- and environmental-efficiency analysis of
irrigated cotton-cropping systems in Punjab, Pakistan using data envelopment Correspondence and requests for materials should be addressed to V.R.
analysis. Environ. Manag. 54, 288–300 (2014). Peer review information Nature Sustainability thanks Michael Clark and the other,
67. Binici, T., Zulauf, C. R., Kacira, O. O. & Karli, B. Assessing the efficiency anonymous, reviewer(s) for their contribution to the peer review of this work.
of cotton production on the Harran Plain, Turkey. Outlook Agric. 35, Reprints and permissions information is available at www.nature.com/reprints.
227–232 (2006).
68. Deininger, K., Zegarra, E. & Lavadenz, I. Determinants and impacts of Publisher’s note Springer Nature remains neutral with regard to jurisdictional claims in
rural land market activity: evidence from Nicaragua. World Dev. 31, published maps and institutional affiliations.
1385–1404 (2003). © The Author(s), under exclusive licence to Springer Nature Limited 2021
Nature Sustainability | www.nature.com/natsustainYou can also read