Housing Price and Interest Rate Hike: A Tale of Five Cities in Australia

Page created by Ian Walton
 
CONTINUE READING
Housing Price and Interest Rate Hike: A Tale of Five Cities in Australia
Journal of
             Risk and Financial
             Management

Article
Housing Price and Interest Rate Hike: A Tale of Five Cities
in Australia
Fennee Chong

                                         Department of Accounting and Finance, Charles Darwin University, Casuarina, NT 0810, Australia;
                                         fen.chong@cdu.edu.au

                                         Abstract: Australian housing prices are reported to be overvalued and unaffordable for the past
                                         two decades. Many researchers and practitioners have attributed the persistent growth in housing
                                         prices to the prolonged period of low borrowing costs. However, due to inflationary pressure, the
                                         Central Bank has raised its cash rate consecutively in recent months. This paper aims to examine
                                         whether interest rate rises affect housing price in different parts of Australia. Evidence generated
                                         from the analysis reported bipolar results between the large and smaller cities, whereby housing
                                         prices in Sydney and Melbourne show a significant negative relationship with interest rate changes
                                         while Brisbane and the Gold Coast and Perth and Adelaide, respectively, are showing negative but
                                         insignificant results during the study period. Short-run trend projections on housing prices indicate
                                         that Sydney, Melbourne, Brisbane and the Gold Coast are on a downward trend while Adelaide and
                                         Perth will maintain its current momentum before plateauing out later next year. Likewise, control
                                         variables, such as oil prices, inflation rate and stock market performance, are found to be related
                                         to housing prices in larger cities only. These findings have implications on housing policy, house
                                         purchase decisions and investment portfolio management strategy.

                                         Keywords: housing price; interest rate; oil price; stock market

                                         1. Introduction
Citation: Chong, Fennee. 2023.
                                              According to the OECD Report (2004) and Cox (2021) in Demographia International
Housing Price and Interest Rate Hike:
                                         Housing Affordability 2021, Australian housing prices are overvalued and unaffordable.
A Tale of Five Cities in Australia.
Journal of Risk and Financial
                                         These reports indicated a 51.8 percent and 40 percent overvaluation in 2004 and 2021,
Management 16: 61. https://doi.org/
                                         respectively. The ratios of house prices to incomes and rents are also at the highest quantile
10.3390/jrfm16020061                     of the OECD countries since 2003. In terms of affordability, Cox (2021) indicated that the
                                         median multiple of national house prices to household income was 6.4 times in Australia
Academic Editor: Rafael
                                         compared to the US’s 3.7 and UK’s 4.6 times in 2016. In the third quarter of 2021, the
González-Val
                                         national house price to household income ratio deteriorated to 12.1 times to become
Received: 15 December 2022               severely unaffordable comparing to 5.1 times in UK and 5.0 times in the US (Cox 2022).
Revised: 15 January 2023                 In Sydney, it was 15.3 times, Melbourne 9.7 times, Adelaide 8 times, Perth 7.1 times and
Accepted: 16 January 2023                Brisbane 7.4 times, respectively. Generally, all five Australian major cities are in the severely
Published: 18 January 2023               unaffordable category. Sydney has become the second least affordable metropolitan in
                                         the world after Hong Kong. This overvaluation and severe unaffordability concur with
                                         increases in debt-to-income ratio, place Australia’s housing at the top quantile of the
                                         OECD countries. A recent study on the Australian housing market by Cho et al. (2021)
Copyright:     © 2023 by the author.     asserts that the steadily increasing housing prices have attributed to a steady decline of
Licensee MDPI, Basel, Switzerland.
                                         home ownership. Additionally, they also found that the fundamental housing prices of all
This article is an open access article
                                         Australian cities are significantly overvalued. Melbourne and Sydney had their housing
distributed under the terms and
                                         prices overvalued for the last two decades. The authors content that the near zero interest
conditions of the Creative Commons
                                         rate was one of the variables that affects the fundamental prices of the housing in Australia.
Attribution (CC BY) license (https://
                                              Figure 1 presents the development of Australia housing prices from 1996 to 2021. As
creativecommons.org/licenses/by/
4.0/).
                                         can be seen from this figure, housing prices have surpassed the performance of GDP per

J. Risk Financial Manag. 2023, 16, 61. https://doi.org/10.3390/jrfm16020061                                   https://www.mdpi.com/journal/jrfm
J. Risk Financial Manag. 2023, 16, x FOR PEER REVIEW                                                                                            2 of 13

J. Risk Financial Manag. 2023, 16, 61                                                                                                            2 of 13

                                              Figure 1 presents the development of Australia housing prices from 1996 to 2021. As
                                        can be seen from this figure, housing prices have surpassed the performance of GDP per
                                         capital in the past
                                        capital          pastfewfewyears.
                                                                     years.Since
                                                                             SincethetheGlobal
                                                                                          Global Financial
                                                                                                   FinancialCrisis  (GFC)
                                                                                                               Crisis  (GFC)in 2008,  researchers
                                                                                                                                in 2008,  researchersand
                                         industry
                                        and         analysts
                                               industry         have been
                                                           analysts   have predicting     an imminent
                                                                             been predicting               housinghousing
                                                                                                   an imminent        market meltdown.        Nonethe-
                                                                                                                                 market meltdown.
                                         less, in the absence
                                        Nonetheless,     in the of  a prominent
                                                                  absence           trigger, the
                                                                           of a prominent          housing
                                                                                                trigger, the market
                                                                                                              housingcrash
                                                                                                                         marketpredictions   remains a
                                                                                                                                   crash predictions
                                         common      subject   of talk until  recently.   In  the  past decade,    despite   being
                                        remains a common subject of talk until recently. In the past decade, despite being over-     overvalued     and
                                         coupled   with   high  debt-to-income     ratio,  mortgage    stress remains    insignificant
                                        valued and coupled with high debt-to-income ratio, mortgage stress remains insignificant         due  to  record
                                         lowto
                                        due    interest
                                                 recordrates.     An easing
                                                          low interest   rates.ofAn
                                                                                  monetary
                                                                                      easing ofpolicy   offerspolicy
                                                                                                  monetary       liquidity
                                                                                                                       offerstoliquidity
                                                                                                                                the market     whilst
                                                                                                                                           to the  mar-a
                                         contracting
                                        ket  whilst a monetary
                                                        contractingpolicy    works
                                                                       monetary        in theworks
                                                                                    policy     opposite   direction.
                                                                                                      in the  opposite  The   historical
                                                                                                                          direction.   Thelow   interest
                                                                                                                                             historical
                                         rate interest
                                        low    was onerate
                                                         of the  keyone
                                                               was    factors that
                                                                         of the  keydrove   housing
                                                                                       factors         prices housing
                                                                                                 that drove    to greaterprices
                                                                                                                           heightsto (Cho
                                                                                                                                     greateret al. 2021).
                                                                                                                                               heights
                                         However,     the  recent  surge  in inflation   rate  has  prompted     the  Reserve
                                        (Cho et al. 2021). However, the recent surge in inflation rate has prompted the Reserve Bank   of Australia    to
                                         increase  its cash   rate each  month   since   May   2022.  These   moves    drive  mortgage
                                        Bank of Australia to increase its cash rate each month since May 2022. These moves drive           rates  higher.
                                         The current
                                        mortgage        high
                                                     rates     inflation
                                                             higher.  Theand   growing
                                                                           current    highmortgage
                                                                                             inflationrates
                                                                                                        and environment
                                                                                                              growing mortgage has put   homeowners
                                                                                                                                       rates  environ-
                                         and   investors   into a  new  and  uncertain    situation.   With  that  in
                                        ment has put homeowners and investors into a new and uncertain situation. Withmind,   the  main   objectives   of
                                                                                                                                                 that in
                                         this study   are:
                                        mind, the main objectives of this study are:
                                         (i) To
                                        (i)     Toassess
                                                    assesswhether
                                                            whetherthe
                                                                     theincrease
                                                                           increasein
                                                                                    inmortgage
                                                                                       mortgagerate,
                                                                                                   rate,as
                                                                                                         asaaresult
                                                                                                              resultof
                                                                                                                    of the
                                                                                                                        the increases
                                                                                                                             increases in
                                                                                                                                        in cash
                                                                                                                                           cash
                                                rate  implemented    by   the Central  Bank,  has  a significant impact   on  the
                                               rate implemented by the Central Bank, has a significant impact on the persistently persistently
                                                risinghousing
                                               rising   housingprices
                                                                 pricesininthe
                                                                            thedifferent
                                                                                differentcities
                                                                                          citiesin
                                                                                                 inAustralia.
                                                                                                    Australia.
                                         (ii) To examine whether the increase in mortgage rates affects housing prices in different
                                        (ii) To examine whether the increase in mortgage rates affects housing prices in different
                                                cities differently.
                                               cities differently.
                                         (iii) To examine whether other factors, such as oil price, which influences inflation and eco-
                                        (iii) To examine whether other factors, such as oil price, which influences inflation and
                                                nomic growth and stock prices which represent an alternative investment, influence
                                               economic growth and stock prices which represent an alternative investment, influ-
                                                housing prices.
                                               ence housing prices.

                                        Figure
                                        Figure1.1.Development
                                                   Developmentofof
                                                                 Australia Housing
                                                                   Australia       Price,
                                                                             Housing      1996–2021.
                                                                                     Price,          Source:
                                                                                             1996–2021. Source: https://www.oecd.org/
                                        https://www.oecd.org/housing/data/affordable-housing-database/housing-market.htm; accessed
                                        housing/data/affordable-housing-database/housing-market.htm; accessed on 3 September   2022.
                                        on 3 September 2022
                                               The remaining of the article is structured as follows: Sections 2 and 3 explores the back-
                                              Theand
                                         ground     remaining
                                                        related of   the article
                                                                 literature      is structured
                                                                             while               as follows: Sections
                                                                                    data and methodology                 2 and 3 explores
                                                                                                                will be discussed  in Sectionthe4,
                                        background
                                         findings andand     related literature
                                                         discussions              while
                                                                        in Sections      data
                                                                                     5 and     and methodology
                                                                                            6 presents               will be discussed in Sec-
                                                                                                        the conclusion.
                                        tion 4, findings and discussions in Sections 5 and 6 presents the conclusion.
                                         2. Background
                                        2. Background
                                               Information gathered from OECD and Demographia indicates that Australia’s housing
                                         market    has beengathered
                                              Information     overheated fromand  overpriced
                                                                               OECD             the past twenty
                                                                                        and Demographia            years.
                                                                                                             indicates  thatStrong demand
                                                                                                                             Australia’s  hous-on
                                         housing    was  not only   generated   by  those who    are buying   a home   but also
                                        ing market has been overheated and overpriced the past twenty years. Strong demand on   from  investors.
                                         Furthermore,
                                        housing    was notinvestors’   willingness
                                                            only generated           to pay
                                                                               by those     beyond
                                                                                          who         the fundamental
                                                                                               are buying   a home butvalue     can be
                                                                                                                          also from     another
                                                                                                                                     investors.
                                         factor  that has  driven   housing   prices  high.  Bubbles   are usually  formed   when
                                        Furthermore, investors’ willingness to pay beyond the fundamental value can be another      asset prices
                                         are rapidly   increase   beyond    fundamental     values   and  become   unsustainable.
                                        factor that has driven housing prices high. Bubbles are usually formed when asset prices     The  rise in
                                         property prices is driven by the market’s expectations or average beliefs about future
                                         price trends (Keynes 1936; Dovman et al. 2012). Information made available, particularly
are rapidly increase beyond fundamental values and become unsustainable. The rise in
                    property prices is driven by the market’s expectations or average beliefs about future price
J. Risk Financial Manag.       16, 61
                         2023,(Keynes
                    trends              1936; Dovman et al. 2012). Information made available, particularly mac-                                         3 of 13
                    roeconomic variables and policy changes related to the housing industry can influence
                    market expectations as well.
                          Researchers     and practitioners
                                      macroeconomic                  positand
                                                              variables       that   factors
                                                                                  policy        that could
                                                                                            changes    relatedattribute      to a property
                                                                                                                 to the housing      industry can influence
                    crash are recession,
                                      market  a expectations
                                                 surge in interest        rates or oversupply. By definition, when a crash
                                                                    as well.
                    happen, housing value          would fall
                                             Researchers        and at practitioners
                                                                       least 20 percent        market
                                                                                           posit   that wide.
                                                                                                         factorsInthata recession,     higher to a property
                                                                                                                           could attribute
                    unemploymentcrash   rate leads     to high default
                                               are recession,       a surgerates     and thisrates
                                                                                in interest       debtorservicing
                                                                                                           oversupply.stressBycauses    hous- when a crash
                                                                                                                                 definition,
                    ing market plunges,
                                      happen,   similar
                                                   housing to the
                                                                valueonewould
                                                                           that happened
                                                                                    fall at leastin20the   previous
                                                                                                        percent         GFC.
                                                                                                                   market       The In
                                                                                                                              wide.    unem-
                                                                                                                                          a recession, higher
                    ployment rate at the time of this study is low at 3.4%; therefore, it is unlikely that Australiacauses housing
                                      unemployment           rate  leads   to  high    default   rates  and   this  debt  servicing    stress
                    is going into a market
                                       recession plunges,
                                                     soon. similar
                                                              Housing    to oversupply
                                                                            the one that couldhappened      in the previous
                                                                                                       be another     factor but GFC.
                                                                                                                                    the The
                                                                                                                                         con-unemployment
                    stant insufficientratesupply
                                            at the time    of this
                                                     of land     andstudy     is low
                                                                       the lack     of at 3.4%; therefore,
                                                                                        builders               it is unlikely
                                                                                                    in Australia      have ruledthatoutAustralia
                                                                                                                                          this is going into
                    possibility.      a recession soon. Housing oversupply could be another factor but the constant insufficient
                                      supply
                          In Australia,          of land and
                                           the mortgage           therefers
                                                                rate    lack ofto builders
                                                                                   the 3-year  in bank
                                                                                                   Australia    haverate
                                                                                                          lending      ruled
                                                                                                                           for out
                                                                                                                                housethisbuy-
                                                                                                                                           possibility.
                                             In  Australia,     the  mortgage       rate  refers   to the
                    ers. As can be seen from the graph (Figure 2), mortgage rates have been on a downward  3-year   bank    lending    rate  for house buyers.
                                      As  can    be  seen   from    the  graph     (Figure    2), mortgage
                    trend from its highest at 17 percent in 1990 to below 6 percent from 2013 until mid-2022.   rates  have    been   on  a downward     trend
                                      from    its highest      at 17  percent      in  1990   to  below
                    The lowest mortgage rate was 2.07 percent per annum offered by Bankwest in November    6 percent     from   2013    until  mid-2022.   The
                    2020. In 2016, lowest
                                      the cash  mortgage       rate was 2.07
                                                    rate in Australia        waspercent
                                                                                     reduced  pertoannum      offered
                                                                                                      1.5 percent       by maintained
                                                                                                                      and    Bankwest inat    November 2020.
                                      In 2016, the
                    historical low between         0.10cash    rate in
                                                          percent    to Australia
                                                                         1.5 percent    was
                                                                                          fromreduced
                                                                                                  August  to 2016
                                                                                                             1.5 percent     and2022.
                                                                                                                    until July     maintained
                                                                                                                                         This at historical
                    is beneficial tolow     betweenborrowers
                                        mortgage         0.10 percent  as to
                                                                           it 1.5
                                                                               keepspercent    from August
                                                                                         the borrowing           2016
                                                                                                              cost      until
                                                                                                                     low.      July 2022.
                                                                                                                            However,         This is beneficial
                                                                                                                                          this
                                      to mortgage       borrowers       as  it keeps    the   borrowing
                    more conducive borrowing environment has resulted in a steady growth of the aggregate    cost  low.   However,      this  more conducive
                                      borrowing       environment         has   resulted     in a steady
                    borrowing from AUD 64.9 billion to 1413.6 billion for owner occupied home and an in-    growth     of the  aggregate      borrowing from
                                      AUD     64.9   billion  to  1413.6   billion    for owner     occupied    home
                    crease from 10.5 billion to 696.9 billion for investor housing from 1990 to 2022, respectively       and  an  increase    from 10.5 billion
                    (see Figure 3).   to 696.9    billion   for  investor     housing      from   1990   to 2022,    respectively     (see  Figure  3).

                    Figure 2. Mortgage rates (1990–2022). (Data Source: Reserve Bank of Australia, accessed on 3 Sep-
                                   Figure 2. Mortgage rates (1990–2022). (Data Source: Reserve Bank of Australia, accessed on 3
                    tember 2022). Note: Dashed line indicates that mortgage rate is on a downward trend.
                                   September 2022). Note: Dashed line indicates that mortgage rate is on a downward trend.
J. Risk2023,
Financial Manag.   Financial
                         16, xManag.       16, 61
                                     2023,REVIEW
                               FOR PEER                                                                                        4 of 13           4 of 13
k Financial Manag. 2023, 16, x FOR PEER REVIEW                                                                                  4 of 13

                              Figure
                               Figure3.3.Aggregate borrowing
                                              Figure
                                          Aggregate          (in
                                                               (inlog)
                                                     3. Aggregate
                                                    borrowing       log)(1990–2022).
                                                                   borrowing    (in log) (1990–2022).
                                                                          (1990–2022).

                                    Nevertheless,   the
                                                     theCentral
                                                          Centralbank
                                      Nevertheless,Nevertheless,     the had
                                                                   bank    hadreversed
                                                                         Central   bank from
                                                                                reversed  had
                                                                                           from itsitsexpansionary
                                                                                               reversed              monetary
                                                                                                                       monetarypolicy
                                                                                                            from its expansionary
                                                                                                       expansionary                  monetary policy
                                                                                                                                  policy
                              due   to the escalating
                                              due  to  inflation
                                                      the         happening
                                                           escalating  inflationworldwide,
                                                                                   happening   including
                                                                                                 worldwide,  Australia  (see
                                                                                                                 including
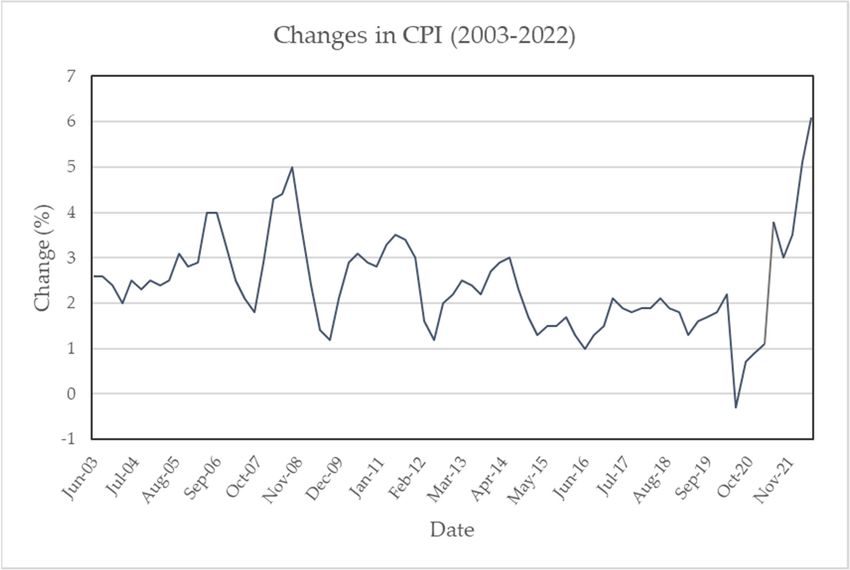
                                due to the escalating inflation happening worldwide, including Australia (see Figure 4).     Figure  4).
                                                                                                                             Australia   (see Figure 4).
                              InInresponding
                                   responding  to
                                              Intothe sudden
                                                 responding     surge
                                                   the suddentosurge   of  the
                                                                  the sudden   inflation  rate,
                                                                                 surge of the
                                                                         of the inflation       the    Reserve
                                                                                           rate,inflation       Bank
                                                                                                            rate, Bank
                                                                                                  the Reserve         of Australia
                                                                                                                  the Reserve       has
                                                                                                                               Bank has
                                                                                                                       of Australia   of Australia has
                              increased   cash rate for
                                              increased  25 basis
                                                          cash    point
                                                                rate for in
                                                                         25  May
                                                                             basis2022,
                                                                                   point followed
                                                                                          in May       by another
                                                                                                      2022,        four
                                                                                                            followed  by 50 basis
                                                                                                                          another point
                                increased cash rate for 25 basis point in May 2022, followed by another four 50 basis point50 basis point
                                                                                                                                   four
                              ininJune,
                                   June,July,
                                         July,August
                                              in June,and
                                               August    andSeptember
                                                        July, August
                                                              Septemberand2022.
                                                                             September 2022.
                                                                            2022.

                              Figure
                                Figure4.4.Changes  ininCPI
                                               Figure
                                           Changes         (Quarterly,
                                                          Changes
                                                       4.CPI (Quarterly,2003–2022).
                                                                    in CPI (Quarterly,(Data
                                                                         2003–2022).   (Datasource:
                                                                                       2003–2022).  https://www.abs.gov.au;
                                                                                                   (Data
                                                                                             source:                        accessed
                                                                                                         source: https://www.abs.gov.au;
                                                                                                     https://www.abs.gov.au; accessed accessed on
                              onon3 3September
                                      September2022).
                                                 2022).
                                               3 September    2022).
                                    Ambrose
                                      Ambroseetetal.al.
                                                      (2013),
                                                        (2013),inintheir study
                                                                           studyon    Amsterdam’s     housing prices,
                                                                                                                  prices,provided    evi-
                              dence   that  an      Ambrose
                                                overheated       et their
                                                                     al. (2013),
                                                               housing    market
                                                                                    on
                                                                                    in Amsterdam’s
                                                                                       their
                                                                                     does  notstudy  onhousing
                                                                                                         Amsterdam’s
                                                                                                necessarily  readjust  or
                                                                                                                          provided
                                                                                                                           housing
                                                                                                                            end   with
                                                                                                                                      evi- provided
                                                                                                                                      prices,
                                                                                                                                        a
                                dence that an    overheated
                                              evidence     that housing     market
                                                                an overheated         does
                                                                                    housing not  necessarily
                                                                                              marketpolicy.
                                                                                                      does not readjust   or
                                                                                                                 necessarily  end
                                                                                                                                readjust aor end with a
                                                                                                                                   with
                              crash.  A soft landing
                                crash. A soft crash.
                                               landing  is possible   with  a fitting  government             It would   be  interesting
                                                       A is possible
                                                          soft landing with   a fittingwith
                                                                         is possible    government     policy. It would
                                                                                             a fitting government          be interesting
                                                                                                                      policy.  It would be interesting
                              totosee
                                   see how the Australian housing market flares in a high inflation and risinginterest
                                      how  the  Australian   housing    market    flares in a high  inflation and  rising    interestrate
                                                                                                                                      rate
                              environment.
                                environment.
J. Risk Financial Manag. 2023, 16, 61                                                                                           5 of 13

                                        to see how the Australian housing market flares in a high inflation and rising interest
                                        rate environment.

                                        3. Literature Review
                                              Australia’s total housing value was estimated at AUD10.1 trillion in March 2022
                                        (Australia Bureau of Statistics 2022), more than its total GDP at AUD 14,147 million as
                                        at June 2022. This informs the significance of the housing market in determining the
                                        financial stability of the economy. Numerous researchers have documented the importance
                                        of influencing housing prices through different government measures to maintain a healthy
                                        economy. Monetary policies and fiscal policies are the popular channels used to achieve
                                        this objective. Generally, it is accepted that a tightening monetary policy would help to
                                        curb an overheating housing market to prevent a housing crush (Williams 2016; Torre
                                        2016). This is supported by Xu and Tang’s (2014) study which found that interest rate is
                                        negatively related to housing price in the UK 1971–2012. Chong and Liew (2020) studied
                                        the New Zealand housing market from 2009 and 2019 assert that mortgage rate is negatively
                                        related to housing prices, both in the short and long run. Studies by Upadhyaya et al.
                                        (2017) confirm the influential power of interest rates on housing price in the U.S whilst
                                        Zhang et al. (2018) report that, under a high money supply setting, there is a tendency
                                        for investors to bid, offer and trade significantly higher for houses than in a low money
                                        supply environment. Cho et al. (2021) studied the housing affordability in Australia and
                                        postulate that the deteriorating housing affordability and the deviation of housing prices
                                        from fundamental value in the past two decades are driven by low interest rates. As
                                        housing supply can be inelastic in the short to medium terms, lower interest rates lead to
                                        higher housing prices due to a higher demand.
                                              Conversely, some studies contend that changes in monetary policy were not trans-
                                        mitted to housing prices. Dreger and Wolters (2011) posit that the association between
                                        expansionary monetary policy and housing prices are not significant while Cohen and
                                        Karpaviciute (2017) posit that interest rates are not a determinant of housing prices in
                                        Lithuania for 2005–2015. Tsai’s (2013) study on the UK market asserts that housing price
                                        increases under an expansionary monetary policy but market failed to react to a contract-
                                        ing monetary policy. A recent study by Yin et al. (2020) examines the impact of money
                                        supply (M2) and interest rate on housing prices in China. They contend that money supply
                                        affects housing prices positively in the medium run. On the other hand, monetary policy
                                        transmission via interest rate is not effective in China’s housing market.
                                              In addition to interest rates, many researchers argue that housing prices and stock
                                        prices are interrelated as they are investment alternatives. An increase in stock prices
                                        might motivates investors to rebalance their portfolio by holding more houses while
                                        an increase in housing price will encourage investments in stocks (Bayer et al. 2013).
                                        Upadhyaya et al. (2017) contend that there is a bilateral relationship between stock prices
                                        and housing prices. Nonetheless, an earlier study by Fereidouni (2010) posits that there is
                                        no significant relationship between stock market performance and housing prices.
                                              Oil price is another macroeconomic variable that could explain house price movements.
                                        In economies that rely on oil revenue (oil exporting countries), an increase in oil price will
                                        inject more investment into the housing market and lead to an increase in housing prices
                                        (Fereidouni 2010). Grossman et al. (2019) studied the effect of oil price shocks on housing
                                        prices in Texas (a major oil production centre) and contend that an oil price shock has the
                                        highest pass-through among oil-dependent cities. Australia is an oil importing country.
                                        An increase in oil prices will trigger higher logistic cost and lead to increases in the price
                                        of products and services. A high CPI induces rate hikes. Under this scenario, family
                                        expenditure increases, savings are reduced, and this can put pressure on the housing
                                        industry. If the growth in salary is slower than inflation, consumers will suffer from a loss
                                        in purchasing power. This could impact housing prices negatively. However, there are
                                        opposite forces at work as well. As oil prices are determined by the supply and demand
                                        forces, the easing of COVID-19 led to higher mobility and, therefore, higher demand. The
J. Risk Financial Manag. 2023, 16, 61                                                                                          6 of 13

                                        Ukraine war also caused oil supply disruption shock. All these factors instigated higher
                                        oil price which were passed on to industry and consumers. In the context of housing
                                        industry, a higher oil price leads to higher building material costs which will bring about
                                        higher housing prices. Nonetheless, if wages are not keeping up, housing affordability
                                        will deteriorate and this would affect housing prices negatively. Hence, based on the
                                        discussions above, the impact of oil prices on housing price is mixed and inconclusive.

                                        4. Methodology
                                              In this study, intraday data spanning from September 2021 to September 2022 on
                                        housing index are sourced from CoreLogic, Australia. The data covers the five cities
                                        Sydney, Melbourne, Brisbane and Gold Coast, Adelaide and Perth. Data for mortgage rates,
                                        crude oil WTI and ASX 200 index were collected from Yahoo Finance, Reserve Bank of
                                        Australia and Australia Bureau of Statistics (2022). This data range was chosen as more
                                        dynamics in borrowing rates were exhibited during this period. Prior to this study period,
                                        mortgage rates had been unchanged for many years at an historical low (see Figure 2).
                                              Based on the background information of the Australian housing market and the
                                        literature review discussed earlier, the research questions of this study are:
                                        (i)   Do increases in mortgage rate as a result of the increases in cash rate implemented
                                              by the Central Bank have significant impact on housing prices in different cities in
                                              Australia?
                                        (ii) Do increases in mortgage rates affect housing price in different cities differently?
                                        (iii) Are there any associations between factors, such as oil price and stock market perfor-
                                              mance, and housing prices?
                                              As the time series data for housing indexes are not normally distributed after log
                                        transformation, nonparametric statistical tests including Spearman’s correlation and Boot-
                                        strap regression are used to analyse and provide answers for the above questions. These
                                        statistical tests are discussed below.

                                        4.1. Spearman’s Rank Correlation
                                             Spearman correlation coefficient is a nonparametric rank statistic designed to measure
                                        the strength of association between two variables. This testing statistic assesses the extent
                                        of an arbitrary monotonic function which depicts the relationship between two variables
                                        with no further assumption being made about the frequency distribution (Zhang 2021).
                                        As the dataset for this study meets all the key assumptions required for the Spearman
                                        correlation test, it was used to gauge the association between variables in this study. The
                                        Spearman correlation coefficient can be defined as follows:

                                                                                       6∑ d2i
                                                                            ρ = 1−
                                                                                     n( n2 − 1)

                                        ρ = Spearman’s rank correlation coefficient;
                                        di = difference between the two ranks of each observation;
                                        n = number of observations.
                                             Whereby, ρ equals to +1 implies a perfect correlation between ranks and −1 indicates
                                        perfect negative correlation between ranks, while 0 means no correlation between ranks.

                                        4.2. Bootstrap Regression
                                              Bootstrapping regression model is another nonparametric approach used in this study
                                        as it does not require distributional assumptions. According to Cline (2019), bootstrapping
                                        analysis is asymptotically consistent and more accurate than using the standard intervals
                                        obtained using sample variance and the assumption of normality. Applying this analysis
J. Risk Financial Manag. 2023, 16, 61                                                                                                                    7 of 13

                                                               method, the daily data collected from September 2021 to September 2022 were resampled
                                             to
k Financial Manag. 2023, 16, x FOR PEER REVIEW                  perform the regression models stated below with 2000 bootstrap samples.
                                                                                                                                   7 of 13

                                                                                               HPI (Y) = α + βX1 + βX2 + βX3 + ε
                                                 where Y = Sydney
                                                            where or
                                                                   Y=Melbourne,
                                                                      Sydney or Brisbane andBrisbane
                                                                                Melbourne,   Gold Coast,
                                                                                                     and Perth, Adelaide
                                                                                                         Gold Coast,     housing
                                                                                                                     Perth,      price
                                                                                                                            Adelaide housing price
                                                 index       index
                                                 X1 = MortgageX1 rate;
                                                                  = Mortgage rate;
                                                 X2 = WTI Crude
                                                              X2 =Oil
                                                                    WTIIndex;
                                                                         Crude Oil Index;
                                                 X3 = ASX 200Xindex    performance;
                                                                3 = ASX 200 index performance;
                                                 ε = Error term.
                                                              ε = Error term.

                                                 5. Analysis and    Findings
                                                               5. Analysis    and Findings
                                                               5.1.Statistics
                                                 5.1. Descriptive   Descriptive Statistics
                                                      Line graphs Line
                                                                    of thegraphs
                                                                             housingof the
                                                                                       valuehousing
                                                                                               index value
                                                                                                       for theindex   for thecities
                                                                                                                five major     five under
                                                                                                                                    major cities
                                                                                                                                            studyunder
                                                                                                                                                   and thestudy and the
                                                               national  aggregate    are  depicted   in  Figure  5. From    the figure,
                                                 national aggregate are depicted in Figure 5. From the figure, Sydney is outperforming allSydney   is outperforming   all
                                                               other cities  and  the  national    aggregate.    It shows    a decline  after
                                                 other cities and the national aggregate. It shows a decline after reaching its peak at 215 on reaching  its peak at 215
                                                               on May 2022.
                                                 May 2022. Melbourne       beingMelbourne
                                                                                  the secondbeinglargestthe  second
                                                                                                          city has thelargest
                                                                                                                        second city  has the
                                                                                                                                  highest     secondvalue
                                                                                                                                            housing    highest housing
                                                 after Sydneyvalue   after Sydney
                                                                and displays          and displays
                                                                                a similar              a similar
                                                                                            trend to that         trend to
                                                                                                            of Sydney        that of
                                                                                                                         during      Sydney
                                                                                                                                   the study during
                                                                                                                                               period. the
                                                                                                                                                        Ad-study period.
                                                 elaide ranked Adelaide
                                                                 third in ranked
                                                                           terms ofthird   in terms
                                                                                      housing    priceofand
                                                                                                         housing    price
                                                                                                              displays     and displays
                                                                                                                        strong             strong
                                                                                                                                 growth with     nogrowth
                                                                                                                                                    sign ofwith no sign
                                                 decline duringof decline
                                                                  the study during
                                                                              period.theBrisbane
                                                                                          study period.
                                                                                                   and Gold Brisbane   and Gold
                                                                                                                Coast ranked        Coast
                                                                                                                                 fourth  in ranked
                                                                                                                                            the chartfourth
                                                                                                                                                       with in the chart
                                                 a steep growth until mid-August 2022. On the other hand, Perth’s housing was rather was rather
                                                               with a steep   growth   until  mid-August      2022.  On  the  other  hand,  Perth’s  housing
                                                               stable andthe
                                                 stable and represents      represents   the mostofaffordable
                                                                               most affordable                    of thecities
                                                                                                      the five major      five major
                                                                                                                               under cities
                                                                                                                                       study.under study.

                                                                                  Housing Value Index
                                                                                  (Sept 2021–Sept 2022)

                                                 220

                                                 200
                           Housing Value Index

                                                 180

                                                 160

                                                 140

                                                 120

                                                 100

                                                  80

                                                                                                 Date
                                                       HVI Sydney                         HVI Melbourne                     HVI Brisbane & Gold Coast
                                                       HVI Adelaide                       HVI Perth                         Aggregate

                                                 Figure 5. Housing Value
                                                              Figure     Index for
                                                                     5. Housing    the Index
                                                                                Value  national
                                                                                             foraggregate, Sydney,
                                                                                                 the national      Melbourne,
                                                                                                              aggregate, Sydney,Brisbane and Brisbane
                                                                                                                                 Melbourne,  Gold     and Gold
                                                 Coast, Adelaide and Perth.
                                                              Coast, Adelaide and Perth.

                                                 5.2. Spearman’s Rho Correlation Analysis
                                                      Results of the correlation analysis performed using Spearman’s rho rank correlation
                                                 are as shown in Table 1 below.
J. Risk Financial Manag. 2023, 16, 61                                                                                                                  8 of 13

                                        5.2. Spearman’s Rho Correlation Analysis
                                             Results of the correlation analysis performed using Spearman’s rho rank correlation
                                        are as shown in Table 1 below.

                                        Table 1. Spearman’s rho correlation matrix.

                                                                       HVI
                                           HVI         HVI Mel-      Brisbane       HVI           HVI                       WTI        Mortgage      ASX
                                                                                                               CPI
                                          Sydney        bourne        Gold        Adelaide        Perth                    Crude        Rate         200
                                                                      Coast
                    Correlation                                                                               −0.330
 HVI                                       1.000        0.985 **      −0.015        −0.014       −0.021                    0.123 *     −0.701 **   0.429 **
                    Coefficient                                                                                 **
 Sydney
                    Sig. (2-tailed)
J. Risk Financial Manag. 2023, 16, 61                                                                                           9 of 13

                                        of housing (Fereidouni 2010; Grossman et al. 2019). Second, it increases logistic cost which
                                        escalates building material and labour costs. Both forces are contradictory as the first one
                                        leads to more supply than demand, hence, a decrease in housing price whilst the latter push
                                        up housing prices due to higher construction cost. Spearman’s rho correlation analysis
                                        indicates a mild significant positive impact of WTI crude on Sydney’s housing price. Other
                                        cities however are displaying insignificant relationship with WTI crude movements.
                                              The literature generally indicates a negative relationship between the performance of
                                        the share market and interest rates (Bayer et al. 2013). A higher interest rate discourages
                                        investment and promotes savings. In addition, as investment in housing represents a
                                        substitution of share investment, a negative relationship is expected. Nonetheless, only
                                        Brisbane and Gold Coast, Perth and Adelaide are displaying the expected sign in the
                                        Spearman’s rho test analysis but insignificant. On the contrary, for the more affluent
                                        cities, such as Sydney and Melbourne, stock market performance is positively related to
                                        housing price movement. Possible explanations for this phenomenon are (i) investors
                                        are more affluent in these two cities and, therefore, are financially capable of forming a
                                        more diversified investment portfolio, (ii) investors from these two larger cities have better
                                        financial literacy and hence, value portfolio diversification more and do not view property
                                        and stock investment as substitutes. Bootstrap regression analysis was conducted on the
                                        variables under study and the findings are discussed in the next section.

                                        5.3. Bootstrap Regression Analysis and Results
                                             As can been seen from Table 2, regressions are performed on five models to gauge the
                                        relations of housing performance across five cities with independent variables including
                                        mortgage rates, WTI crude index and ASX200 index. Results of R2 obtained from the
                                        analyses indicate that independent variables included in the model are able to explain vari-
                                        ations of the housing performance in Sydney by 84.4 percent and Melbourne 87.5 percent,
                                        whereas the other three cities are in the range of 0.1 to 5 percent. The findings in Panel 1
                                        (Sydney) and 2 (Melbourne) reveal that there is a significant negative relationship between
                                        mortgage rate and housing performance of Sydney and Melbourne. These findings are
                                        consistent with Chong (2020), Xu and Tang (2014) and Chong and Liew 2020). However,
                                        housing prices in smaller cities including Perth, Adelaide and Brisbane and Gold Coast are
                                        unaffected by interest rate during the study period. Indeed, larger cities, such as Sydney
                                        and Melbourne, display different characteristics comparing to other cities in Australia
                                        (Cho et al. 2021).
                                             These results have policy implications indicating that tightening the monetary policy
                                        through rising interest rates to ease inflationary pressure will produce different results
                                        for different city’s housing prices. For Sydney and Melbourne, both with extremely high-
                                        medium housing price at $1,601,467 and $1,101,612, respectively, as of January 2022, house
                                        owners are required to take on a much higher loan-to-income ratio comparing to those
                                        in Brisbane, Adelaide and Perth with medium housing prices of $792,065, $731,547 and
                                        $612,348, respectively (Lutton 2022). Under a low wage growth and inflationary environ-
                                        ment, borrowing capability and repayment capability deteriorates, therefore, a housing
                                        correction is inevitable for cities with high housing prices. Under this scenario, home-
                                        owners would also sell their houses in Melbourne and Sydney and emigrate to more
                                        affordable cities to ease the burden of increasing mortgage rate. The availability of flexible
                                        work arrangements, such as working from home after the pandemic, have also provided
                                        opportunity for homeowners to move to cities with better housing affordability.
J. Risk Financial Manag. 2023, 16, 61                                                                                                                 10 of 13

                                        Table 2. Results of Bootstrap regression.
J. Risk Financial Manag. 2023, 16, x FOR PEER REVIEW                                                                                                 10 of 13
                                         Variables                                                             B               p-Value
                                         Panel 1: HVI Sydney
                                         Mortgage rate                                                         −7.276          0.001
                                        WTI crude                                                                     −0.030        0.539
                                         WTI crude                                                             0.102           0.001
                                        ASX200
                                         ASX200 index
                                                  index                                                        0.052 −0.001    0.0500.803
                                                Panel 2: HVI Melbourne
                                                     Theserate
                                                Mortgage    results have policy implications    indicating that tightening
                                                                                             −3.827                    0.001the monetary policy
        J. Risk Financial Manag. 2023, 16, x FOR PEER REVIEW                                                           10 of 13
                                               through
                                                WTI cruderising interest rates to ease inflationary
                                                                                             0.046 pressure will produce
                                                                                                                       0.001different results for
                                               different  city’s housing prices. For Sydney
                                                ASX200 index                                    and Melbourne, both with
                                                                                             0.002                     0.073extremely high-me-
                                        dium
                                         Panel
                                        WTI
                                                 housing      price at
                                                 3: HVI Brisbane
                                             crude                     and$1,601,467
                                                                             Gold Coast  and−0.030
                                                                                                $1,101,612, respectively,0.539
                                                                                                                                   as of January 2022, house
                                        owners
                                         Mortgage
                                        ASX200      are
                                                  index   required
                                                        rate          to  take   on  a  much     higher
                                                                                                   −0.023
                                                                                               −0.001      loan-to-income0.803   ratio  comparing to those in
                                                                                                                                     0.770
                                               crude                                               −
                                        Brisbane, Adelaide and Perth with medium housing prices of $792,065, $731,547 and
                                         WTI                                                         0.339                           0.601
                                         ASX200
                                             Theseindex
                                        $612,348,     results have policy
                                                       respectively         implications
                                                                         (Lutton    2022).   Under −0.001
                                                                                          indicating  that
                                                                                                       a lowtightening
                                                                                                                wagethe     monetary
                                                                                                                         growth      0.726
                                                                                                                                   and policy
                                                                                                                                         inflationary environ-
                                        through rising interest rates to ease inflationary pressure will produce different results for
                                        ment,
                                         Panel 4:borrowing
                                                     HVI Perthcapability and repayment capability deteriorates, therefore, a housing
                                        different city’s housing prices. For Sydney and Melbourne, both with extremely high-me-
                                         Mortgage rateinevitable for cities with high
                                        correction                                                 0.009                             0.800scenario, homeown-
                                        dium housingisprice                                          housing as
                                                                at $1,601,467 and $1,101,612, respectively,      prices.    Under
                                                                                                                     of January     this
                                                                                                                                2022,  house
                                         WTI
                                        ers
                                        owners
                                               crude
                                             would      also sell
                                                 are required   to their
                                                                   take onhouses
                                                                             a much in   Melbourne
                                                                                     higher
                                                                                                   − 0.001
                                                                                                         and Sydney
                                                                                              loan-to-income
                                                                                                                                     0.686
                                                                                                                           and emigrate
                                                                                                                ratio comparing   to those into more affordable
                                         ASX200 Adelaide
                                        Brisbane,    index                                         0.001prices of $792,065, $731,547 0.721
                                        cities  to ease theand       Perth of
                                                                burden        with medium housing
                                                                                increasing      mortgage       rate. The availabilityand   of flexible work ar-
                                        $612,348,
                                         Panel 5:respectively
                                        rangements,        such (Lutton
                                                     HVI Adelaide           2022). Under a low wage growth and inflationary environ-
                                                                   as working      from home after the pandemic, have also provided oppor-
                                        ment,  borrowingrate capability and    repayment capability     deteriorates, therefore, a housing
                                         Mortgage
                                        tunity   foris homeowners
                                        correction                         towith
                                                        inevitable for cities  movehigh    cities −
                                                                                       tohousing     0.220
                                                                                                   with
                                                                                                   prices.better    housing
                                                                                                           Under this
                                                                                                                                     0.863
                                                                                                                               affordability.
                                                                                                                        scenario, homeown-
                                         WTI crude                                                             −0.030          0.539
                                        ers would also sell their houses in Melbourne and Sydney and emigrate to more affordable
                                         ASX200 index                                      −0.001                           0.803
                                        5.4.
                                        citiesTrend
                                               to easeAnalysis
                                                      the burden of increasing mortgage rate. The availability of flexible work ar-
                                        rangements, such as working from home after the pandemic, have also provided oppor-
                                        tunity After  completing the regression tests, using the data collected, trend
                                                for homeowners                                                                            analyses were
                                        5.4.  Trend  Analysis to move to cities with better housing affordability.
                                        performed on the five major cities. A one year projection was conducted, and the results
                                              After
                                        5.4. Trend
                                        are  as       completing
                                                   Analysis
                                                shown      in Figuresthe    regression
                                                                        6–10.    From thetests,   using
                                                                                             figures      the data
                                                                                                      below,   we can collected,
                                                                                                                         see thattrend    analyses
                                                                                                                                     Sydney,        were
                                                                                                                                             Melbourne,
                                        performed      on the fiveregression
                                              After completing       major cities. usingA one theyear
                                                                                                  data projection    was  conducted,     and the results
                                        Brisbane     and Goldthe  Coast are ontests,the downward       collected,
                                                                                                       trend,     trend
                                                                                                               while    analyses
                                                                                                                        Perth   andwere
                                                                                                                                      Adelaide are trend-
                                        are  as shown
                                        performed         infive
                                                     on the   Figures   6–10.AFrom
                                                                 major cities.          theprojection
                                                                                  one year   figures was
                                                                                                      below,   we canand
                                                                                                           conducted,    seethethat  Sydney, Melbourne,
                                                                                                                                 results
                                        ing upwards before slowing down in the second half of next year
                                        are as shown
                                        Brisbane    andin Figures 6–10. From
                                                          Gold Coast     are onthethe
                                                                                   figures below, wetrend,
                                                                                       downward      can see while
                                                                                                             that Sydney,
                                                                                                                     PerthMelbourne,
                                                                                                                            and Adelaide are trending
                                        Brisbane and Gold Coast are on the downward trend, while Perth and Adelaide are trend-
                                        upwards before slowing down in the second half of next year
                                        ing upwards before slowing down in the second half of next year
                                                                   Sydney
                                                   (Trend analysis with one year projection)
                                                             Sydney
                                                 (Trend analysis with one year projection)
                                          300
                                          300
                                          200
                                          200
                                          100
                                          100                                     y = -0.0004x2 + 35.637x - 794600
                                                                       y = -0.0004x2 + 35.637x - 794600
                                                                                                 R² = 0.9866
                                            00                                    R² = 0.9866

                                        Figure 6. Trend analysis and one year prediction on housing prices for Sydney.
                                        Figure
                                        Figure 6.6. Trend
                                                    Trendanalysis
                                                            analysisand
                                                                      andoneoneyear
                                                                                 yearprediction
                                                                                       predictionon onhousing
                                                                                                        housingprices
                                                                                                                   pricesfor
                                                                                                                          forSydney.
                                                                                                                              Sydney.

                                                              Melbourne
                                                 (Trend analysis with one year projection
                                                                    Melbourne
                                          200      (Trend analysis with one year projection
                                          150
                                          200
                                          100
                                          150
                                           50
                                                                        y = -0.0002x2 + 17.577x - 391796
                                           0
                                          100
                                                                                   R² = 0.9755

                                           50
                                                                                   y = -0.0002x2 + 17.577x - 391796
                                             0                                                R² = 0.9755
                                        Figure 7. Trend analysis and one year prediction on housing prices for Melbourne.

                                        Figure 7.
                                        Figure 7. Trend
                                                  Trendanalysis
                                                        analysisand
                                                                 andone
                                                                     oneyear
                                                                         yearprediction
                                                                              predictionon
                                                                                         onhousing
                                                                                            housingprices
                                                                                                    pricesfor
                                                                                                           forMelbourne.
                                                                                                              Melbourne.
J.J.Risk
    RiskFinancial
         FinancialManag.  2023,16,
                   Manag.2023,  16,61
                                    x FOR PEER REVIEW                                                                                              11 of 13
                                                                                                                                                  11     13
 J. Risk Financial Manag. 2023, 16, x FOR PEER REVIEW                                                                                             11 of 13
 J. Risk Financial Manag. 2023, 16, x FOR PEER REVIEW                                                                                             11 of 13

                                                        Brisbane
                                                        Brisbane and
                                                                 and Gold
                                                                     Gold Coast
                                                                          Coast
                                                       Brisbane
                                                  (Trend          andone
                                                         analysis with  Gold
                                                                           yearCoast
                                                                                projection)
                                                  (Trend analysis with one year projection)
                                                  (Trend analysis with one year projection)
                                      200
                                      200
                                      200
                                      150
                                      150
                                      150
                                      100
                                      100
                                      100
                                       50
                                       50                              y = -0.0003x22 + 28.544x - 638552
                                       50                              y = -0.0003x + 28.544x - 638552
                                                                                  R²2 =+ 0.9791
                                                                       y = -0.0003x      28.544x - 638552
                                        0
                                        0                                         R² = 0.9791
                                                                                  R² = 0.9791
                                        0

                                   Figure
                                   Figure 8. Trend
                                          8. Trend
                                   Figure 8.       analysis
                                             Trend analysis and
                                                   analysis and one
                                                            and one year
                                                                one year prediction
                                                                    year prediction on
                                                                         predictionon  housing
                                                                                    onhousing  prices
                                                                                       housingprices  for
                                                                                               pricesfor  Brisbane
                                                                                                      forBrisbane  and
                                                                                                          Brisbaneand  Gold
                                                                                                                   andGold  Coast.
                                                                                                                       GoldCoast.
                                                                                                                            Coast.
                                   Figure 8. Trend analysis and one year prediction on housing prices for Brisbane and Gold Coast.

                                                                 Perth
                                                                 Perth
                                                               Perth
                                              (Trend analysis with one year projection)
                                              (Trend analysis with one year projection)
                                              (Trend analysis with one year projection)
                                     125
                                     125
                                     125
                                     120
                                     120
                                     120
                                     115
                                     115
                                     115
                                     110
                                     110
                                     110
                                     105                             y = 0.000009-06x22 - 0.7904x + 17338
                                     105                             y = 0.000009-06x - 0.7904x + 17338
                                     105
                                     100                                         R² = 0.9468
                                                                     y = 0.000009-06x 2 - 0.7904x + 17338
                                                                                 R² = 0.9468
                                     100                                         R² = 0.9468
                                     100
                                      95
                                      95
                                      95

                                   Figure 9.
                                          9. Trend
                                   Figure 9.       analysis
                                                   analysis and
                                             Trend analysis     one
                                                                one year
                                                            and one      prediction
                                                                         prediction on
                                                                    year prediction    housing
                                                                                       housing prices
                                                                                    onhousing         for
                                                                                                      for Perth.
                                                                                               pricesfor  Perth.
                                   Figure 9. Trend
                                   Figure    Trend analysis and
                                                            and one year
                                                                    year predictionon
                                                                                    on housingprices
                                                                                               prices forPerth.
                                                                                                          Perth.

                                                              Adelaide
                                                              Adelaide
                                              (Trend analysisAdelaide
                                                              with one year projection)
                                              (Trend analysis with one year projection)
                                              (Trend analysis with one year projection)
                                     200
                                     200
                                     200
                                     150
                                     150
                                     150
                                                                      y = -0.0001x22 + 12.139x - 272779
                                     100
                                     100                              y = -0.0001x + 12.139x - 272779
                                                                                 R²2 =+ 0.9942
                                                                      y = -0.0001x      12.139x - 272779
                                     100                                         R² = 0.9942
                                                                                 R² = 0.9942
                                      50
                                      50
                                      50
                                       0
                                       0
                                       0

                                   Figure
                                   Figure 10.
                                          10. Trend
                                              Trend analysis
                                                    analysis and
                                                             and one
                                                                 one year
                                                                     year prediction
                                                                          prediction on
                                                                                     on housing
                                                                                        housing prices
                                                                                                prices for
                                                                                                       for Adelaide.
                                                                                                           Adelaide.
                                   Figure 10.
                                   Figure 10. Trend
                                              Trend analysis
                                                    analysis and
                                                             and one
                                                                 one year
                                                                     year prediction
                                                                          predictionon
                                                                                     onhousing
                                                                                        housingprices
                                                                                                pricesfor
                                                                                                       forAdelaide.
                                                                                                           Adelaide.
                                    6.
                                    6. Conclusions
                                       Conclusions
                                   6.
                                    6. Conclusions
                                       Conclusions
                                          The
                                          The   aim ofofthis
                                                          thispaper
                                                                  paperis to  examine    whether    consecutive       monthly     mortgage     rate  hikes
                                    in    The aim
                                         The
                                       Australia
                                                     of
                                                aimfrom
                                                     of this
                                                        this  paper
                                                              paper
                                                            May
                                                                       is
                                                                   until
                                                                          to
                                                                       is is  examine
                                                                          to to  examine
                                                                              examine
                                                                          September
                                                                                         whether
                                                                                             whether
                                                                                         whether
                                                                                         2022   have
                                                                                                    consecutive
                                                                                                          consecutive
                                                                                                    consecutive
                                                                                                       affected
                                                                                                                      monthly
                                                                                                                           monthly
                                                                                                                      monthly
                                                                                                                   housing
                                                                                                                                  mortgage
                                                                                                                                       mortgage
                                                                                                                                  mortgage
                                                                                                                              prices  in its
                                                                                                                                               rate  hikes
                                                                                                                                                       rate
                                                                                                                                               ratemajor
                                                                                                                                              five   hikes
                                    in Australia
                                   hikes   in
                                    in Australia    from
                                              Australia
                                                    from MayMay
                                                            from   until
                                                                    May   September
                                                                           until
                                                                   untilindicated        2022
                                                                                  September
                                                                          September      2022   have
                                                                                                 2022  affected
                                                                                                        have
                                                                                                have affected      housing
                                                                                                               affected
                                                                                                                   housing    prices
                                                                                                                           housing    in its
                                                                                                                                      prices
                                                                                                                              pricesinverse   five
                                                                                                                                               in
                                                                                                                                      in its five    major
                                                                                                                                                   its five
                                                                                                                                                     major
                                    cities.
                                    cities. Correlation
                                            Correlation     analyses
                                                            analyses     indicated    that
                                                                                      that  mortgage      rate has   a  significant             relation-
                                   major
                                    cities.
                                    ship
                                            cities.
                                          with
                                                     Correlation
                                            Correlation
                                                  housing   analyses  analyses
                                                              performanceindicated
                                                                                 for  that mortgage
                                                                                   indicated
                                                                                      citiesmortgage
                                                                                              with
                                                                                                          rate
                                                                                                that mortgage  has
                                                                                                          rate medium
                                                                                                     higher
                                                                                                                     aa significant
                                                                                                               hasrate  significant
                                                                                                                            housing
                                                                                                                                     inverse
                                                                                                                           has a significant
                                                                                                                                     inverse
                                                                                                                                       prices,
                                                                                                                                                relation-
                                                                                                                                                 inverse
                                                                                                                                                relation-
                                                                                                                                                  such    as
                                    ship
                                    ship  with
                                   relationship   housing
                                                    with
                                          with housing        performance
                                                           housing
                                                              performance        for
                                                                       performance
                                                                                 for  cities
                                                                                        for   with
                                                                                            cities
                                                                                      cities with    higher
                                                                                                    with       medium
                                                                                                           higher
                                                                                                     higher medium  medium  housing
                                                                                                                                housing
                                                                                                                            housing    prices,
                                                                                                                                           prices,
                                                                                                                                       prices,    such
                                                                                                                                                  suchsuchas
                                                                                                                                                          as
                                    Melbourne
                                   as  Melbourne
                                    Melbourne      and
                                                   andandSydney.      Positive
                                                            Sydney.Positive
                                                         Sydney.                 significant
                                                                       Positivesignificant      relationships
                                                                                   significantrelationships
                                                                                                 relationshipsare are   also
                                                                                                                   are also  reported    between
                                                                                                                        also reported between
                                                                                                                                         between       WTI
                                                                                                                                                       WTI
                                                                                                                                                       WTI
                                    Melbourne
                                    crude,         and
                                             inflation   Sydney.
                                                        rate          Positive
                                                                with mortgage    significant
                                                                       mortgage raterate  and   relationships
                                                                                                Sydney housing
                                                                                                           housingare   also reported
                                                                                                                       prices.  Bootstrapbetween
                                                                                                                                             regressionWTI
                                   crude,
                                    crude,  inflation
                                             inflation  rate
                                                        rate   with                       and  Sydney                  prices.  Bootstrap    regression
                                    crude,
                                    results  inflation
                                             using      rate with
                                                     independentwith mortgage
                                                                       mortgage
                                                                        variables
                                                                                    rate
                                                                                    rate  and
                                                                                          and Sydney
                                                                                     including  Sydney
                                                                                                  mortgage
                                                                                                           housing
                                                                                                           housing
                                                                                                                rate,
                                                                                                                       prices.
                                                                                                                       prices.
                                                                                                                       WTI
                                                                                                                                Bootstrap
                                                                                                                                Bootstrap
                                                                                                                             crude   and
                                                                                                                                             regression
                                                                                                                                             regression
                                                                                                                                          ASX200       per-
                                   results
                                    results  using    independentvariables
                                                     independent         variablesincluding
                                                                                       includingmortgage
                                                                                                    mortgage       rate,
                                                                                                                rate,  WTI WTI
                                                                                                                             crudecrude
                                                                                                                                     and and
                                                                                                                                          ASX200ASX200 per-
                                    results
                                    formance using
                                                 wereindependent
                                                         also           variables
                                                                performed.           including
                                                                                Findings          mortgage
                                                                                             indicate    that   rate,
                                                                                                               the     WTI
                                                                                                                    proposed crude   and
                                                                                                                                   models ASX200
                                                                                                                                            are    ableper-
                                                                                                                                                          to
                                   performance
                                    formance     werewere   also
                                                         also      performed.
                                                                performed.         Findings
                                                                                Findings       indicate
                                                                                             indicate      that
                                                                                                         that    the
                                                                                                               the    proposed
                                                                                                                    proposed       models
                                                                                                                                   models    are   able  to
                                                                                                                                                          to
                                    formance
                                    explain      were
                                              variations alsoof performed.
                                                                 the housing    Findings
                                                                                 performance indicate
                                                                                                  by     that
                                                                                                      84.4     the
                                                                                                            percent proposed
                                                                                                                        and  87.5  models
                                                                                                                                   percent  are
                                                                                                                                            for    able
                                                                                                                                                  Sydney  to
                                   explain
                                    explain   variations
                                              variations    of
                                                             of the
                                                                 the housing
                                                                     housing    performance
                                                                                 performance      by
                                                                                                  by 84.4
                                                                                                      84.4  percent
                                                                                                            percent    and
                                                                                                                        and 87.5
                                                                                                                             87.5  percent
                                                                                                                                   percent  for
                                                                                                                                            for  Sydney
                                                                                                                                                  Sydney
                                    explain
                                    and       variations
                                         Melbourne,          of  the housing
                                                          respectively       but performance
                                                                                  are             by
                                                                                       insignificant  84.4  percent     and  87.5  percent  for   Sydney
                                   and
                                    and  Melbourne,
                                         Melbourne,      respectively
                                                          respectively     but
                                                                             butare
                                                                                  areinsignificant
                                                                                       insignificant forfor
                                                                                                          thethe
                                                                                                        for       smaller
                                                                                                               smaller
                                                                                                             the             cities.
                                                                                                                          cities.  AsAs  49.86
                                                                                                                                      49.86       percent
                                                                                                                                             percent     of
                                    and
                                    of   Melbourne,
                                       the  total  number respectively
                                                               of  dwellings but in
                                                                                  areAustralia
                                                                                       insignificant
                                                                                                  are  in    the smaller
                                                                                                        forSydney smaller
                                                                                                                      and
                                                                                                                             cities.
                                                                                                                             cities. As
                                                                                                                                     As 49.86
                                                                                                                            Melbourne,   49.86
                                                                                                                                           this
                                                                                                                                                  percent
                                                                                                                                                  percent
                                                                                                                                                  finding
                                   the
                                    of  total
                                       the     number
                                            total  number of dwellings
                                                               of  dwellings in Australia
                                                                                 in          are in
                                                                                     Australia      Sydney
                                                                                                  are  in       and and
                                                                                                           Sydney      Melbourne,    this finding
                                                                                                                            Melbourne,     this        will
                                                                                                                                                  finding
                                    of the total number of dwellings in Australia are in Sydney and Melbourne, this finding
J. Risk Financial Manag. 2023, 16, 61                                                                                            12 of 13

                                        contribute heavily to the overall national housing performance following the mortgage rate
                                        hikes. Based on the analysis discussed above, this study concludes that: (1) An increase
                                        in mortgage rate has a significant negative impact on the housing prices in Sydney and
                                        Melbourne. Other cities’ housing prices are negatively associated with interest rates, but
                                        were insignificant during the study period, (2) The increases in mortgage rate have affected
                                        housing prices in different cities differently and (3) The influence of oil price and stock price
                                        on housing prices are found to be insignificant for all cities except Sydney and Melbourne.
                                        As the evidence reported bipolar results between the large cites comparing to their smaller
                                        counterparts and low explanatory power for models of smaller cities, more factors need to
                                        be taken into consideration when analysing housing prices of the smaller cities. Among
                                        others, the availability of flexible work arrangement which motivates homeowners with
                                        higher debt-to-income ratio to liquidate properties situated in cities with higher housing
                                        prices to avoid rising mortgage payment and emigrate to a more affordable city are worth
                                        looking into. In addition, borrowing power, repayment capability and the level of financial
                                        literacy of existing and potential homeowners between different cities could also offer some
                                        explanations to housing price performance in Australia.

                                        Funding: This research received no external funding.
                                        Data Availability Statement: Not applicable.
                                        Conflicts of Interest: The author declares no conflict of interest.

References
Ambrose, Brent, Piet Eichholtz, and Thies Lindenthal. 2013. House prices and fundamentals: 355 years of evidence. Journal of Money,
     Credit and Banking 45: 477–91. [CrossRef]
Australia Bureau of Statistics. 2022. Total Value of Dwellings. Available online: https://www.abs.gov.au/statistics/economy/price-
     indexes-and-inflation/total-value-dwellings (accessed on 1 September 2022).
Bayer, Patrick, Alvin Murphy, Robert McMillan, and Christopher Timmins. 2013. A Dynamic Model of Demand for Houses and
     Neighborhoods. ERID Working Paper No. 107. Durham: Duke University.
Cho, Yunho, May Shuyun Li, and Lawrence Uren. 2021. Understanding housing affordability in Australia. The Australian Economic
     Review 54: 375–86. [CrossRef]
Chong, Fennee. 2020. Housing price, mortgage interest rate and immigration. Real Estate Management and Evaluation 28: 36–44.
     [CrossRef]
Chong, Fennee, and Venus K. Liew. 2020. New Zealand’s residential price dynamics: Do capability to consume and government
     policies matter? Economics Bulletin 40: 2262–74.
Cline, Graysen. 2019. Nonparametric Statistical Methods Using R. London: Edtech Press.
Cohen, Viktorija, and Lina Karpaviciute. 2017. The analysis of the determinants of housing prices. Independent Journal of Management
     and Production 8: 49–63. [CrossRef]
Cox, Wendell. 2021. Demographia International Housing Affordability-2021. Frontier Centre for Public Policy. Available online:
     http://www.demographia.com/dhi.pdf (accessed on 20 September 2022).
Cox, Wendell. 2022. Demographia International Housing Affordability-2022. Frontier Centre for Public Policy CID: 20.500.12592/2s4fmz.
     Available online: https://policycommons.net/artifacts/2273181/demographia-international-housing-affordability/3032994/
     (accessed on 25 September 2022).
Dovman, Polina, Sigal Ribon, and Yakhin Yakhin. 2012. The housing market in Israel 2008–2010: Are house prices a “bubble”? Israel
     Economic Review 10: 1–38.
Dreger, Christian, and Jrgen Wolters. 2011. Liquidity and asset prices: How strong are the linkages? Review of Economics & Finance
     1: 43–52.
Fereidouni, Hassan. 2010. Analysis of fluctuation in housing prices in Iran. Housing Finance International 25: 19–22.
Grossman, Valerie, Enrique Martinez-Garcia, Bernardo Torres, and Yongzhi Sun. 2019. Drilling down: The impact of oil price shocks
     on housing prices. The Energy Journal 40: 59–84. [CrossRef]
Keynes, John. 1936. The General Theory of Employment, Interest and Money. London: Macmillan.
Lutton, Ellen. 2022. Australia’s Median House Price Hits a Record $1.066 Million. Available online: https://www.domain.com.au/
     news/australias-median-house-price-hits-1-066-million-but-have-prices-peaked-1114685 (accessed on 10 September 2022).
OECD Report. 2004. OECD Annual Report 2004. OECD. Available online: https://www.oecd-ilibrary.org/economics/oecd-annual-
     report-2004_annrep-2004-en (accessed on 10 September 2022).
Torre, Juan. 2016. Asymmetric Effects of Monetary Policy on the Colombian House Prices. Vniversitas Economica 015124. Bogota:
     Universidad Javeriana.
J. Risk Financial Manag. 2023, 16, 61                                                                                          13 of 13

Tsai, I-Chun. 2013. The asymmetric impacts of monetary policy on housing prices: A viewpoint of housing price rigidity. Economic
      Modelling 31: 405–13. [CrossRef]
Upadhyaya, Kamal, Dharmendra Dhakal, and Franklin Mixon. 2017. Housing prices, stock prices and the US economy. Applied
      Economics 49: 5916–22. [CrossRef]
Williams, John. 2016. Measuring the effects of monetary policy on house prices and the economy. BIS Papers Chapters 88: 7–16.
Xu, Lu, and Bo Tang. 2014. On the determinants of UK house prices. International Journal of Economics and Research 5: 57–64.
Yin, Xiao-Cui, Chi-Wei Su, and Ran Tao. 2020. Has monetary policy caused housing prices to rise or fall in China? The Singapore
      Economic Review 6: 1601–18. [CrossRef]
Zhang, Qingqi. 2021. Housing price prediction based on Multiple Linear regression. Hindawi Scientific Programming 2021: 7678931.
      [CrossRef]
Zhang, Yang, Dongyue Mao, Baoyi Shi, and Michael Seiler. 2018. Money supply and housing price bubbles: Evidence from micro-
      experiments. Real Estate Finance 34: 139–46.

Disclaimer/Publisher’s Note: The statements, opinions and data contained in all publications are solely those of the individual
author(s) and contributor(s) and not of MDPI and/or the editor(s). MDPI and/or the editor(s) disclaim responsibility for any injury to
people or property resulting from any ideas, methods, instructions or products referred to in the content.
You can also read