HPC Software - Debugger and Performance Tools - May 2017 | Michael Knobloch
←
→
Page content transcription
If your browser does not render page correctly, please read the page content below
Mitglied der Helmholtz-Gemeinschaft

                                      HPC Software –
                                      Debugger and Performance Tools

                                      May 2017 | Michael Knobloch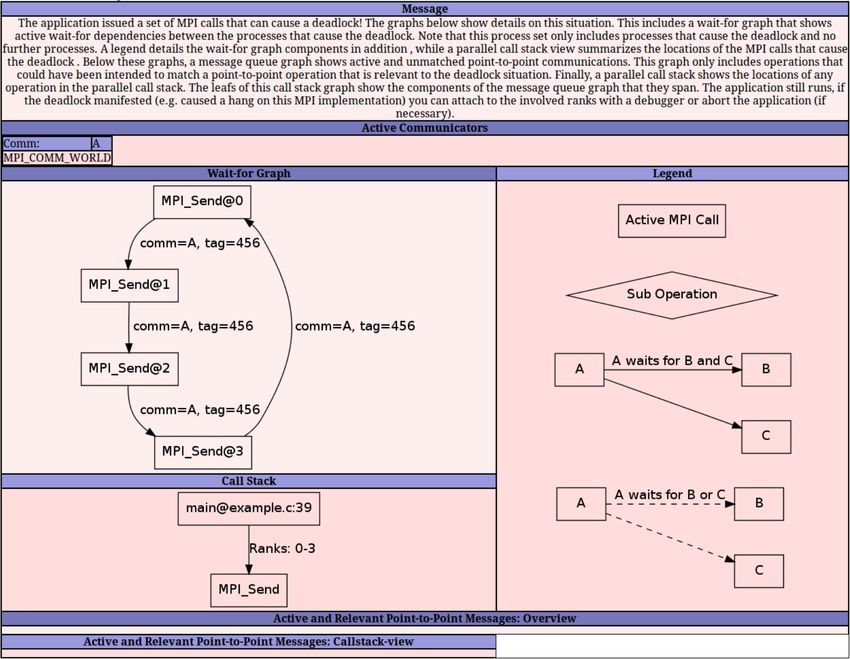
Outline
              • Local module setup
                                                        Debugger:
              • Compilers
                                                        •   TotalView
              • Libraries                               •   DDT
                                                        •   STAT
                                                        •   MUST
  Make it work,
  make it right,                                        Performance Tools:
                                                        •   Score-P
  make it fast.                                         •   Scalasca
                     Kent Beck                          •   Vampir
                                                        •   HPCToolkit
                                                        •   Performance Reports
                                                        •   TAU
                                                        •   NVIDIA Visual Profiler
                                                        •   Darshan
                                                        •   PAPI
M. Knobloch                 SC Introduction, May 2017                                2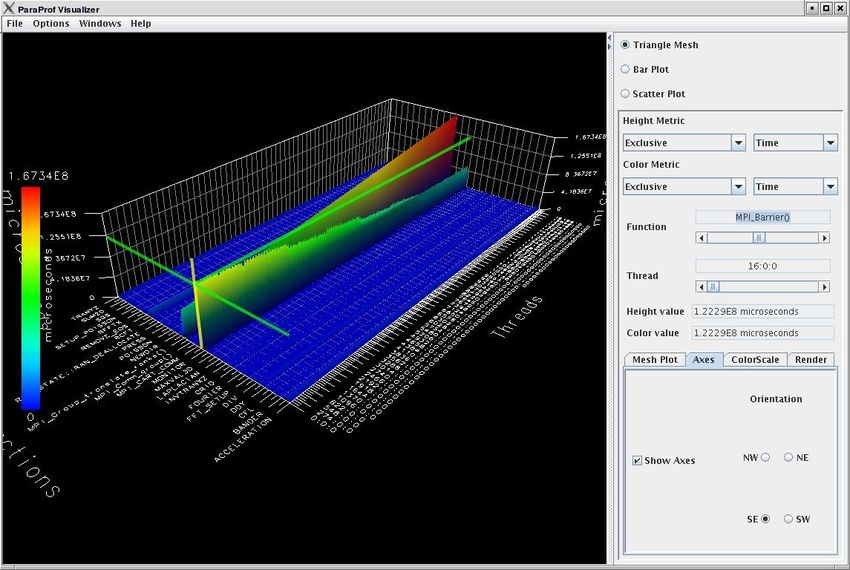
Mitglied der Helmholtz-Gemeinschaft

Module setup & compiler
The Module Setup Tools are available through “modules” Allows to easily manage different versions of programs Works by dynamic modification of a user's environment JUQUEEN: Module setup of tools based on UNITE Tools only visible after a module load UNITE User has to take care of dependencies JURECA: Module setup based on EasyBuild and lmod Staged, hierarchical setup Automatically manages dependencies via toolchains M. Knobloch SC Introduction, May 2017 4
Most Important Module Commands module spider # lmod only: show all products spider product # lmod only: show product details avail # show all available products list # list loaded products load product(s) # setup access to product unload product(s) # release access swap product1 product2 # replace v1 of product with v2 whatis product(s) # print short description help product(s) # print longer description show product(s) # show what “settings” are performed M. Knobloch SC Introduction, May 2017 5

Compiler JUQUEEN IBM XL C/C++ and Fortran compiler GNU C/C++ and Fortran compiler Clang C/C++ compiler JURECA Intel C/C++ and Fortran compiler GNU C/C++ and Fortran compiler PGI C/C++ and Fortran compiler Clang C/C++ compiler NVIDIA CUDA compiler M. Knobloch SC Introduction, May 2017 6
MPI Libraries
JUQUEEN
IBM MPI
MPICH3 Not officially supported, use only if you have
problems with IBM MPI or need MPI-3 features
JURECA
Intel MPI
Parastation MPI
MVAPICH MPI (CUDA aware)
M. Knobloch SC Introduction, May 2017 7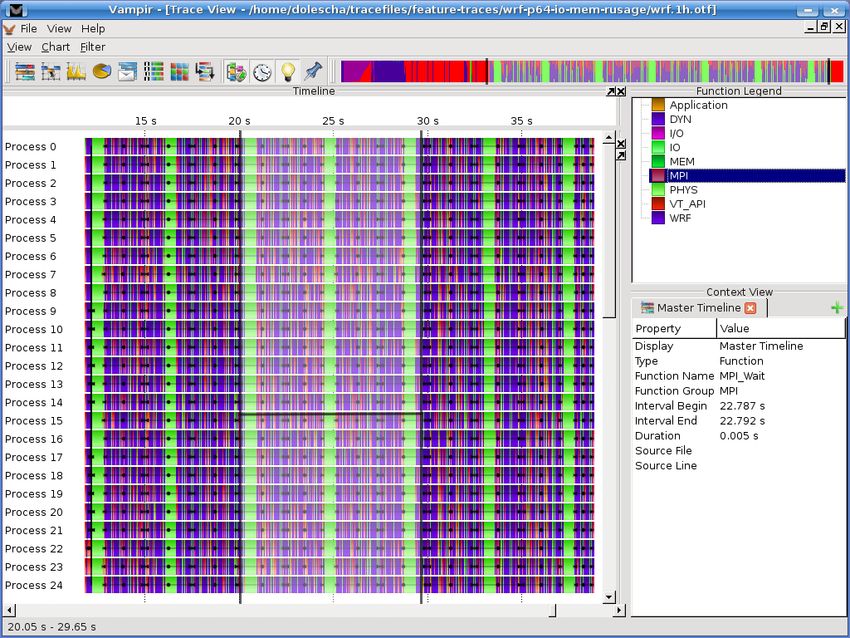
Mitglied der Helmholtz-Gemeinschaft

Debuggers
Debugging Tools (status: May 2017)
JUQUEEN JURECA
TotalView
DDT
STAT
MUST
M. Knobloch SC Introduction, May 2017 9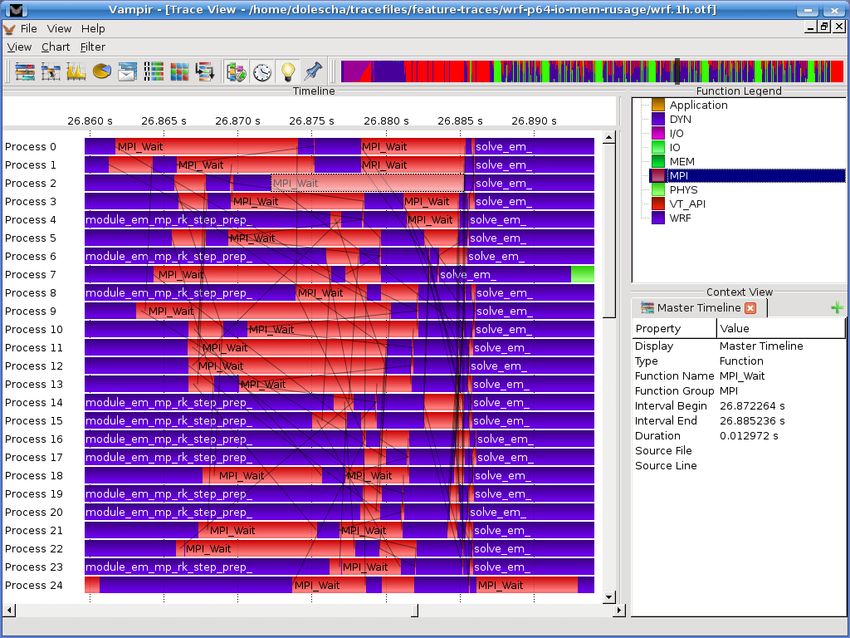
Parallel Debugger
UNIX Symbolic Debugger
for C, C++, F77, F90, PGI HPF, assembler programs
“Standard” debugger
Special, non-traditional features
Multi-process and multi-threaded
C++ support (templates, inheritance, inline functions)
F90 support (user types, pointers, modules)
1D + 2D Array Data visualization
Support for parallel debugging (MPI: automatic attach,
message queues, OpenMP, pthreads)
Scripting and batch debugging
Memory Debugging
CUDA and OpenACC support
http://www.roguewave.com
NOTE: License limited to 2048 processes (shared between all users)
M. Knobloch SC Introduction, May 2017 10TotalView: Main Window
Toolbar for
Stack common
trace options
Local
variables
for
selected
stack frame
Break
points Source
code
window
M. Knobloch SC Introduction, May 2017 11TotalView: Tools Menu
Call Graph Data visualization
Message
queue
graph
M. Knobloch SC Introduction, May 2017 12DDT Parallel Debugger
UNIX Graphical Debugger for C, C++, F77, F90 programs
Modern, easy-to-use debugger
Special, non-traditional features
Multi-process and multi-threaded
1D + 2D array data visualization
Support for MPI parallel debugging
(automatic attach, message queues)
Support for OpenMP (Version 2.x and later)
Support for CUDA and OpenACC
Job submission from within debugger
http://www.allinea.com
NOTE: License limited to 64 processes (shared between all users)
M. Knobloch SC Introduction, May 2017 13DDT: Main Window
Process
controls
Process
groups
Source Variables
code
Expression
evaluator
Stack
trace
M. Knobloch SC Introduction, May 2017 14DDT: Non-standard Features
Message
queue
graph
Multi-
Dimensional
Array Viewer
Memory Usage
M. Knobloch SC Introduction, May 2017 15STAT: Stack Trace Analysis Tool Very lightweight helper tool Shows merged call tree of whole program Useful to detect deadlocks Pinpoint individual problems Tailored for large-scale systems Scales to millions of processes NOT a real/full debugger https://computing.llnl.gov/code/STAT/ M. Knobloch SC Introduction, May 2017 16
STAT: Main Window

M. Knobloch   SC Introduction, May 2017   17
STAT: Zoom

M. Knobloch   SC Introduction, May 2017   18
STAT: Equivalence Classes

M. Knobloch    SC Introduction, May 2017   19
STAT: Equivalence Classes (cont.)

M. Knobloch     SC Introduction, May 2017   20
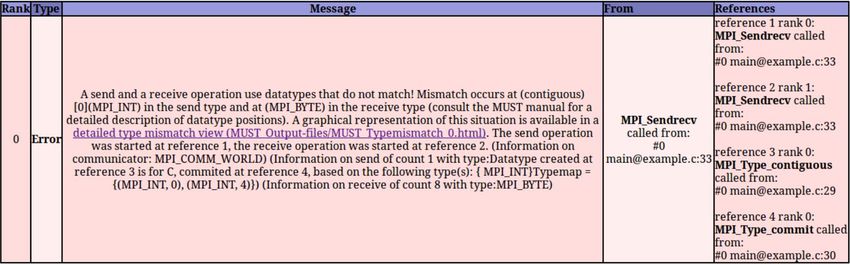
MUST
Next generation MPI correctness and portability checker
http://doc.itc.rwth-aachen.de/display/CCP/Project+MUST
MUST reports
Errors: violations of the MPI-standard
Warnings: unusual behavior or possible problems
Notes: harmless but remarkable behavior
Further: potential deadlock detection
Usage
Relink application with mustc, mustcxx, mustf90, …
Run application under the control of mustrun (requires one
additional MPI process)
See MUST_Output.html report
M. Knobloch SC Introduction, May 2017 21MUST Datatype Mismatch M. Knobloch SC Introduction, May 2017 22
MUST Deadlock Detection

M. Knobloch    SC Introduction, May 2017   23
Mitglied der Helmholtz-Gemeinschaft

Performance Analysis Tools
Typical Performance Analysis Procedure

■   Do I have a performance problem at all?
      ■ Time / speedup / scalability measurements
■   What is the key bottleneck (computation / communication)?
      ■ MPI / OpenMP / flat profiling
■   Where is the key bottleneck?
      ■ Call-path profiling, detailed basic block profiling
■   Why is it there?
      ■ Hardware counter analysis
      ■ Trace selected parts (to keep trace size manageable)
■   Does the code have scalability problems?
      ■ Load imbalance analysis, compare profiles at various
         sizes function-by-function, performance modeling

M. Knobloch            SC Introduction, May 2017                25
Remark: No Single Solution is Sufficient!
A combination of different methods, tools and techniques
is typically needed!
■ Analysis
■ Statistics, visualization, automatic analysis, data mining, ...
■ Measurement
■ Sampling / instrumentation, profiling / tracing, ...
■ Instrumentation
■ Source code / binary, manual / automatic, ...
M. Knobloch SC Introduction, May 2017 26Critical Issues
■ Accuracy
■ Intrusion overhead
■ Measurement itself needs time and thus lowers performance
■ Perturbation
■ Measurement alters program behavior, e.g., memory access
pattern
■ Might prevent compiler optimization, e.g. function inlining
Accuracy of timers & counters
■
■ Granularity
■ How many measurements?
■ How much information / processing during each
measurement?
Tradeoff: Accuracy vs. Expressiveness of data
M. Knobloch SC Introduction, May 2017 27Performance Tools (status: May 2017)
JUQUEEN JURECA
Score-P
Scalasca2
Vampir[Server]
HPCToolkit
Allinea Performance Reports
Darshan
NVIDIA Visual Profiler
TAU
Intel VTune Amplifier XE*
mpiP*
Extrae/Paraver*
PAPI*
M. Knobloch SC Introduction, May 2017 28Score-P
Community instrumentation and measurement
infrastructure
Developed by a consortium of performance
tool groups
Next generation measurement system of
Scalasca 2.x
Vampir
TAU
Periscope
Common data formats improve tool interoperability
http://www.score-p.org
M. Knobloch SC Introduction, May 2017 29 Collection of trace-based performance analysis tools
Specifically designed for large-scale systems
Unique features:
Scalable, automated search for event patterns
representing inefficient behavior
Scalable identification of the critical execution path
Delay / root-cause analysis
Based on Score-P for instrumentation and measurement
Includes convenience / post-processing commands
providing added value
http://www.scalasca.org
M. Knobloch SC Introduction, May 2017 30What is the Key Bottleneck?
Generate flat MPI profile using Score-P/Scalasca
Only requires re-linking
Low runtime overhead
Provides detailed information on MPI usage
How much time is spent in which operation?
How often is each operation called?
How much data was transferred?
Limitations:
Computation on non-master threads and outside
of MPI_Init/MPI_Finalize scope ignored
M. Knobloch SC Introduction, May 2017 31Flat MPI Profile: Recipe
1. Prefix your link command with
“scorep --nocompiler”
2. Prefix your MPI launch command with
“scalasca -analyze”
3. After execution, examine analysis results using
“scalasca -examine scorep_”
M. Knobloch SC Introduction, May 2017 32Flat MPI Profile: Example
% module load UNITE scorep scalasca
% mpixlf90 -O3 -qsmp=omp -c foo.f90
% mpixlf90 -O3 -qsmp=omp -c bar.f90
% scorep --nocompiler \
mpixlf90 -O3 –qsmp=omp -o myprog foo.o bar.o
##########################
## In the job script: ##
##########################
module load UNITE scalasca
scalasca -analyze \
runjob --ranks-per-node P --np n [...] --exe ./myprog
##########################
## After job finished: ##
##########################
% scalasca -examine scorep_myprog_Ppnxt_sum
M. Knobloch SC Introduction, May 2017 33Flat MPI Profile: Example (cont.)
Aggregate
execution time on
master threads
Time spent in a
particular MPI
call
Time spent in
selected call as
percentage of
total time
M. Knobloch SC Introduction, May 2017 34Where is the Key Bottleneck?
Generate call-path profile using Score-P/Scalasca
Requires re-compilation
Runtime overhead depends on application characteristics
Typically needs some care setting up a good measurement
configuration
Filtering
Selective instrumentation
Option 1 (recommended):
Automatic compiler-based instrumentation
Option 2:
Manual instrumentation of interesting phases, routines, loops
M. Knobloch SC Introduction, May 2017 35Call-path Profile: Recipe
1. Prefix your compile & link commands with
“scorep”
2. Prefix your MPI launch command with
“scalasca -analyze”
3. After execution, compare overall runtime with uninstrumented
run to determine overhead
4. If overhead is too high
1. Score measurement using
“scalasca -examine -s scorep_”
2. Prepare filter file
3. Re-run measurement with filter applied using prefix
“scalasca –analyze –f ”
5. After execution, examine analysis results using
“scalasca -examine scorep_”
M. Knobloch SC Introduction, May 2017 36Call-path Profile: Example
% module load UNITE scorep scalasca
% scorep mpixlf90 -O3 -qsmp=omp -c foo.f90
% scorep mpixlf90 -O3 -qsmp=omp -c bar.f90
% scorep \
mpixlf90 -O3 –qsmp=omp -o myprog foo.o bar.o
##########################
## In the job script: ##
##########################
module load UNITE scalasca
scalasca -analyze \
runjob --ranks-per-node P --np n [...] --exe ./myprog
M. Knobloch SC Introduction, May 2017 37Call-path Profile: Example (cont.)
% scalasca -examine -s epik_myprog_Ppnxt_sum
scorep-score -r ./epik_myprog_Ppnxt_sum/profile.cubex
INFO: Score report written to ./scorep_myprog_Ppnxt_sum/scorep.score
Estimates trace buffer requirements
Allows to identify canditate functions for filtering
Computational routines with high visit count
and low time-per-visit ratio
Region/call-path classification COM
MPI (pure MPI library functions)
OMP (pure OpenMP functions/regions) USR COM USR
USR (user-level source local computation USR OMP MPI USR
COM (“combined” USR + OpeMP/MPI)
ANY/ALL (aggregate of all region types)
M. Knobloch SC Introduction, May 2017 38Call-path Profile: Example (cont.)
% less scorep_myprog_Ppnxt_sum/scorep.score
Estimated aggregate size of event trace: 162GB
Estimated requirements for largest trace buffer (max_buf): 2758MB
Estimated memory requirements (SCOREP_TOTAL_MEMORY): 2822MB
(hint: When tracing set SCOREP_TOTAL_MEMORY=2822MB to avoid
intermediate flushes or reduce requirements using USR regions
filters.)
flt type max_buf[B] visits time[s] time[%] time/ region
visit[us]
ALL 2,891,417,902 6,662,521,083 36581.51 100.0 5.49 ALL
USR 2,858,189,854 6,574,882,113 13618.14 37.2 2.07 USR
OMP 54,327,600 86,353,920 22719.78 62.1 263.10 OMP
MPI 676,342 550,010 208.98 0.6 379.96 MPI
COM 371,930 735,040 34.61 0.1 47.09 COM
USR 921,918,660 2,110,313,472 3290.11 9.0 1.56 matmul_sub
USR 921,918,660 2,110,313,472 5914.98 16.2 2.80 binvcrhs
USR 921,918,660 2,110,313,472 3822.64 10.4 1.81 matvec_sub
USR 41,071,134 87,475,200 358.56 1.0 4.10 lhsinit
USR 41,071,134 87,475,200 145.42 0.4 1.66 binvrhs
USR 29,194,256 68,892,672 86.15 0.2 1.25 exact_solution
OMP 3,280,320 3,293,184 15.81 0.0 4.80 !$omp parallel
[...]
M. Knobloch SC Introduction, May 2017 39Call-path Profile: Filtering
In this example, the 6 most fequently called routines are
of type USR
These routines contribute around 35% of total time
However, much of that is most likely measurement overhead
Frequently executed
Time-per-visit ratio in the order of a few microseconds
Avoid measurements to reduce the overhead
List routines to be filtered in simple text file
M. Knobloch SC Introduction, May 2017 40Filtering: Example
% cat filter.txt
SCOREP_REGION_NAMES_BEGIN
EXCLUDE
binvcrhs
matmul_sub
matvec_sub
binvrhs
lhsinit
exact_solution
SCOREP_REGION_NAMES_END
Score-P filtering files support
Wildcards (shell globs)
Blacklisting
Whitelisting
Filtering based on filenames
M. Knobloch SC Introduction, May 2017 41Call-path Profile: Example (cont.)
## To verify effect of filter:
% scalasca -examine -s -f filter.txt \
scorep_myprog_Ppnxt_sum
##########################
## In the job script: ##
##########################
module load UNITE scalasca
scalasca -analyze -f filter.txt \
runjob --ranks-per-node P --np n [...] --exe ./myprog
##########################
## After job finished: ##
##########################
% scalasca -examine scorep_myprog_Ppnxt_sum
M. Knobloch SC Introduction, May 2017 42Call-path Profile: Example (cont.) M. Knobloch SC Introduction, May 2017 43
Call-path Profile: Example (cont.)

                                                     Box plot view shows
                                                     distribution across
                                                     processes/threads

     Distribution of
     selected metric
     across call tree

     When expanding,
     value changes
     from inclusive to
     exclusive                                                     Selection updates
                                                                   columns to the
                                                                   right

M. Knobloch              SC Introduction, May 2017                                     44
Call-path Profile: Example (cont.)
Split base
metrics into more
specific metrics
M. Knobloch SC Introduction, May 2017 45Score-P: Advanced Features
Sampling support
x86 only
Measurement can be extensively configured via
environment variables
Check output of “scorep-info config-vars”
for details
Allows for targeted measurements:
Selective recording
Phase profiling
Parameter-based profiling
…
Please ask us or see the user manual for details
M. Knobloch SC Introduction, May 2017 46Measurement of CUDA events
Record CUDA events using the CUPTI interface
% export SCOREP_CUDA_ENABLE=gpu,kernel,idle
Important record types:
runtime CUDA runtime API
driver CUDA driver API
gpu GPU activities
kernel CUDA kernels
Idle GPU compute idle time
memcpy CUDA memory copy
For all record types consult the Score-P user guide
M. Knobloch SC Introduction, May 2017 47Why is the Bottleneck There?
This is highly application dependent!
Might require additional measurements
Hardware-counter analysis
CPU utilization
Cache behavior
Selective instrumentation
Manual/automatic event trace analysis
M. Knobloch SC Introduction, May 2017 48HW Counter Measurements w/ Score-P
Score-P supports both PAPI preset and native counters
Available counters: papi_avail or papi_native_avail
% module load UNITE papi/5.0.1
% less $PAPI_ROOT/doc/papi-5.0.1-avail.txt
% less $PAPI_ROOT/doc/papi-5.0.1-native_avail.txt
% less $PAPI_ROOT/doc/papi-5.0.1-avail-detail.txt
Specify using “SCOREP_METRIC_PAPI” environment variable
##########################
## In the job script: ##
##########################
module load UNITE scalasca
export SCOREP_METRIC_PAPI=“PAPI_FP_OPS,PAPI_TOT_CYC“
scalasca -analyze -f filter.txt \
runjob --ranks-per-node P --np n [...] --exe ./myprog
M. Knobloch SC Introduction, May 2017 49Automatic Trace Analysis w/ Scalasca
Idea: Automatic search for patterns of inefficient behavior
Identification of wait states and their root causes
Classification of behavior & quantification of significance
Scalable identification of the critical execution path
Call
Property
path
Low-level
event trace
Analysis High-level
result
Location
Advantages
Guaranteed to cover the entire event trace
Quicker than manual/visual trace analysis
Helps to identify hot-spots for in-depth manual analysis
M. Knobloch SC Introduction, May 2017 50Trace Generation & Analysis w/ Scalasca
Enable trace collection & analysis using “-t” option of
“scalasca -analyze”:
##########################
## In the job script: ##
##########################
module load UNITE scalasca
export SCOREP_TOTAL_MEMORY=120MB # Consult score report
scalasca -analyze -f filter.txt -t \
runjob --ranks-per-node P --np n [...] --exe ./myprog
ATTENTION:
Traces can quickly become extremely large!
Remember to use proper filtering, selective instrumentation,
and Score-P memory specification
Before flooding the file system, ask us for assistance!
M. Knobloch SC Introduction, May 2017 51Scalasca Trace Analysis Example
Additional wait-state
metrics from the trace
analysis
Delay / root-cause
metrics
Critical-path profile
M. Knobloch SC Introduction, May 2017 52Vampir Event Trace Visualizer Offline trace visualization for Score-P’s OTF2 trace files Visualization of MPI, OpenMP and application events: All diagrams highly customizable (through context menus) Large variety of displays for ANY part of the trace http://www.vampir.eu Advantage: Detailed view of dynamic application behavior Disadvantage: Requires event traces (huge amount of data) Completely manual analysis M. Knobloch SC Introduction, May 2017 53
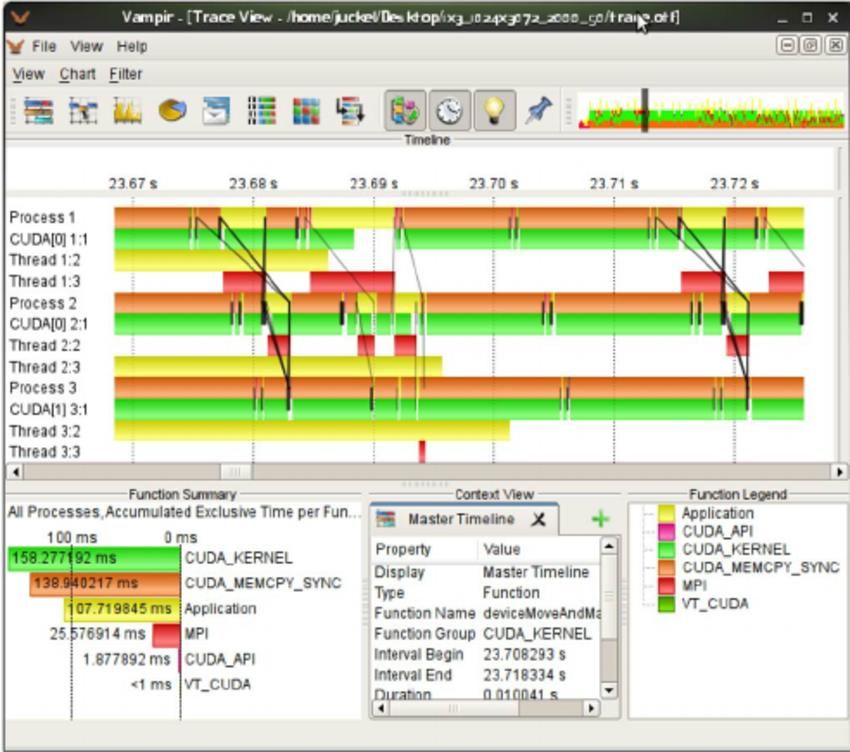
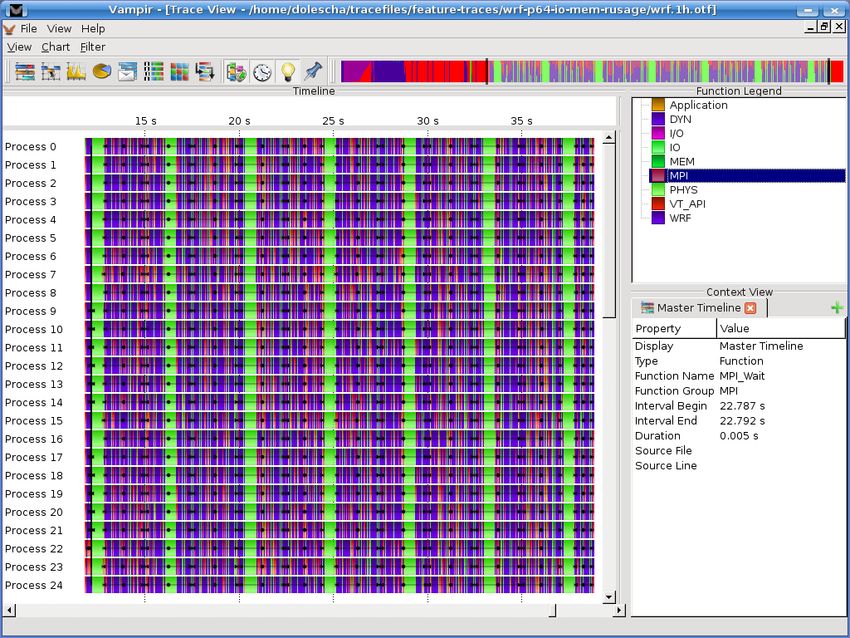
Vampir Displays

M. Knobloch       SC Introduction, May 2017   54
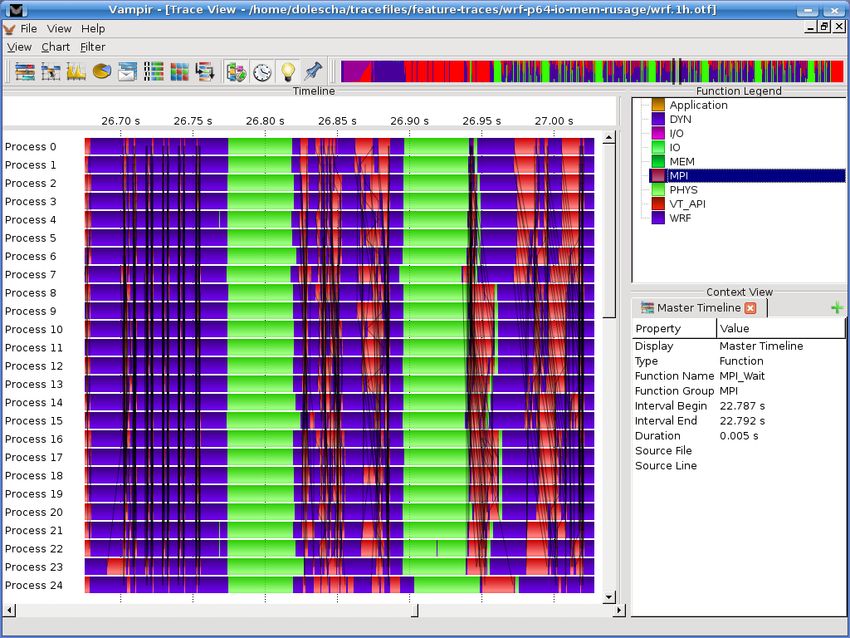
Vampir: Timeline Diagram Functions organized into groups Coloring by group Message lines can be colored by tag or size Information about states, messages, collective and I/O operations available through clicking on the representation M. Knobloch SC Introduction, May 2017 55
Vampir: Process and Counter Timelines Process timeline show call stack nesting Counter timelines for hardware and software counters M. Knobloch SC Introduction, May 2017 56
Vampir: Execution Statistics Aggregated profiling information: execution time, number of calls, inclusive/exclusive Available for all / any group (activity) or all routines (symbols) Available for any part of the trace selectable through time line diagram M. Knobloch SC Introduction, May 2017 57
Vampir: Process Summary Execution statistics over all processes for comparison Clustering mode available for large process counts M. Knobloch SC Introduction, May 2017 58
Vampir: Communication Statistics
Byte and message count,
min/max/avg message length
and min/max/avg bandwidth
for each process pair
Message length
statistics
Available for any part
of the trace
M. Knobloch SC Introduction, May 2017 59Vampir: CUDA Example Detailed information on kernel execution and memory transfers All statistics and displays also available for CUDA events M. Knobloch SC Introduction, May 2017 60
(Rice University)
Multi-platform sampling-based call-path profiler
Works on unmodified, optimized executables
http://hpctoolkit.org
Advantages:
Overhead can be easily controlled via sampling interval
Advantageous for complex C++ codes with many small
functions
Loop-level analysis (sometimes even individual source lines)
Supports POSIX threads
Disadvantages:
Statistical approach that might miss details
MPI/OpenMP time displayed as low-level system calls
M. Knobloch SC Introduction, May 2017 61HPCToolkit: Metric Specification
Specified via environment variable HPCRUN_EVENT_LIST
General format:
“name@interval [;name@interval ...]”
Possible sample sources:
WALLCLOCK
PAPI counters
IO (use w/o interval spec)
MEMLEAK (use w/o interval spec)
Interval: given in microseconds
E.g., 10000 → 100 samples per second
M. Knobloch SC Introduction, May 2017 62Example: hpcviewer
associated
source code
Callpath to
hotspot
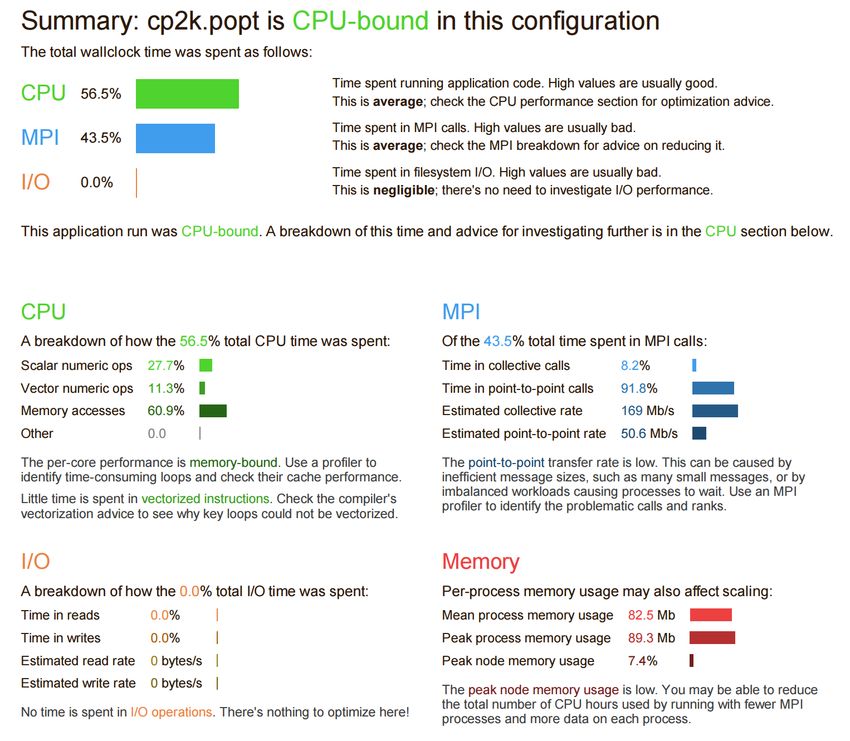
M. Knobloch SC Introduction, May 2017 63Allinea Performance Reports Single page report provides quick overview of performance issues Works on unmodified, optimized executables Shows CPU, memory, network and I/O utilization Supports MPI, multi-threading and accelerators Saves data in HTML, CVS or text form http://www.allinea.com/products/allinea-performance-reports Note: License limited to 512 processes (with unlimited number of threads) M. Knobloch SC Introduction, May 2017 64
Example Performance Reports

M. Knobloch    SC Introduction, May 2017   65
Allinea Performance Reports: Example

% module load AllineaPerformanceReports

##########################
## In the job script: ##
##########################

perf-report --mpi=“slurm“ \
    srun --procs-per-node=P --nodes=n [...] ./myprog [args]

##########################
## After job finished: ##
##########################

% less myprog_p_.txt
% firefox myprog_p_.html

M. Knobloch        SC Introduction, May 2017              66
Darshan
I/O characterization tool logging parallel application file access
Summary report provides quick overview of performance issues
Works on unmodified, optimized executables
Shows counts of file access operations, times for key
operations, histograms of accesses, etc.
Supports POSIX, MPI-IO, HDF5, PnetCDF, …
Doesn’t support mpif90 on BlueGene systems (use mpif77)
Binary log file written at exit post-processed into PDF report
http://www.mcs.anl.gov/research/projects/darshan/
Open Source: installed on many HPC systems
M. Knobloch SC Introduction, May 2017 67Example Darshan report extract M. Knobloch SC Introduction, May 2017 68
Darshan: Example (JURECA)

% load compiler and MPI module
% module load darshan-runtime darshan-util

##########################
## In the job script: ##
##########################

export LD_PRELOAD=$EBROOTDARSHANMINRUNTIME/lib/libdarshan.so
export DARSHAN_LOG_PATH=$PWD
export DARSHAN_LOGFILE=darshan.log
srun --tasks-per-node P --ntasks n [...] ./myprog [args]

##########################
## After job finished: ##
##########################

% darshan-job-summary.pl darshan.log
% gv darshan.pdf

M. Knobloch        SC Introduction, May 2017              69
Darshan: Example (JUQUEEN)

%   module load darshan
#   (re)link executable using darshan compiler wrapper
#   (if necessary, substitute mpif77 for Fortran90 compiler)
%   mpixlc –O3 –qsmp=omp –o myprog foo.c
%   mpixlf77 -O3 -qsmp=omp –o myprog foo.f90

##########################
## In the job script: ##
##########################

runjob --envs DARSHAN_LOG_PATH=$PWD \
       --envs DARSHAN_LOGFILE=darshan.log \
       --ranks-per-node P --np n [...] --exe ./myprog

##########################
## After job finished: ##
##########################
% darshan-job-summary.pl darshan.log
% gv darshan.pdf
M. Knobloch          SC Introduction, May 2017                 70
NVIDIA Visual Profiler
Part of the CUDA Toolkit
Supports all CUDA enabled GPUs
Supports CUDA and OpenACC on Windows, OS X and Linux
Unified CPU and GPU Timeline
CUDA API trace
Memory transfers, kernel launches, and other API functions
Automated performance analysis
Identify performance bottlenecks and get optimization
suggestions
Guided Application Analysis
Power, thermal, and clock profiling
M. Knobloch SC Introduction, May 2017 71NVIDIA Visual Profiler: Example
Timeline view
Detailed
information on
Kernel execution
Automatic analysis of
performance bottlenecks
M. Knobloch SC Introduction, May 2017 72TAU Very portable tool set for instrumentation, measurement and analysis of parallel multi-threaded applications http://tau.uoregon.edu/ Supports Various profiling modes and tracing Various forms of code instrumentation C, C++, Fortran, Java, Python MPI, multi-threading (OpenMP, Pthreads, …) Accelerators M. Knobloch SC Introduction, May 2017 73
TAU: Instrumentation
Flexible instrumentation mechanisms at multiple levels
Source code
manual
automatic
C, C++, F77/90/95 (Program Database Toolkit (PDT))
OpenMP (directive rewriting with Opari)
Object code
pre-instrumented libraries (e.g., MPI using PMPI)
statically-linked and dynamically-loaded (e.g., Python)
Executable code
dynamic instrumentation (pre-execution) (DynInst)
virtual machine instrumentation (e.g., Java using JVMPI)
Support for performance mapping
Support for object-oriented and generic programming
M. Knobloch SC Introduction, May 2017 74TAU: Basic Profile View M. Knobloch SC Introduction, May 2017 75
TAU: Callgraph Profile View

       Box width and
       color indicate
      different metrics

M. Knobloch               SC Introduction, May 2017   76
TAU: 3D Profile View
Height and color
indicate different
metrics
M. Knobloch SC Introduction, May 2017 77Documentation
To check latest status and versions
JUQUEEN: use “module avail”
JURECA: use “module spider”
Websites
http://www.fz-juelich.de/ias/jsc/juqueen/
http://www.fz-juelich.de/ias/jsc/jureca/
User Info
Parallel Debugging ( )
Parallel Performance Analysis ( )
http://www.vi-hps.org/training/material/
Performance Tools LiveDVD image
Links to tool websites and documentation
Tutorial slides
M. Knobloch SC Introduction, May 2017 78Support
For general support: sc@fz-juelich.de
Tool-specific support via corresponding mailing lists
Score-P: support@score-p.org
Scalasca: scalasca@fz-juelich.de
Workshops and Trainings:
Regular VI-HPS Tuning Workshops
Several days
Multiple tools, e.g. Score-P, Scalasca, Vampir, TAU, …
Bring-your-own-code
http://www.vi-hps.org/training/tws/
JUQUEEN Porting and Tuning Workshop Series
WS’s and trainings at several HPC conferences
M. Knobloch SC Introduction, May 2017 79POP CoE
A Center of Excellence
On Performance Optimization and Productivity
Promoting best practices in parallel
programming
Providing Services
Precise understanding of application and system behaviour
Suggestions/support on how to refactor code in the most
productive way
Horizontal
Transversal across application areas, platforms and scales
For (your?) academic AND industrial codes and users
The best: Currently free of charge
M. Knobloch SC Introduction, May 2017 80Motivation
Why?
Complexity of machines and codes
Frequent lack of quantified understanding of actual
behaviour
Not clear most productive direction of code refactoring
Important to maximize efficiency (performance, power)
of compute intensive applications and productivity of the
development efforts
What?
Parallel programs, mainly MPI/OpenMP
Also CUDA, OpenCL, OpenACC, Python, …
M. Knobloch SC Introduction, May 2017 81The process …
When?
October 2015 – March 2018
How?
Apply
Fill in small questionnaire
describing application and needs
https://pop-coe.eu/request-service-form
Questions? Ask pop@bsc.es
Selection/assignment process
Install tools @ your production machine (local, PRACE, …)
Interactively: Gather data Analysis Report
M. Knobloch SC Introduction, May 2017
82 82Services provided by the CoE
? Parallel Application Performance Audit Report
Primary service
Identify performance issues of customer code (at customer site)
Small effort (< 1 month)
! Parallel Application Performance Plan Report
Follow-up on the audit service
Identifies the root causes of the issues found and
qualifies and quantifies approaches to address them
Longer effort (1-3 months)
Proof-of-Concept Software Demonstrator
Experiments and mock-up tests for customer codes
Kernel extraction, parallelisation, mini-apps experiments to show
effect of proposed optimisations
6 months effort
M. Knobloch SC Introduction, May 2017 83You can also read