IDENTIFICATION OF BURGERS VECTORS OF THREADING DISLOCATIONS IN FREESTANDING GAN SUBSTRATES VIA MULTIPHOTON-EXCITATION PHOTOLUMINESCENCE MAPPING
←
→
Page content transcription
If your browser does not render page correctly, please read the page content below
Applied Physics Express

LETTER • OPEN ACCESS

Identification of Burgers vectors of threading dislocations in freestanding
GaN substrates via multiphoton-excitation photoluminescence mapping
To cite this article: Mayuko Tsukakoshi et al 2021 Appl. Phys. Express 14 055504

View the article online for updates and enhancements.

                               This content was downloaded from IP address 46.4.80.155 on 19/09/2021 at 20:38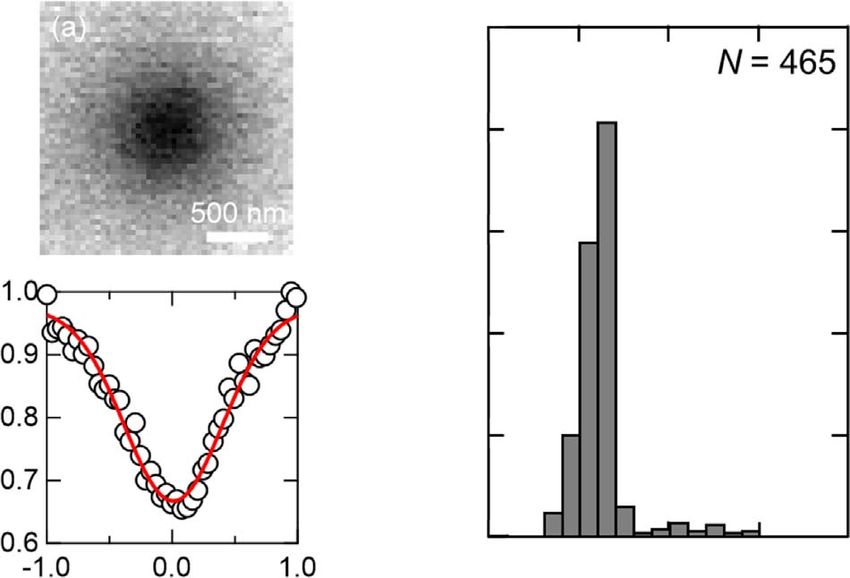
Applied Physics Express 14, 055504 (2021) LETTER
https://doi.org/10.35848/1882-0786/abf31b
Identification of Burgers vectors of threading dislocations in freestanding GaN
substrates via multiphoton-excitation photoluminescence mapping
Mayuko Tsukakoshi*, Tomoyuki Tanikawa*, Takumi Yamada, Masayuki Imanishi, Yusuke Mori, Masahiro Uemukai, and
Ryuji Katayama
Graduate School of Engineering, Osaka University, Suita, Osaka 565-0871, Japan
*
E-mail: tsukakoshi.m@qoe.eei.eng.osaka-u.ac.jp; tanikawa@eei.eng.osaka-u.ac.jp
Received March 9, 2021; revised March 23, 2021; accepted March 29, 2021; published online April 23, 2021
Burgers vectors b of threading dislocations in freestanding GaN substrates were identified through statistical classification using the etch pit and
multiphoton-excitation photoluminescence methods. The b = 1a + 1c threading mixed dislocations were propagated with large inclination angles
more than four degrees from the c-axis to minimize elastic strain energy. The b = 1c threading edge dislocations had a large contrast difference of
more than 0.4 in the photoluminescence image due to their strong nonradiative properties. Based on these characteristics obtained through
multiphoton-excitation photoluminescence measurements, major types of dislocations (b = 1a, 1a + 1c, 1c) could statistically be identified.
© 2021 The Japan Society of Applied Physics
V
ertical GaN power switching devices have recently nondestructive defect characterization. Raman spectroscopy
gained attention due to their high-current capability, can only identify the edge component of TDs from the peak
low on-state resistance, high breakdown voltage and shift of E2-high mode caused by the lattice distortion. The CL
high-speed switching operation.1,2) High-quality GaN free- method can characterize the distribution of TDs at the surface
standing substrates are required for this practical application by utilizing their nonradiative properties, but the CL signal is
because threading dislocations (TDs) in the substrates pro- sensitive to the surface preparation when the electron beam is
pagate into the homoepitaxial device structure and cause irradiated with low acceleration voltage for high spatial
current leakage and a decrease in breakdown voltage.3,4) resolution imaging. The MPPL method is robust to the
Growth methods, such as halide vapor phase epitaxy surface roughness because the excitation laser light can
(HVPE),5) the ammonothermal method6,7) and Na-flux penetrate the inside of the sample. Recently, the MPPL
method8) have been developed to obtain freestanding GaN method has attracted increasing interest as a nondestructive
substrates with low TD density. GaN substrates with TD and 3D defect characterization technology for widegap
densities in the range of 103–106 cm−2 are commercially semiconductor materials, such as GaN,19) SiC20) and
available.5–9) diamond.21) This work focuses on the advanced defect
To realize high-power and high-reliability operation for characterization in GaN crystals using the MPPL method
vertical GaN power devices, the negative influence of extended for defect identification based on a wide variety of informa-
defects on the device performance, including TDs, has been tion, such as local photoluminescence properties and 3D
studied and is still under debate. TDs are categorized by defect structures. The classification results of both the etch pit
Burgers vectors into threading edge dislocations (TEDs) with method and theoretical models are discussed.
Burgers vector b = n a = n /3 á 1120ñ, threading screw dislo- First, the TDs were characterized by the etch pit method.
cations (TSDs) with b = m c = m á 0001ñ and threading mixed The prepared sample was a ∼0.5 mm thick n-type c-plane
dislocations (TMDs) with b = n a + m c (n , m = 1, 2,). bulk GaN substrate grown by HVPE. Defect-selective
TSDs often cause current leakage in both p–n diodes and etching was performed by immersing the sample in molten
Schottky barrier diodes.4) Other reports suggested that TMDs KOH/NaOH eutectic mixture at 440 °C for 15 min.
can cause a current leakage path.10,11) Open-core TSDs, or so- Figure 1(a) shows an optical microscope image of the etched
called nanopipes, are rarely included in GaN, but they cause surface. Etch pits with hexagonal shape appear and the
significant current leakage.12,13) density is 4 × 106 cm−2. The pit sizes were measured by
There are a variety of characterization techniques for the diagonal length along the á 1120ñ direction of the
dislocations in GaN, such as transmission electron micro- hexagonal shape. The pit size ranged from 0.4–2.8 μm and
scopy (TEM),14) the etch pit method,15,16) Raman the pits are clearly classified into four groups. The average
spectroscopy,17) cathodoluminescence (CL) methods16,18) diameters of the small (S), medium (M), large (L) and extra-
and the multiphoton-excitation photoluminescence (MPPL) large (XL) pits are 0.7, 1.1, 1.7 and 2.7 μm, with densities of
method.19) TEM can identify the type of TDs, but it is 3 × 10⁶, 1 × 10⁶, 4 × 10⁴ and 3 × 104 cm−2, respectively. In
necessary to prepare an extremely thin sample and the addition, the M pits have two different appearances labeled
observation area is limited. The etch pit method can as M1 and M2 in Fig. 1(a). The M2 pits have a bright area
statistically classify the TDs by the size of pits originated in the center, implying that the cross-section is trapezoidal.
by the difference in the initial etching rate depending on the The etch pit size depends on the magnitude of Burgers
magnitude of Burgers vectors.16) Since the etch pit method vector b.22) The b = 1a TEDs have the smallest magnitude
requires destructive sample preparation, the sample cannot be of Burgers vector and correspond to the S pits.22) The
utilized for further device processing. Raman spectroscopy, Burgers vectors of the b = 1c TSDs and 1a + 1c TMDs
the CL method and MPPL method are utilized for have similar magnitude. Thus, these TDs may be related to
Content from this work may be used under the terms of the Creative Commons Attribution 4.0 license. Any further distribution of this
work must maintain attribution to the author(s) and the title of the work, journal citation and DOI.
055504-1 © 2021 The Japan Society of Applied PhysicsAppl. Phys. Express 14, 055504 (2021) M. Tsukakoshi et al.
Fig. 1. (a) Optical microscope image of etch pits. (b) 42 × 42 μm2 2D MPPL image taken at a depth of 22 μm. (c) 42 × 42 × 42 μm3 3D MPPL image,
shown with contrast inverted.
the M1 and M2 pits. Considering that the TSD-related etch
pits tend to form a trapezoidal shape,23) the M2 pits
correspond to the b = 1c TSDs. Accordingly, the M1 pits
correspond to the b = 1a + 1c TMDs.
Next, the TDs were characterized by the MPPL method
using a multiphoton-excitation microscopy system (Nikon
A1MP series).19) A femtosecond pulse laser with a wave-
length of 1030 nm was used as the excitation source. The
average excitation power was adjusted within 5–20 mW
using an acousto-optic modulator. The laser beam was
focused inside the sample by an objective lens with a
magnification of 50 and a numerical aperture of 0.80. At
the focal point, photoluminescence occurs via the multi-
photon absorption and subsequent carrier recombination
processes, and its intensity of the near-band-edge emission Fig. 2. (a)–(e) OM images and (f)–(j) MPPL images at the surface of etch
of GaN was detected with a photomultiplier tube. The focal pits. (k)–(o) Cross-sectional MPPL images. Corresponding etch pit sizes are
position was scanned in the in-plane direction using a labeled above (a)–(e).
Galvano scanner to obtain a 2D MPPL image. A 2D image
at a depth of 20 μm is shown in Fig. 1(b). TDs are observed discussed. As discussed above, the TDs below the S, M1 and
as dark spots because they act as nonradiative recombination M2 pits are considered to have Burgers vectors of b = 1a ,
centers.18) The dark spot density was 4 × 106 cm−2 and it was b = 1a + 1c and b = 1c, respectively. Since the TDs below
in good agreement with the etch pit density. The FWHM of the L pits had a complicated feature, complex Burgers
the dark spot was ∼1.2 μm. A 3D MPPL image of the vectors such as 2a + 1c can be expected because these
42 × 42 × 42 μm3 region was constructed from the TDs can react with adjacent ones, resulting in complicated
60 frames of 2D images taken by changing the focal plane propagation behavior, such as that shown in Fig. 2(n).
from the surface to the depth direction with a 0.70 μm step. Considering that the TSDs with large Burgers vectors, such
The actual position along the depth direction was corrected as 2c and 3c, have hollow-core construction and propagate
by considering the refractive index mismatch between GaN straight as nanonpipes,24) the TDs below the XL pits would
(nGaN = 2.34) and the air atmosphere (nair = 1).19) The 3D correspond to these TSDs.
MPPL image is shown in Fig. 1(c), in which the contrast is Based on the aforementioned findings, the statistical
inverted so that dark contrasts are shown as bright. Almost all classification of TDs via the MPPL measurement was
of the dark lines linearly propagate along the c-axis direction demonstrated. First, the TDs are classified by the contrast
with certain tilt angles. A few dark lines, less than 2%, have a difference in the dark spots observed in the 2D MPPL image.
complicated spiral feature. Assuming that the TDs are aligned parallel to the c-axis, the
The correlation between the etch pit size and the dark line MPPL intensity distribution is numerically analyzed in a
feature was investigated. Figures 2(a)–2(e) represent optical circular coordinate system. Figure 3(a) represents a 2D
microscope images of each of the pit sizes and Figs. 2(f)–2(o) MPPL image around the dark spot at a depth of 21 μm
show the MPPL images around the corresponding pits. The from the surface, and 1D intensity profile crossing the center
etch pit shapes are also observed in the 2D MPPL images at of the dark spot is plotted in Fig. 3(b). Photoluminescence
the surface, as shown in Figs. 2(f)–2(j). From the cross- intensity around the TD is influenced by the nonradiative
sectional MPPL images under the etch pits shown in recombination properties and minority carrier diffusion
Figs. 2(k)–2(o), all the dark lines are terminated at the etch length.25,26) In the MPPL system, the excitation volume
pits. The dark lines below the S, M1, M2 and XL pits had also influences the intensity profile because the excitation
linear shape whereas those below the L pits had a compli- diameter is on the same order as the diffusion length.19) In
cated feature. Considering that the properties of the dark lines addition, spherical aberration due to the refractive index
reflect the TD’s characters, the relationship between the etch mismatch between GaN and an air atmosphere causes the
pit size, dark line contrast and feature, and TD type is defocussing of the focal point, resulting in the increase in the
055504-2 © 2021 The Japan Society of Applied PhysicsAppl. Phys. Express 14, 055504 (2021) M. Tsukakoshi et al.
Fig. 3. (Color online) (a) 2D MPPL image around a dark spot at a depth of
21 μm. (b) 1D intensity profile crossing the center of the dark spot. (c) Fig. 4. (Color online) Correlation between inclination angle θ and azimuth
Histogram of the contrast difference between the dark spots. j and their histograms.
excitation volume.27) All possible phenomena should be distribution of the propagation direction can be regarded as
considered for an accurate discussion, but it will complicate being caused not only by the elastic strain energy, but by the
the analysis. In this study, the intensity profile of the dark macrostep motion at the growth front. When the threading
spot was analyzed using a 2D Gaussian function for roughly dislocations are located at the surface with macrosteps, they
estimating the amount of intensity decrease by nonradiative tend to bend slightly along the step-flow direction.29) Then,
recombination. The fitting result, shown by the solid line in the distribution has a peak at a certain angle. To prove this,
Fig. 3(b), is in good agreement with the experimental plots. further investigation is necessary. The density of the TDs
The contrast difference was defined as the normalized with large Burgers vectors such as b = 2c was quite small to
intensity decrease at the center of the dark spot from the find the statistical distribution, but these TDs tend to have
intensity at the peripheral area. A histogram of the contrast quite small θ, as can be seen in Fig. 2(o) and as reported in
difference of 465 numbers of dark spots was obtained, as the literature.13)
shown in Fig. 3(c). Most of the dark spots had a contrast Finally, the correlation between the contrast difference and
difference of ∼0.32, while the others had a large contrast the distribution of θ shown in Fig. 5 is discussed for
difference of more than 0.4. As shown in Figs. 2(c), 2(h) and estimating the densities of TEDs, TSDs and TMDs. Note
2(m), the dark line with a large contrast difference connected that it is difficult to distinguish the TDs having large Burgers
with the M2 pit. A previous report revealed that the TSDs vectors such as b = 2a + 1c and b = 2c from the histogram
cause the strongest nonradiative recombination.18) Therefore, because the density is quite small. We found that three types
the dark spots with a large contrast difference can be of TDs were distinguished. Major TDs have inclination
identified with the b = 1c TSDs. angles less than 4° and contrast differences less than 0.37,
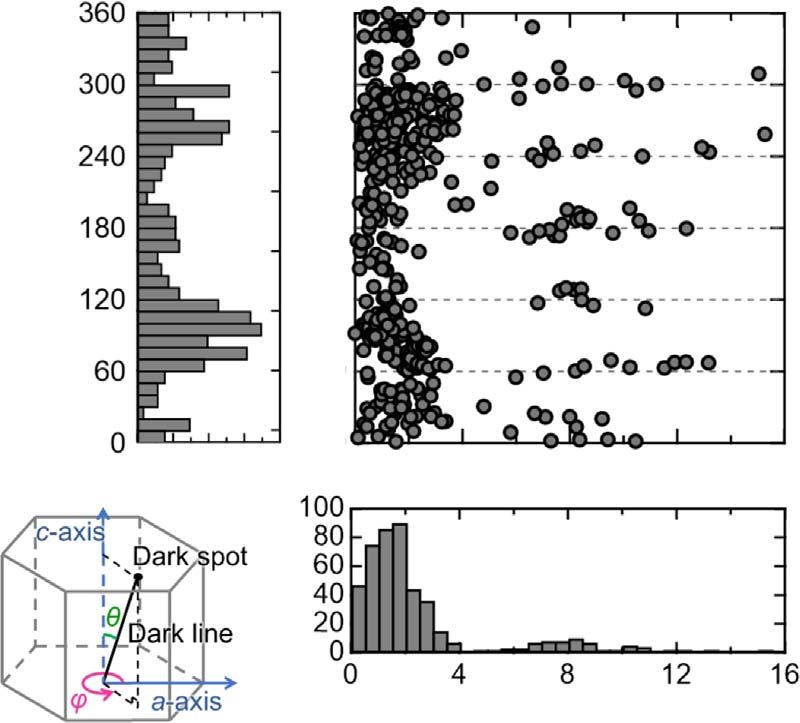
Next, the TDs are classified from their propagation habit. and they can be identified as the b = 1a TEDs. Some of the
To characterize the TDs’ propagation habit numerically, the other TDs have inclination angles larger than 4° and contrast
inclination angle θ from the c-axis and the azimuth angle j differences less than 0.37, while the other TDs have inclina-
from the a-axis were taken from 474 TDs. Note that the TDs tion angles smaller than 4° and contrast differences more than
with a spiral feature were excluded from the analysis because 0.37. The former can be identified as the b = 1a + 1c
it is difficult to identify θ and j. Figure 4 represents the TMDs, and accordingly the latter corresponds to the
distribution and histograms of θ and j. The histogram of θ b = 1c TSDs. From the statistical classification in
has two peaks. Thus, the TDs can be classified according to Figs. 3(c) and 4, the TD densities were estimated to be
θ. The difference in θ can be discussed by considering the
elastic strain energy around the TD. The propagation direc-
tion of the TD is determined by minimizing the elastic strain
energy. With regard to the direction of the Burgers vector, the
inclination angles can theoretically be estimated to be 15.6°
for the b = 1a + 1c TMDs and 0° for the b = 1c TSDs and
b = 1a TEDs.28) Therefore, the inclined TDs can be identi-
fied with the b = 1a + 1c TMDs. j with large θ was
distributed around the sixfold a-axes, as shown by the dashed
line in Fig. 4, implying the direction of sixfold b = 1a
components. In addition, the TDs with small θ correspond to
the b = 1a TEDs and b = 1c TSDs. These TDs are
randomly distributed in j, but the plots seem to have two
peaks at around 100 and 280 degrees. The reason is not
clear, but the possible mechanism can be discussed. The Fig. 5. Correlation between inclination angle θ and contrast difference.
055504-3 © 2021 The Japan Society of Applied PhysicsAppl. Phys. Express 14, 055504 (2021) M. Tsukakoshi et al.
Table I. Summary of classification results of TDs based on etch pit and MPPL methods and corresponding Burgers vectors.
Burgers vector 1a 1a + 1c 1c 2a + 1c etc. 2c, 3c etc.
Etch pit method Pit size S M1 (pyramidal) M2 (trapezoidal) L XL
MPPL method Contrast difference Small Small Large Small Small
TD line shape Linear Linear Linear Complicated Linear (most straight)
Tilt angle Small Large Small Complicated Small
Azimuth angle Random Sixfold symmetry Random Random Random
6) R. Dwilinski, R. Doradzinski, J. Garczynski, L. Sierzputowski,
2.9 × 10⁶, 8.1 × 10⁵ and 2.8 × 105 cm−2 for the b = 1a R. Kucharski, M. Zajac, M. Rudzinski, R. Kudrawiec, W. Strupinski, and
TEDs, b = 1a + 1c TMDs and b = 1c TSDs, respectively. J. Misiewicz, Phys. Status Solidi A 208, 1489 (2011).
Since the M1 and M2 pits cannot be distinguished from the 7) D. Tomida, Y. Kagamitani, Q. Bao, K. Hazu, H. Sawayama, S. F. Chichibu,
C. Yokoyama, T. Fukuda, and T. Ishiguro, J. Cryst. Growth 353, 59 (2012).
pit size, the densities of the S pits and the total of M1 and M2 8) M. Imade et al., Appl. Phys. Express 7, 035503 (2014).
were compared with the densities of the b = 1a TEDs and 9) T. Yoshida and M. Shibata, Jpn. J. Appl. Phys. 59, 071007 (2020).
the total of the b = 1a + 1c TMDs and b = 1c TSDs, 10) S. Usami, N. Mayama, K. Toda, A. Tanaka, M. Deki, S. Nitta, Y. Honda,
and H. Amano, Appl. Phys. Lett. 114, 232105 (2019).
respectively. These densities were in good agreement with
11) J. Wang, H. You, H. Guo, J. Xue, G. Yang, D. Chen, B. Liu, H. Liu,
each other. By revealing the edge components of the TDs by R. Zhang, and Y. Zheng, Appl. Phys. Lett. 116, 062104 (2020).
using Raman spectroscopy, the validity of this identification 12) S. W. Lee et al., Appl. Phys. Lett. 89, 132117 (2016).
will become clear.30) Table I summarizes the classification 13) S. Usami, A. Tanaka, H. Fukushima, Y. Ando, M. Deki, S. Nitta, Y. Honda,
and H. Amano, Jpn. J. Appl. Phys. 58, SCCB24 (2019).
results based on the etch pit and MPPL methods and
14) A. Sakai, Appl. Phys. Lett. 71, 2259 (1997).
suggested Burgers vectors. This strongly suggests the possi- 15) T. Hino, S. Tomiya, T. Miyajima, K. Yanashima, S. Hashimoto, and
bility of the nondestructive identification of Burgers vectors M. Ikeda, Appl. Phys. Lett. 76, 3421 (2000).
of the TDs in GaN based on the MPPL analysis. 16) Y. Yao, Y. Ishikawa, Y. Sugawara, D. Yokoe, M. Sudo, and N. Okuda,
Superlattices Microstruct. 99, 83 (2016).
In conclusion, the Burgers vectors of the TDs in GaN 17) N. Kokubo et al., Appl. Phys. Express 11, 6 (2018).
could be identified from the characteristics of nonradiative 18) Y. Yao, Y. Ishikawa, M. Sudo, Y. Sugawara, and D. Yokoe, J. Cryst.
properties and propagation habits by the MPPL method. The Growth 468, 484 (2017).
results obtained in this work will help the development of 19) T. Tanikawa, K. Ohnishi, M. Kanoh, T. Mukai, and T. Matsuoka, Appl.
Phys. Express 11, 031004 (2018).
high-crystalline-quality GaN bulk growth and related GaN 20) R. Tanuma and H. Tsuchida, Appl. Phys. Express 7, 021304 (2014).
devices as a novel nondestructive characterization tech- 21) S. Ohmagari, H. Yamada, N. Tsubouchi, H. Umezawa, A. Chayahara,
nology. Y. Mokuno, and D. Takeuchi, Phys. Status Solidi B 216, 1900498 (2019).
22) Y. Yao, Y. Ishikawa, Y. Sugawara, D. Yokoe, M. Sudo, N. Okada, and
Acknowledgments This study was supported by JSPS KAKENHI (Grant K. Tadatomo, Mater. Sci. Forum 897, 707 (2017).
Nos. JP19H04532, JP19K22043 and JP20H02640). The MPPL measurement was 23) L. Lu et al., J. Appl. Phys. 104, 123525 (2008).
performed with the help of Mr. Takashi Watanabe, Mr. Masashi Imai and Mr. 24) P. Pirouz, Philos. Mag. A 78, 727 (1998).
Kazuaki Kita of the Nikon Corporation. 25) K. Kumakura, T. Makimoto, N. Kobayashi, T. Hashizume, T. Fukui, and
H. Hasegawa, Appl. Phys. Lett. 86, 052105 (2005).
26) M. Albrecht, J. L. Weyher, B. Lucznik, I. Grzegory, and S. Porowski, Appl.
Phys. Lett. 92, 231909 (2009).
1) J. Millán, P. Godignon, X. Perpiñà, A. Pérez-Tomás, and J. Rebollo, IEEE 27) C. J. de Grauw, J. M. Vroom, H. T. M. van der Voort, and H. C. Gerritsen,
Trans. Power Electron. 29, 2155 (2014). Appl. Opt. 38, 5995 (1999).
2) T. Oka, Jpn. J. Appl. Phys. 5, SB0805 (2019). 28) S. K. Mathis, A. E. Romanov, L. F. Chen, G. E. Beltz, W. Pompe, and J.
3) B. S. Simpkins, E. T. Yu, P. Waltereit, and J. S. Speck, J. Appl. Phys. 94, S. Speck, J. Cryst. Growth 231, 371 (2001).
1448 (2003). 29) R. Tanuma, I. Kamata, J. P. Hadorn, and H. Tsuchida, J. Appl. Phys. 124,
4) S. Usami et al., Appl. Phys. Lett. 112, 182106 (2018). 125703 (2018).
5) Y. Oshima, T. Eri, M. Shibata, H. Sunakawa, K. Kobayashi, T. Ichihashi, 30) M. Tsukakoshi, R. Terada, T. Tanikawa, M. Uemukai, and R. Katayama,
and A. Usui, Jpn. J. Appl. Phys. 42, L1 (2003). (To be submitted).
055504-4 © 2021 The Japan Society of Applied PhysicsYou can also read