Identification of Melanoma from Nevus Images
←
→
Page content transcription
If your browser does not render page correctly, please read the page content below

Journal of Physics: Conference Series

PAPER • OPEN ACCESS

Identification of Melanoma from Nevus Images
To cite this article: S Bharathi et al 2021 J. Phys.: Conf. Ser. 1917 012027

View the article online for updates and enhancements.

 This content was downloaded from IP address 46.4.80.155 on 15/08/2021 at 11:21
NCAIEV21 IOP Publishing
Journal of Physics: Conference Series 1917 (2021) 012027 doi:10.1088/1742-6596/1917/1/012027

 Identification of Melanoma from Nevus Images

 Bharathi S1, Premchand J2, Nivedeethaa AS3, Kousiya M4 and Ajay Kumar V5
 12345
 Department of Electronics and Communication Engineering, Dr.Mahalingam College of
 Engineering and Technology, Pollachi, Tamilnadu, India.

 Email:bharathi_mani@yahoo.com

 Abstract. Melanoma is one of the fatal type skin cancers. The mortality rate is more
 severe than the present skin related diseases. Humans are prone to various diseases and are
 easily infected by them due to their adaptive and constrained lifestyle and melanoma is not an
 exception. Melanoma spreads faster and is less responsive to treatment in its later stages. Thus,
 harnessing the disease rate becomes more enigmatic and initial diagnosis is the need.
 Melanoma and nevus are akin and show analogous symptoms and traits. In order to overcome
 this, we use the technique of image processing to segregate Melanoma and nevus. The input
 image is processed in such way that the noise in the image (skin lesion) is removed using
 median filter and is segmented using improved K-means clustering. From the lesion necessary
 textural and chromatic features are extracted and a unique feature vector is formulated.
 Melanoma and Nevus are segregated using both Adaptive Neuro-Fuzzy inference System
 (ANFIS) and Feed-Forward Neural Network (FFNN). The skin images from DERMIS dataset
 is used in this work and it has 1023 skin images including 104 melanoma and 917 nevus
 images. Our proposed methodology provides efficient results having 97.3% and 96.8%
 accuracy for ANFIS and FFNN classifiers.

1. Introduction

Skin cancer is a leading cause of death globally [1]. There are several cancers that have been identified
and are being treated. Skin cancer, on the other hand, is now one of the most rapidly spreading
cancers. Skin cancer diagnoses are growing at a faster rate than any other cancer type, according to
recent studies. The most common form of melanoma is Melanocytes affecting the surface cells in the
epidermis of the skin. It is made up of cells that make the skin dark (black) and is also blue, tan, dark
brown, light grey, red etc.,[2]. This form of cancer is alarming because of its proclivity for metastasis.
Melanoma is most prominently found beside the knee around calf muscles of the legs and can be
omnipresent on the human body. Diagnosing this disease at its initial stage significantly reduces the
mortality rate and increases the survival rate. According to the findings, the mortality rate may be
lowered. If skin cancer is detected at an early stage, it can be cured in up to 90% of cases. Detection
and classification of melanoma (Skin cancer) at its initial outset is an uphill task [3]. ABCD rule is one
of the traditional methods used by researchers to diagnose melanoma and nevus. Each of the ABCD
features [4] receives a total dermoscopic ranking, with ‘A’ representing asymmetry and ‘B’
representing border irregularity. Color variations are represented by ‘C’ and Diameter is represented
by ‘D’. Each feature is given a weight, based on its importance in the feature space.

 Content from this work may be used under the terms of the Creative Commons Attribution 3.0 licence. Any further distribution
 of this work must maintain attribution to the author(s) and the title of the work, journal citation and DOI.
Published under licence by IOP Publishing Ltd 1
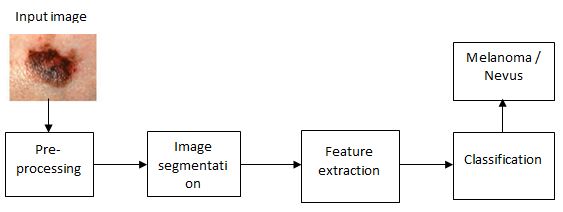
NCAIEV21 IOP Publishing
Journal of Physics: Conference Series 1917 (2021) 012027 doi:10.1088/1742-6596/1917/1/012027

2. Review of related works
In [5], authors have developed an epidermal disease classification system incorporating an advance
methodology of image transformation in order to detect skin diseases such as skin cancer, psoriasis
and dermatophilosis, the disease diagnosis and classification are built on statistical parameter analysis.
Delia-Maria and Adriana[6] attempt to develop a System that put forward a classification erythemato
class, the system was embellished and reinforced using MATLAB with 6 neurons in the output layer
and 10 neurons in the hidden layer of its neural network . It has been trained using back propagation
learning algorithm, the system also has 33 inputs of clinical and histopathological feature of the
patients, based on these features and the predicted disease, the system provides suggestions of the
medical treatments of the patient.

 Sarika Choudhari and Seema Biday [7] have proposed a computer assisted disease recognition
system for Skin Cancer, based on images from the skin that were enhanced by applying many pre-
processing techniques, Dull Razor technique to remove hair, obtaining the grayscale of the image,
contrast enhancement and median filter to remove noise, the infected area was segmented from the rest
of the skin according to its binarized grey level by applying Maximum Entropy. Histogram of grey
scale values (co-occurrence matrix) was implemented to bring out the features of the enhanced image,
multilayers ANN along with back propagation algorithm was implemented as a classifier and they are
trained based on the extracted features and their methodology has got 86.66% as accuracy. Rahat
Yasir et al., [8] have proposed techniques based on computer vision in order to identify specific
dermatosis from colour images and their proposed system effectively detects nine varieties of dermal
illness at 90% accuracy. From the ten, seven features were extracted from user’s input and three
features were extracted from the image. They have trained these ten features as input using an ANN to
find the skin illnesses.

 In [9], authors have proposed a system which enables users to recognize only three skin diseases
and provides treatments , also many image processing and data mining techniques have been
implemented in this system, skin images were enhanced using both median and Gaussian filters,
thresholding segmentation was applied, then Morphological operations are used to extract the
enhanced image, these features along with external information from the user present the input to
many classifiers (Ada Boost, Bayes Net, J48, MLP, Naïve Bayes), both MLP and J84 were better than
the rest with accuracy more that 85%, but the system can only recognize 3 diseases(Eczema, Impetigo
and Melanoma), also camera lens was placed at a distance of 5cm from the affected skin 5cm in
Addition it only developed for window operating system. Computer aided skin disease detection
system [10-13] using digital image transformation techniques for segmented classification of diseased
skins was developed and unique features of the images were extracted for classification. Total
Dermoscopy score (TDS) index is calculated from the extracted features to determine the existence of
a cancer disease. The output given by this system will help the dermatologist to detect the lesion and
its type, but it can’t be implemented as standalone equipment for the diagnosis process.

 Haofu Liao [14] examined deep into a reliable diagnosis system using deep convolutional neural
network (CNN), the dataset used in the model is from two main sources, Dermnet dataset and OLE
dataset. The resultant accuracy of the test using the Dermnet dataset was 73.1% and the accuracy when
testing with OLE dataset was 61.7%. This model can be improved by collecting data from extra
resources and in addition to its low accuracy their system is of high computational cost. Since training
CNN requires computational resources of high performance and will be very time consuming.

3. Proposed method
The flow of work is described in the block diagram in figure 1. It has various image processing stages
like pre-processing, segmentation of image, extraction of feature and classification of images.

 2
NCAIEV21 IOP Publishing
Journal of Physics: Conference Series 1917 (2021) 012027 doi:10.1088/1742-6596/1917/1/012027

 Figure 1. Block diagram of our proposed method

3.1. Pre-processing
This technique is applied to modify the image to the required format for further analysis. Here,
initially the input image is resized and its contrast is enhanced such that affected portion is
distinguished from the normal one. Then it is subjected to filtering process in order to withdraw the
unwanted noises in the present image. Here a median filter is employed to do the noise removal
process. Median Filtering is a non-linear technique to remove noise from an image. The edges of the
image are preserved during the noise removal process proving to be efficient and hence it is broadly
used. When the probability density of the noise amplitude has large tails and periodic patterns, median
filters are used in reducing random noise. Using this filter, a kernel slides throughout the image, and
the output pixel intensity becomes the median value of the intensity of pixels within the kernel. The
images at the various stages of pre-processing are shown in figure 2.

 Input image Contrast enhanced Filtered image
 image

 Figure 2. Images at various stages of pre-processing

3.2. Segmentation

Image segmentation is used to group similar set of pixels in an image for further processing. There are
varieties of segmentation techniques available in order to partition the image pixels. Out of them K-
mean clustering is most widely used in various applications. K-means is the peculiar technique for k-
number of cluster formation from data points and grouping such that based on the intensity of image, it
is divided into non-overlapping pixel groups. It involves the criteria of choosing optimum centroids
and based on the minimum distance from the centroids they are grouped. Following, successive trails,
centroids are identified from the mean values of the obtained clusters for the next iteration. The cycle
of iteration continues till no variation is obtained from the centroids. The put forth k-means uses a
centroid selection technique to initialize its centroid as depicted in the equation (1).

 3
NCAIEV21 IOP Publishing
Journal of Physics: Conference Series 1917 (2021) 012027 doi:10.1088/1742-6596/1917/1/012027

 ( ) (1)

Where, C is the total number of clusters, ‘p’ is the greatest pixel value and ‘c’ range between 1 to ‘C’.
The method of selection pretends to be more proficient and proliferic ensuring substantial difference
between the initialized centroids by converging to the last location in few iterations. In our system, the
input images are lesions present on the skin such that C is made as 3, so that from the background,
lesion present in the foreground is extracted.

3.3. Feature extraction

The texture of the image varies at different locations based on the intensities of the pixel. This enables
us to extract textural features from the given image leading to adopt global feature extraction method.
The statistical distribution of the pixel intensities are extracted using Grey level histogram matrices.
The varying intensity in the different locations of the image yields the order of statistical distribution.
Usually, the color of the object is decided by the color which is reflected from it. The color space of
the picture can be found by analyzing the basic primary colors called red, green and blue present in it.
Through these color spaces of RGB, many values along with skewness are utilized to extract color
feature from the visible color of the segmented lesion.

3.4. Classification

After extraction of the required features from the segmented images, the melanoma and nevus are
identified from the classifier. In order to achieve enhanced accuracy, many algorithms with its default
parametric conditions are trained and trailed with the segmented images. Here in this proposed work,
Adaptive neuro-fuzzy inference along with Feed-Forward neural network are used for classification.

3.4.1 Adaptive Neuro Fuzzy Inference System

Fuzzy system frameworks are determined using a combination of neural network and fuzzy system
algorithms. Using neural fuzzy system, incorporating appropriate procedures the unexplored
parameters of the system is defined. As an architecture, the ANFIS uses various learning algorithms
that are composed of input-output data and if-then-else rules. Moreover, unreliable and noisy images
can be handled by ANFIS along with complex mappings to be manipulated. This also involves some
of the fuzzy inference techniques. The membership function and the parameters that are associated
with the datasets are trained using ANN. In this work, triangular membership function (equation 2)
and Mamdani’s model are used for classification. The ANFIS architecture is depicted in figure 3.
Figure 4 represents the triangular function and is defined by a lower limit a, an upper limit b, and a
value m, where a < m < b

 4
NCAIEV21 IOP Publishing
Journal of Physics: Conference Series 1917 (2021) 012027 doi:10.1088/1742-6596/1917/1/012027
Figure 3. ANFIS architecture
( ) (2)
{ }
Figure 4. Triangular membership function
.
3.4.2 IF-THEN Rules:
The Antecedent or precondition belongs to the IF part and consequent belongs to THEN part. In order
to implement IF-THEN rules the former precondition along with attributes of the tests are logically
ANDed. Appropriate nonlinear learning capabilities are possessed by ANFIS system along with IF-
THEN rules. The following if-then rules are implemented in the proposed work.
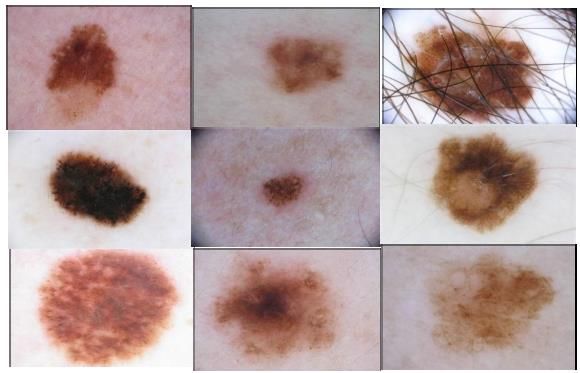
5NCAIEV21 IOP Publishing Journal of Physics: Conference Series 1917 (2021) 012027 doi:10.1088/1742-6596/1917/1/012027 Rule 1: If (x is A1) and (y is B1) then (z1 = p1x + q1y+r1) Rule 2: If (x is A2) and (y is B2) then (z2 = p2x + q2y+r2) where x and y are the inputs, Ai and Bi are the fuzzy sets, zi (i = 1,2) are the outputs within the fuzzy region. fuzzy rules specify the fuzzy region. The parameters such as pi, qi, ri are identified. 3.4.3 Feed-forward neural network (FFNN) It is an artificial neural network. The nodes present in them do not configure a loop or cycle among them and simple neuron-like processing units are encoded in layers that are biologically inspired. All the units in the layers are connected with every other unit. The connections are unequal and they have varied strengths and weights. The knowledge of the network connection is encoded on the weights. Nodes are the units of neural network. The output is obtained only after layer-by-layer processing of data stating from the input of the network. In the feed-forward neural networks, feedback between layers is nil when it pretends to be a classifier. Input, hidden and output layers are the three major layers present in this architecture. The complexity of the network is governed by the layer formed from nodes. The nodes present in the sequential layers are completely connected. Accordingly, new features can be obtained when there are higher numbers of layers and nodes. The Feed-forward neural network structure is shown in figure 5. In this proposed work, we have used three hidden layer comprised of 70 features present in our data governs the total number of hidden layers. Based on the modelling type the output data is formulated. In this case, a binary output (Melanoma/Nevus) is to be predicted and the output layer contain only one node in order to predict the probability of success. Figure 5. Structure of Feed-forward neural network 3.5. Dataset and Evaluation metrics Skin images used in this work are obtained from DermIS skin image database [18]. There are totally 1023 skin images in the database, out of which 104 belongs to malignant melanoma and 919 nevus images. Sample images from Dermis dataset are shown in figure 6. The classification performance of the proposed system is deliberated here in terms of the metrics such as true positive, true negative, false positive and false negative. If the system detects the input melanoma image as melanoma then it belongs to a true positive (TP) class and when it detects the output image as nevus when it belongs to melanoma then it falls under the category of True negative. Whereas when the input image categorized as melanoma even when it does not belong to melanoma then it is false positive and a false negative (FN) occurs when the input is melanoma and is categorized as nevus. 6
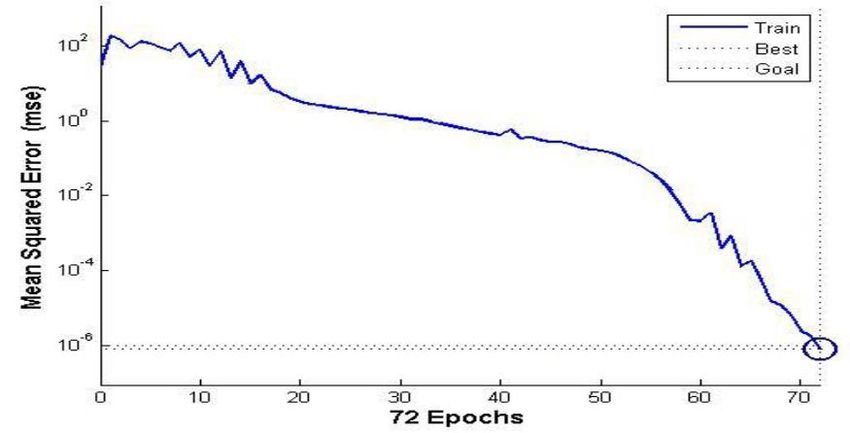
NCAIEV21 IOP Publishing
Journal of Physics: Conference Series 1917 (2021) 012027 doi:10.1088/1742-6596/1917/1/012027

 Accuracy can be defined as the ratio between the total sum of truly detected cases and the total
number of input test images and the formula is depicted in the equation (3).

 + (3)

 + + +

 Figure 6. Sample images from Dermis dataset

4. Results and Discussion

The experimental results of the proposed method for identifying melanoma from nevus in the skin
images are discussed here. The preprocessed image is subjected to segmentation and from that the
required features are extracted and classified using ANFIS and Feed forward neural network. figure 7
depicts the metrics of the system incorporating the classifiers. From the graph it is observed that using
ANFIS the system performance increases with the number of features of the input image and using
FFNN the best training performance is 8.0764e-07 and it occurs at 72nd epoch. This shows the
improved performance of the system.

 The confusion matrices obtained for the system using ANFIS and FFNN are shown in the tables
1 and 2 respectively.

 7
NCAIEV21 IOP Publishing
Journal of Physics: Conference Series 1917 (2021) 012027 doi:10.1088/1742-6596/1917/1/012027

 (a) (b)

 Figure 7. Performance of the system using (a) ANFIS (b) FFNN

 Table 1. Confusion matrix using ANFIS Table 2. Confusion matrix using FFNN

 Class Actual Class Actual

 Melanoma Nevus Melanoma Nevus

 Melanoma 104 31 Melanoma 104 33

Predicted TP FP Predicted TP FP

 Nevus 0 888 Nevus 0 886

 FN TN FN TN

From the above tables, Accuracy value of the system using ANFIS and FFNN are found to be 97.3%
and 96.8%. These results are compared with the existing methodologies on the same DermIS data base
and its analysis is instantiated in the table 3.

 Table 3. Comparative analysis of related work
 S. No Author Number Data Technique Features Accuracy
 of images base adopted
 1 Proposed method 1023 DermIS ANFIS GLCM, 97.3%
 Statistical features
 FFNN GLCM, 96.8%
 Statistical
 features
 2 Robert Amelard 206 DermIS SVM HLIF 94%
 [17]
 3 Ebtihal 227 DermIS SVM GLCM+ LBP 90%
 Almanur[16]
 4 M. Ali [15] 112 DermIS SVM Color, shape, 80%
 GLCM
 5 Rebecca [13] 89 DermIS KNN ABCD 89%

 8
NCAIEV21 IOP Publishing
Journal of Physics: Conference Series 1917 (2021) 012027 doi:10.1088/1742-6596/1917/1/012027

5. Conclusion

As mentioned earlier this disease is severe and dermatologists struggle to harness the rate of its
spreading. This proposed system is used to identify the melanoma from Nevus in the skin images
easily. Computer aided system is proposed here to resolve the difficulties using ANFIS and FFNN as a
classifier. The developed system performs the required work with accuracy 97.3% using ANFIS and
96.8% using FFNN classifiers. The proposed system determines the accuracy from the various
evaluation parameters. The experimental results proclaim improved performance in regard with the
state of art approaches, authenticating the reliability of our work.

References
[1] Aleem M, Hameed N, Anjum A and Hameed F 2016 m-Skin Doctor: A mobile enabled system
 for early melanoma skin cancer detection using support vector machine, e Health, vol. 2, pp.
 468–475.
[2] Kasmi R and Mokrani K 2016 Classification of malignant melanoma and benign skin lesions:
 Implementation of automatic ABCD rule, IET Image Process., vol. 10, no. 6, pp. 448–455.
[3] Silveira M, J. C. Nascimento J C, Marques J S, Marcal A R S, Mendonca T, Yamauchi S,
 Maeda J, and Rozeira J 2009 Comparison of segmentation methods for melanoma diagnosis in
 dermoscopy images, IEEE J. Sel. Topics Signal Process., vol. 3, no. 1, pp. 35–45.
[4] Johr R H, 2002 Dermoscopy: Alternative melanocytic algorithms-the ABCD rule of
 dermatoscopy, Menzies scoring method, and 7-point checklist, Clin. Dermatol. vol. 20, no. 3,
 pp. 240–247.
[5] Pravin S A and Shirsat A S 2016, A Image analysis System to detect Skin Disease, IOSR
 Journal of VLSI and Signal Processing, vol.2, pp. 124 – 13.
[6] Delia Maria F and Adriana A L 2014, Skin Diseases Diagnosis using Artificial Neural
 Networks, 9th IEEE International Symposium on Applied Computational Intelligence and
 Informatics, May 15-17, Timişoara, Romania.
[7] Choudhari S and Biday S 2014, Artificial Neural Network for skin cancer detection,
 International Journal of Emerging Trends & Technology in Computer Science, vol. 3, no.5, pp.
 147-153.
[8] Rahat Yasir, Md. Ashiqur Rahman and Nova Ahmed 2014, Dermatological disease detection
 using image processing and artificial neural network, IEEE 8th International Conference on
 Electrical and Computer Engineering, Dhaka, Bangladesh.
[9] Amarathunga A A L C, Ellawala E P W C, Abeysekara G N and Amalraj C R J 2015, Expert
 System for diagnosis of skin diseases, International Journal of Scientific & Technology
 Research, vol 4, no.1, pp.174-178.
[10] Suneel Kumar and Ajit Singh 2016, Image Processing for Recognition of Skin Diseases,
 International Journal of Computer Applications vol.149, no.3, pp:37-40.
[11] Dorj U O, Lee K K, Choi J Y and Lee M 2018, The skin cancer classification using deep
 convolutional neural network, Multimed. Tools Appl., vol.77, no.8, pp. 9909–9924.
[12] Oliveira R B, Papa J P, Pereira A S and Tavares J M R S 2018, Computational methods for
 pigmented skin lesion classification in images: review and future trends, Neural Computing and
 Applications, vol. 29, no. 3. pp. 613–636.
[13] Moussa R, Gerges F, Salem C, Akiki R, Falou O and Azar D 2016, Computer-aided detection of
 Melanoma using geometric features, Middle East Conf. Biomed. Eng.
[14] Haofu Liao, Yuncheng Li and Jiebo Luo 2016, Skin disease classification versus skin lesion
 characterization: Achieving robust diagnosis using multi-label deep neural networks, 23rd
 International Conference on Pattern Recognition (ICPR), Cancun, Mexico.
[15] Farooq M A, Azhar M A M, and Raza R H 2016, Automatic lesion detection system (ALDS) for
 skin cancer classification using SVM and neural classifiers, Proc. IEEE 16th Int. Conf. Bioinf.
 Bioeng. (BIBE), pp. 301-308.

 9
NCAIEV21 IOP Publishing
Journal of Physics: Conference Series 1917 (2021) 012027 doi:10.1088/1742-6596/1917/1/012027

[16] Almansour E and M. Jaffar M A 2016, Classification of Dermoscopic skin cancer images using
 color and hybrid texture features, Int. J. Comput. Sci. Netw. Secur, vol. 16, no. 4, pp. 135-139.
[17] Amelard R, Glaister J, Wong A and Clausi D A 2015, High-level intuitive features (HLIFs) for
 intuitive skin lesion description, IEEE Trans. Biomed. Eng., vol. 62, no. 3, pp. 820-831.
[18] https://www.dermis.net

 10
You can also read