ImageNet: A Large-Scale Hierarchical Image Database
←
→
Page content transcription
If your browser does not render page correctly, please read the page content below
ImageNet: A Large-Scale Hierarchical Image Database

                     Jia Deng, Wei Dong, Richard Socher, Li-Jia Li, Kai Li and Li Fei-Fei
                            Dept. of Computer Science, Princeton University, USA
                     {jiadeng, wdong, rsocher, jial, li, feifeili}@cs.princeton.edu

                         Abstract                                    content-based image search and image understanding algo-
                                                                     rithms, as well as for providing critical training and bench-
   The explosion of image data on the Internet has the po-           marking data for such algorithms.
tential to foster more sophisticated and robust models and               ImageNet uses the hierarchical structure of WordNet [9].
algorithms to index, retrieve, organize and interact with im-        Each meaningful concept in WordNet, possibly described
ages and multimedia data. But exactly how such data can              by multiple words or word phrases, is called a “synonym
be harnessed and organized remains a critical problem. We            set” or “synset”. There are around 80, 000 noun synsets
introduce here a new database called “ImageNet”, a large-            in WordNet. In ImageNet, we aim to provide on aver-
scale ontology of images built upon the backbone of the              age 500-1000 images to illustrate each synset. Images of
WordNet structure. ImageNet aims to populate the majority            each concept are quality-controlled and human-annotated
of the 80,000 synsets of WordNet with an average of 500-             as described in Sec. 3.2. ImageNet, therefore, will offer
1000 clean and full resolution images. This will result in           tens of millions of cleanly sorted images. In this paper,
tens of millions of annotated images organized by the se-            we report the current version of ImageNet, consisting of 12
mantic hierarchy of WordNet. This paper offers a detailed            “subtrees”: mammal, bird, fish, reptile, amphibian, vehicle,
analysis of ImageNet in its current state: 12 subtrees with          furniture, musical instrument, geological formation, tool,
5247 synsets and 3.2 million images in total. We show that           flower, fruit. These subtrees contain 5247 synsets and 3.2
ImageNet is much larger in scale and diversity and much              million images. Fig. 1 shows a snapshot of two branches of
more accurate than the current image datasets. Construct-            the mammal and vehicle subtrees. The database is publicly
ing such a large-scale database is a challenging task. We            available at http://www.image-net.org.
describe the data collection scheme with Amazon Mechan-                  The rest of the paper is organized as follows: We first
ical Turk. Lastly, we illustrate the usefulness of ImageNet          show that ImageNet is a large-scale, accurate and diverse
through three simple applications in object recognition, im-         image database (Section 2). In Section 4, we present a few
age classification and automatic object clustering. We hope          simple application examples by exploiting the current Ima-
that the scale, accuracy, diversity and hierarchical struc-          geNet, mostly the mammal and vehicle subtrees. Our goal
ture of ImageNet can offer unparalleled opportunities to re-         is to show that ImageNet can serve as a useful resource for
searchers in the computer vision community and beyond.               visual recognition applications such as object recognition,
                                                                     image classification and object localization. In addition, the
                                                                     construction of such a large-scale and high-quality database
1. Introduction                                                      can no longer rely on traditional data collection methods.
                                                                     Sec. 3 describes how ImageNet is constructed by leverag-
    The digital era has brought with it an enormous explo-           ing Amazon Mechanical Turk.
sion of data. The latest estimations put a number of more
than 3 billion photos on Flickr, a similar number of video           2. Properties of ImageNet
clips on YouTube and an even larger number for images in                 ImageNet is built upon the hierarchical structure pro-
the Google Image Search database. More sophisticated and             vided by WordNet. In its completion, ImageNet aims to
robust models and algorithms can be proposed by exploit-             contain in the order of 50 million cleanly labeled full reso-
ing these images, resulting in better applications for users         lution images (500-1000 per synset). At the time this paper
to index, retrieve, organize and interact with these data. But       is written, ImageNet consists of 12 subtrees. Most analysis
exactly how such data can be utilized and organized is a             will be based on the mammal and vehicle subtrees.
problem yet to be solved. In this paper, we introduce a new
image database called “ImageNet”, a large-scale ontology             Scale ImageNet aims to provide the most comprehensive
of images. We believe that a large-scale ontology of images          and diverse coverage of the image world. The current 12
is a critical resource for developing advanced, large-scale          subtrees consist of a total of 3.2 million cleanly annotated

                                                                 1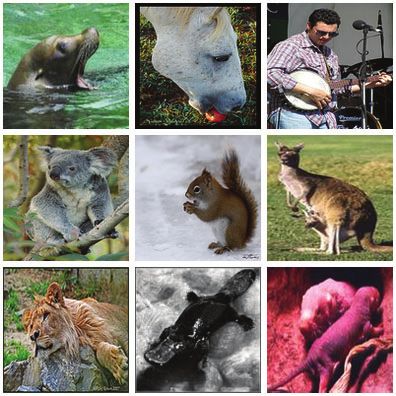
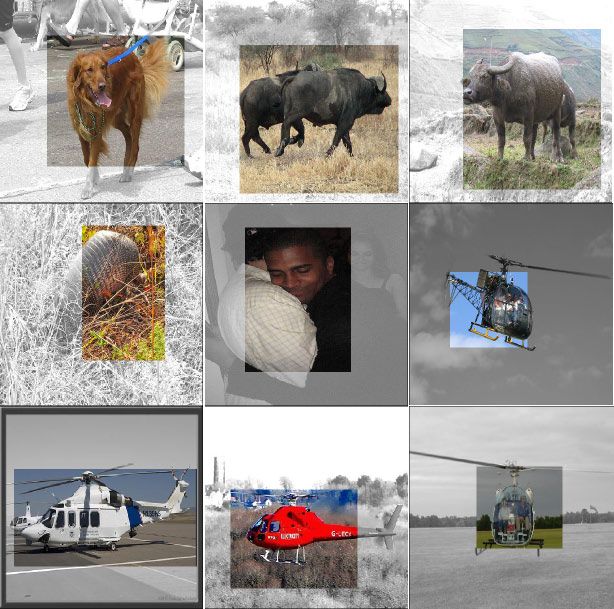
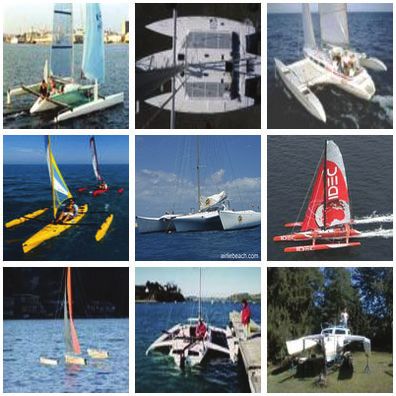
mammal                         placental               carnivore            canine                dog            working dog          husky

      vehicle                            craft                  watercraft          sailing vessel                sailboat            trimaran

Figure 1: A snapshot of two root-to-leaf branches of ImageNet: the top row is from the mammal subtree; the bottom row is from the
vehicle subtree. For each synset, 9 randomly sampled images are presented.

                                                                                         ESP Cat Subtree               Imagenet Cat Subtree
                              Summary of selected subtrees
                  0.2
                                                Avg. synset   Total #                      376
                          Subtree     # Synsets
                                                   size       image
                         Mammal         1170        737         862K
                 0.15
    percentage

                         Vehicle         520        610         317K
                         GeoForm         176        436         77K                                          1830
                         Furniture       197        797         157K
                  0.1    Bird            872        809         705K
                         MusicInstr      164        672         110K

                 0.05

                                                                                        ESP Cattle Subtree            Imagenet Cattle Subtree
                    0
                     0      500        1000       1500        2000      2500        176
                                  # images per synset

                                                                                                           1377
Figure 2: Scale of ImageNet. Red curve: Histogram of number
of images per synset. About 20% of the synsets have very few
images. Over 50% synsets have more than 500 images. Table:                          Figure 3: Comparison of the “cat” and “cattle” subtrees between
Summary of selected subtrees. For complete and up-to-date statis-                   ESP [25] and ImageNet. Within each tree, the size of a node is
tics visit http://www.image-net.org/about-stats.                                    proportional to the number of images it contains. The number of
                                                                                    images for the largest node is shown for each tree. Shared nodes
                                                                                    between an ESP tree and an ImageNet tree are colored in red.
images spread over 5247 categories (Fig. 2). On average
over 600 images are collected for each synset. Fig. 2 shows
the distributions of the number of images per synset for the                        gory labels into a semantic hierarchy by using WordNet, the
current ImageNet 1 . To our knowledge this is already the                           density of ImageNet is unmatched by others. For example,
largest clean image dataset available to the vision research                        to our knowledge no existing vision dataset offers images of
community, in terms of the total number of images, number                           147 dog categories. Fig. 3 compares the “cat” and “cattle”
of images per category as well as the number of categories 2 .                      subtrees of ImageNet and the ESP dataset [25]. We observe
                                                                                    that ImageNet offers much denser and larger trees.
Hierarchy ImageNet organizes the different classes of
images in a densely populated semantic hierarchy. The                               Accuracy We would like to offer a clean dataset at all
main asset of WordNet [9] lies in its semantic structure, i.e.                      levels of the WordNet hierarchy. Fig. 4 demonstrates the
its ontology of concepts. Similarly to WordNet, synsets of                          labeling precision on a total of 80 synsets randomly sam-
images in ImageNet are interlinked by several types of re-                          pled at different tree depths. An average of 99.7% preci-
lations, the “IS-A” relation being the most comprehensive                           sion is achieved on average. Achieving a high precision for
and useful. Although one can map any dataset with cate-                             all depths of the ImageNet tree is challenging because the
                                                                                    lower in the hierarchy a synset is, the harder it is to classify,
    1 About 20% of the synsets have very few images, because either there
                                                                                    e.g. Siamese cat versus Burmese cat.
are very few web images available, e.g. “vespertilian bat”, or the synset by
definition is difficult to be illustrated by images, e.g. “two-year-old horse”.
    2 It is claimed that the ESP game [25] has labeled a very large number          Diversity ImageNet is constructed with the goal that ob-
of images, but only a subset of 60K images are publicly available.                  jects in images should have variable appearances, positions,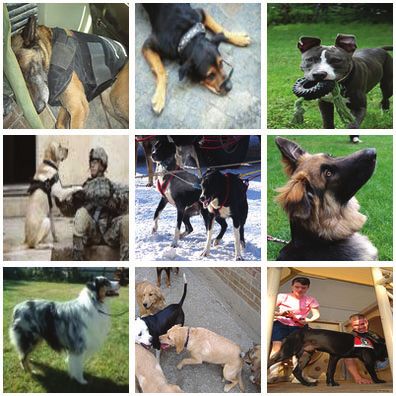
1                                                              datasets are needed for the next generation of algorithms.
 precision

                                                                              The current ImageNet offers 20× the number of categories,
             0.95
                                                                              and 100× the number of total images than these datasets.
              0.9
                    1      2       3     4    5     6   7    8     9          TinyImage TinyImage [24] is a dataset of 80 million
                                        tree depth                            32 × 32 low resolution images, collected from the Inter-
                                                                              net by sending all words in WordNet as queries to image
Figure 4: Percent of clean images at different tree depth levels in
                                                                              search engines. Each synset in the TinyImage dataset con-
ImageNet. A total of 80 synsets are randomly sampled at every
tree depth of the mammal and vehicle subtrees. An independent                 tains an average of 1000 images, among which 10-25% are
group of subjects verified the correctness of each of the images.             possibly clean images. Although the TinyImage dataset has
An average of 99.7% precision is achieved for each synset.                    had success with certain applications, the high level of noise
                                                                              and low resolution images make it less suitable for gen-
                        ImageNet       TinyImage   LabelMe   ESP   LHill      eral purpose algorithm development, training, and evalua-
   LabelDisam              Y               Y          N       N     Y         tion. Compared to the TinyImage dataset, ImageNet con-
   Clean                   Y               N          Y       Y     Y         tains high quality synsets (∼ 99% precision) and full reso-
   DenseHie                Y               Y          N       N     N         lution images with an average size of around 400 × 350.
   FullRes                 Y               N          Y       Y     Y
   PublicAvail             Y               Y          Y       N     N
   Segmented               N               N          Y       N     Y
                                                                              ESP dataset The ESP dataset is acquired through an on-
                                                                              line game [25]. Two players independently propose labels
Table 1: Comparison of some of the properties of ImageNet ver-                to one image with the goal of matching as many words as
sus other existing datasets. ImageNet offers disambiguated la-                possible in a certain time limit. Millions of images are la-
bels (LabelDisam), clean annotations (Clean), a dense hierarchy               beled through this game, but its speeded nature also poses a
(DenseHie), full resolution images (FullRes) and is publicly avail-
                                                                              major drawback. Rosch and Lloyd [20] have demonstrated
able (PublicAvail). ImageNet currently does not provide segmen-
tation annotations.
                                                                              that humans tend to label visual objects at an easily acces-
                                                                              sible semantic level termed as “basic level” (e.g. bird), as
                                                                              opposed to more specific level (“sub-ordinate level”, e.g.
view points, poses as well as background clutter and occlu-                   sparrow), or more general level (“super-ordinate level”, e.g.
sions. In an attempt to tackle the difficult problem of quan-                 vertebrate). Labels collected from the ESP game largely
tifying image diversity, we compute the average image of                      concentrate at the “basic level” of the semantic hierarchy
each synset and measure lossless JPG file size which reflects                 as illustrated by the color bars in Fig. 6. ImageNet, how-
the amount of information in an image. Our idea is that a                     ever, demonstrates a much more balanced distribution of
synset containing diverse images will result in a blurrier av-                images across the semantic hierarchy. Another critical dif-
erage image, the extreme being a gray image, whereas a                        ference between ESP and ImageNet is sense disambigua-
synset with little diversity will result in a more structured,                tion. When human players input the word “bank”, it is un-
sharper average image. We therefore expect to see a smaller                   clear whether it means “a river bank” or a “financial insti-
JPG file size of the average image of a more diverse synset.                  tution”. At this large scale, disambiguation becomes a non-
Fig. 5 compares the image diversity in four randomly sam-                     trivial task. Without it, the accuracy and usefulness of the
pled synsets in Caltech101 [8] 3 and the mammal subtree of                    ESP data could be affected. ImageNet, on the other hand,
ImageNet.                                                                     does not have this problem by construction. See section 3.2
                                                                              for more details. Lastly, most of the ESP dataset is not pub-
2.1. ImageNet and Related Datasets                                            licly available. Only 60K images and their labels can be
   We compare ImageNet with other datasets and summa-                         accessed [1].
rize the differences in Table 1 4 .
                                                                              LabelMe and Lotus Hill datasets LabelMe [21] and the
Small image datasets A number of well labeled small                           Lotus Hill dataset [27] provide 30k and 50k labeled and seg-
datasets (Caltech101/256 [8, 12], MSRC [22], PASCAL [7]                       mented images, respectively 5 . These two datasets provide
etc.) have served as training and evaluation benchmarks                       complementary resources for the vision community com-
for most of today’s computer vision algorithms. As com-                       pared to ImageNet. Both only have around 200 categories,
puter vision research advances, larger and more challenging                   but the outlines and locations of objects are provided. Im-
    3 We also compare with Caltech256 [12]. The result indicates the diver-   ageNet in its current form does not provide detailed object
sity of ImageNet is comparable, which is reassuring since Caltech256 was      outlines (see potential extensions in Sec. 5.1), but the num-
specifically designed to be more diverse.                                     ber of categories and the number of images per category
    4 We focus our comparisons on datasets of generic objects. Special pur-

pose datasets, such as FERET faces [19], Labeled faces in the Wild [13]          5 All statistics are from [21, 27]. In addition to the 50k images, the

and the Mammal Benchmark by Fink and Ullman [11] are not included.            Lotus Hill dataset also includes 587k video frames.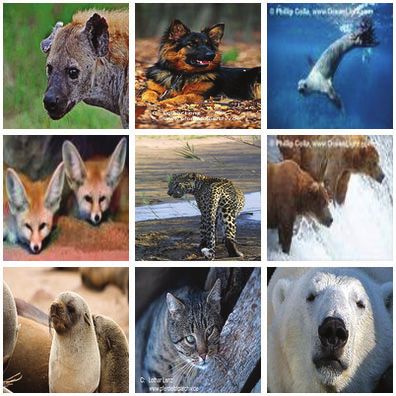
Lossless JPG size in byte

platypus

     panda

        okapi

elephant                           ImageNet
                                   Caltech101
             900        1000         1100
                         (a)                                               (b)                                     (c)
Figure 5: ImageNet provides diversified images. (a) Comparison of the lossless JPG file sizes of average images for four different synsets
in ImageNet ( the mammal subtree ) and Caltech101. Average images are downsampled to 32 × 32 and sizes are measured in byte. A more
diverse set of images results in a smaller lossless JPG file size. (b) Example images from ImageNet and average images for each synset
indicated by (a). (c) Examples images from Caltech101 and average images. For each category shown, the average image is computed
using all images from Caltech101 and an equal number of randomly sampled images from ImageNet.

             0.5                                                                     accuracy of image search results from the Internet is around
                                                        10028       Imagenet         10% [24]. ImageNet aims to eventually offer 500-1000
             0.4                                                        ESP
                                                                                     clean images per synset. We therefore collect a large set
percentage

             0.3                                                197850               of candidate images. After intra-synset duplicate removal,
                                                                                     each synset has over 10K images on average.
             0.2
                                                                                        We collect candidate images from the Internet by query-
             0.1                                                                     ing several image search engines. For each synset, the
                0                                                                    queries are the set of WordNet synonyms. Search engines
                               1        2       3   4    5      6     7    8     9   typically limit the number of images retrievable (in the or-
                                                        depth                        der of a few hundred to a thousand). To obtain as many im-
Figure 6: Comparison of the distribution of “mammal” labels                          ages as possible, we expand the query set by appending the
over tree depth levels between ImageNet and ESP game. The y-                         queries with the word from parent synsets, if the same word
axis indicates the percentage of the labels of the corresponding                     appears in the gloss of the target synset. For example, when
dataset. ImageNet demonstrates a much more balanced distribu-                        querying “whippet”, according to WordNet’s gloss a “small
tion, offering substantially more labels at deeper tree depth levels.                slender dog of greyhound type developed in England”, we
The actual number of images corresponding to the highest bar is                      also use “whippet dog” and “whippet greyhound”.
also given for each dataset.                                                            To further enlarge and diversify the candidate pool, we
                                                                                     translate the queries into other languages [10], including
                                                                                     Chinese, Spanish, Dutch and Italian. We obtain accurate
already far exceeds these two datasets. In addition, images
                                                                                     translations by WordNets in those languages [3, 2, 4, 26].
in these two datasets are largely uploaded or provided by
users or researchers of the dataset, whereas ImageNet con-
tains images crawled from the entire Internet. The Lotus                             3.2. Cleaning Candidate Images
Hill dataset is only available through purchase.                                        To collect a highly accurate dataset, we rely on humans
                                                                                     to verify each candidate image collected in the previous step
3. Constructing ImageNet                                                             for a given synset. This is achieved by using the service of
                                                                                     Amazon Mechanical Turk (AMT), an online platform on
    ImageNet is an ambitious project. Thus far, we have                              which one can put up tasks for users to complete and to
constructed 12 subtrees containing 3.2 million images. Our                           get paid. AMT has been used for labeling vision data [23].
goal is to complete the construction of around 50 million                            With a global user base, AMT is particularly suitable for
images in the next two years. We describe here the method                            large scale labeling.
we use to construct ImageNet, shedding light on how prop-
                                                                                        In each of our labeling tasks, we present the users with
erties of Sec. 2 can be ensured in this process.
                                                                                     a set of candidate images and the definition of the target
                                                                                     synset (including a link to Wikipedia). We then ask the
3.1. Collecting Candidate Images
                                                                                     users to verify whether each image contains objects of the
   The first stage of the construction of ImageNet involves                          synset. We encourage users to select images regardless of
collecting candidate images for each synset. The average                             occlusions, number of objects and clutter in the scene to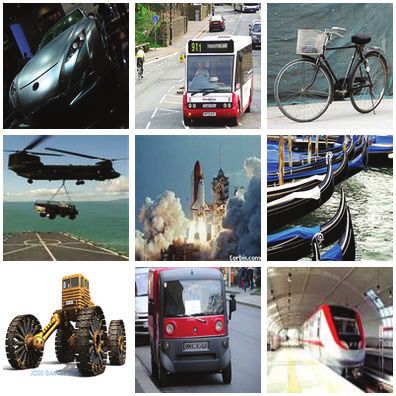
#Y    #N   Conf   Conf          4. ImageNet Applications
                                                        Cat    BCat
                                             0     1    0.07   0.23             In this section, we show three applications of ImageNet.
 User 1      Y         Y         Y
                                             1     0    0.85   0.69          The first set of experiments underline the advantages of hav-
 User 2      N         Y         Y           1     1    0.46   0.49          ing clean, full resolution images. The second experiment
 User 3      N         Y         Y           2     0    0.97   0.83
 User 4      Y         N         Y
                                                                             exploits the tree structure of ImageNet, whereas the last ex-
                                             0     2    0.02   0.12
 User 5      Y         Y         Y           3     0    0.99   0.90
                                                                             periment outlines a possible extension and gives more in-
 User 6      N         N         Y           2     1    0.85   0.68          sights into the data.

Figure 7: Left: Is there a Burmese cat in the images? Six ran-               4.1. Non-parametric Object Recognition
domly sampled users have different answers. Right: The confi-                    Given an image containing an unknown object, we
dence score table for “Cat” and “Burmese cat”. More votes are
                                                                             would like to recognize its object class by querying similar
needed to reach the same degree of confidence for “Burmese cat”
images.
                                                                             images in ImageNet. Torralba et al. [24] has demonstrated
                                                                             that, given a large number of images, simple nearest neigh-
                                                                             bor methods can achieve reasonable performances despite a
ensure diversity.                                                            high level of noise. We show that with a clean set of full
                                                                             resolution images, object recognition can be more accurate,
   While users are instructed to make accurate judgment,
                                                                             especially by exploiting more feature level information.
we need to set up a quality control system to ensure this
accuracy. There are two issues to consider. First, human                         We run four different object recognition experiments. In
users make mistakes and not all users follow the instruc-                    all experiments, we test on images from the 16 common
tions. Second, users do not always agree with each other,                    categories 7 between Caltech256 and the mammal subtree.
especially for more subtle or confusing synsets, typically at                We measure classification performance on each category in
the deeper levels of the tree. Fig. 7(left) shows an example                 the form of an ROC curve. For each category, the negative
of how users’ judgments differ for “Burmese cat”.                            set consists of all images from the other 15 categories. We
                                                                             now describe in detail our experiments and results(Fig. 8).
   The solution to these issues is to have multiple users in-
dependently label the same image. An image is considered                       1. NN-voting + noisy ImageNet First we replicate one
positive only if it gets a convincing majority of the votes.                      of the experiments described in [24], which we refer
We observe, however, that different categories require dif-                       to as “NN-voting” hereafter. To imitate the TinyIm-
ferent levels of consensus among users. For example, while                        age dataset (i.e. images collected from search engines
five users might be necessary for obtaining a good consen-                        without human cleaning), we use the original candi-
sus on “Burmese cat” images, a much smaller number is                             date images for each synset (Section 3.1) and down-
needed for “cat” images. We develop a simple algorithm to                         sample them to 32 × 32. Given a query image, we re-
dynamically determine the number of agreements needed                             trieve 100 of the nearest neighbor images by SSD pixel
for different categories of images. For each synset, we first                     distance from the mammal subtree. Then we perform
randomly sample an initial subset of images. At least 10                          classification by aggregating votes (number of nearest
users are asked to vote on each of these images. We then ob-                      neighbors) inside the tree of the target category.
tain a confidence score table, indicating the probability of an                2. NN-voting + clean ImageNet Next we run the same
image being a good image given the user votes (Fig. 7(right)                      NN-voting experiment described above on the clean
shows examples for “Burmese cat” and “cat”). For each of                          ImageNet dataset. This result shows that having more
remaining candidate images in this synset, we proceed with                        accurate data improves classification performance.
the AMT user labeling until a pre-determined confidence
score threshold is reached. It is worth noting that the con-                   3. NBNN We also implement the Naive Bayesian
fidence table gives a natural measure of the “semantic diffi-                     Nearest Neighbor (NBNN) method proposed in [5]
culty” of the synset. For some synsets, users fail to reach a                     to underline the usefulness of full resolution im-
majority vote for any image, indicating that the synset can-                      ages. NBNN employs a bag-of-features representa-
not be easily illustrated by images 6 . Fig. 4 shows that our                     tion of images. SIFT [15] descriptors are used in
algorithm successfully filters the candidate images, result-                      this experiment. Given a query image Q with de-
ing in a high percentage of clean images per synset.                              scriptors {di }, i = 1, . . . , M , for each object class
                                                                                  C, we compute the query-class distance DC =
                                                                                7 The  categories are bat, bear, camel, chimp, dog, elk, giraffe, goat,
   6 An  alternative explanation is that we did not obtain enough suitable   gorilla, greyhound, horse, killer-whale, porcupine, raccoon, skunk, zebra.
candidate images. Given the extensiveness of our crawling scheme, this is    Duplicates (∼ 20 per category ) with ImageNet are removed from the test
a rare scenario.                                                             set.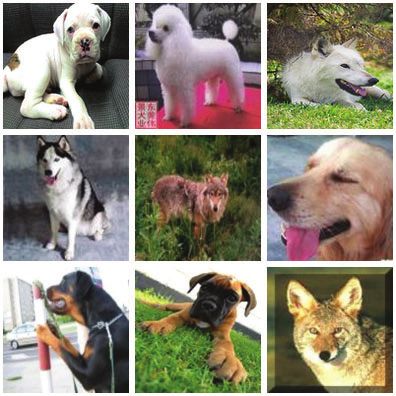
1 1
independent classifier
tree−max classifier
0.8 0.9
true positive rate
average AUC
0.8
0.6
0.7
0.4
0.6
NBNN
0.2
NBNN−100
NN−voting + clean ImageNet 0.5
NN−voting + noisy ImageNet 1 2 3 4 5 6 7 8 9
0 tree height
0 0.2 0.4 0.6 0.8 1
false positive rate
Figure 9: Average AUC at each tree height level. Performance
(a) average ROC comparison at different tree height levels between independently
trained classifiers and tree-max classifiers. The tree height of a
1 1
node is defined as the length of the longest path to its leaf nodes.
All leaf nodes’ height is 1.
true positive rate
true positive rate
0.8 0.8
0.6 0.6
0.4 0.4
0.2
NBNN
NBNN−100
0.2
NBNN
NBNN−100
method which we call the “tree-max classifier”. Imagine
NN−voting + clean ImageNet
0
NN−voting + clean ImageNet
NN−voting + noisy ImageNet
0
NN−voting + noisy ImageNet you have a classifier at each synset node of the tree and you
0 0.2 0.4 0.6 0.8 1 0 0.2 0.4 0.6 0.8 1
false positive rate false positive rate want to decide whether an image contains an object of that
(b) elk (c) killer-whale synset or not. The idea is to not only consider the classi-
fication score at a node such as “dog”, but also of its child
Figure 8: (a) Object recognition experiment results plotted in synsets, such as “German shepherd”, “English terrier”, etc.
ROC curves. Each curve is the result of one of the four experi- The maximum of all the classifier responses in this subtree
ments described in Section 4.1. It is an average of all ROC results becomes the classification score of the query image.
of 16 object categories commonly shared between Caltech256 and
the mammal subtree. Caltech256 images serve as testing images. Fig. 9 illustrates the result of our experiment on the
(b)(c) The ROC curve for “elk” and “killer-whale”. mammal subtree. Note that our algorithm is agnostic to any
method used to learn image classifiers for each synset. In
PM this case, we use an AdaBoost-based classifier proposed by
i=1 kdi − dC 2 C
i k , where di is the nearest neighbor of [6]. For each synset, we randomly sample 90% of the im-
di from all the image descriptors in class C. We order ages to form the positive training image set, leaving the rest
all classes by DC and define the classification score of the 10% as testing images. We form a common neg-
as the minimum rank of the target class and its sub- ative image set by aggregating 10 images randomly sam-
classes. The result shows that NBNN gives substan- pled from each synset. When training an image classifier
tially better performance, demonstrating the advantage for a particular synset, we use the positive set from this
of using a more sophisticated feature representation synset as well as the common negative image set excluding
available through full resolution images. the images drawn from this synset, and its child and parent
4. NBNN-100 Finally, we run the same NBNN experi- synsets.
ment, but limit the number of images per category to We evaluate the classification results by AUC (the area
100. The result confirms the findings of [24]. Per- under ROC curve). Fig. 9 shows the results of AUC for
formance can be significantly improved by enlarging synsets at different levels of the hierarchy, compared with
the dataset. It is worth noting that NBNN-100 out- an independent classifier that does not exploit the tree struc-
performs NN-voting with access to the entire dataset, ture of ImageNet. The plot indicates that images are easier
again demonstrating the benefit of having detailed fea- to classify at the bottom of the tree (e.g. star-nosed mole,
ture level information by using full resolution images. minivan, polar bear) as opposed to the top of the tree (e.g.
vehicles, mammal, artifact, etc.). This is most likely due to
4.2. Tree Based Image Classification stronger visual coherence near the leaf nodes of the tree.
Compared to other available datasets, ImageNet provides At nearly all levels, the performance of the tree-max
image data in a densely populated hierarchical structure. classifier is consistently higher than the independent clas-
Many possible algorithms could be applied to exploit a hi- sifier. This result shows that a simple way of exploiting
erarchical data structure (e.g. [16, 17, 28, 18]). the ImageNet hierarchy can already provide substantial im-
In this experiment, we choose to illustrate the usefulness provement for the image classification task without addi-
of the ImageNet hierarchy by a simple object classification tional training or model learning.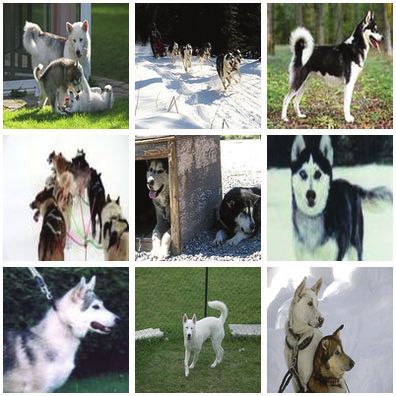
P recis ion
1      R ecall
0.8
0.6
0.4
0.2
0
      Te            hu      Min tig    Go     L         w        he        ta     je t   ba     p        mo    g      b     tu   y     tr      A     p   s    c          d    s
           xa         m            e     lde y nx          olf      lic
                                                                        op k
                                                                              n             by a c e       pe re y h ov in s ke a c h ic y c rma upp te a lt a me obb pa c
                s lo a n iv a n r           n                                                 ca      ca     d      ou    e    r     t      le   dil   y    ha         l   in   es
                    ng                        Re                          te                     rria r               nd                            lo         irc                 hu
                       ho                        trie                        r                                                                                     ra                ttle
                         rn                                                                          ge                                                               ft
                                                      ve
                                                         r

Figure 10: Precision and recall of 22 categories from different
levels of the hierarchy. Precision is calculated by dividing the area
of correctly segmented pixels by the area of detected pixels. Recall
is the fraction of relevant pixel area that is successfully detected.

4.3. Automatic Object Localization
    ImageNet can be extended to provide additional infor-
                                                                                                                                                                                            Figure 11: Samples of detected bounding boxes around different
mation about each image. One such information is the spa-
                                                                                                                                                                                            objects.
tial extent of the objects in each image. Two application
areas come to mind. First, for training a robust object de-
tection algorithm one often needs localized objects in dif-
ferent poses and under different viewpoints. Second, hav-
ing localized objects in cluttered scenes enables users to use
ImageNet as a benchmark dataset for object localization al-
gorithms. In this section we present results of localization
on 22 categories from different depths of the WordNet hier-
archy. The results also throw light on the diversity of images
in each of these categories.
    We use the non-parametric graphical model described in
[14] to learn the visual representation of objects against a
global background class. In this model, every input im-
age is represented as a “bag of words”. The output is
a probability for each image patch to belong to the top-
ics zi of a given category (see [14] for details). In or-
der to annotate images with a bounding box we calcu-
late the likelihood
            P        of each image patch given a category c:
p(x|c) = i p(x|zi , c)p(zi |c). Finally, one bounding box
is put around the region which accumulates the highest like-                                                                                                                                Figure 12: Left: Average images and image samples of the de-
lihood.                                                                                                                                                                                     tected bounding boxes from the ‘tusker’ and ‘stealth aircraft’ cate-
    We annotated 100 images in 22 different categories of                                                                                                                                   gories. Right: Average images and examples of three big clusters
the mammal and vehicle subtrees with bounding boxes                                                                                                                                         after k-means clustering (see Sec. 4.3 for detail). Different view-
around the objects of that category. Fig. 10 shows precision                                                                                                                                points and poses emerge in the “tusker” category. The first row
                                                                                                                                                                                            shows tuskers in side view, front view and in profile. One cluster
and recall values. Note that precision is low due to extreme
                                                                                                                                                                                            of aircraft images displays mostly planes on the ground.
variability of the objects and because of small objects which
have hardly any salient regions.
                                                                                                                                                                                            5. Discussion and Future Work
    Fig. 11 shows sampled bounding boxes on different
classes. The colored region is the detected bounding box,                                                                                                                                      Our future work has two goals:
while the original image is in light gray.
    In order to illustrate the diversity of ImageNet inside                                                                                                                                 5.1. Completing ImageNet
each category, Fig. 12 shows results on running k-means                                                                                                                                         The current ImageNet constitutes ∼ 10% of the Word-
clustering on the detected bounding boxes after converting                                                                                                                                  Net synsets. To further speed up the construction process,
them to grayscale and rescaling them to 32×32. All average                                                                                                                                  we will continue to explore more effective methods to eval-
images, including those for the entire cluster, are created                                                                                                                                 uate the AMT user labels and optimize the number of repe-
with approximately 40 images. While it is hard to iden-                                                                                                                                     titions needed to accurately verify each image. At the com-
tify the object in the average image of all bounding boxes                                                                                                                                  pletion of ImageNet, we aim to (i) have roughly 50 million
(shown in the center) due to the diversity of ImageNet, the                                                                                                                                 clean, diverse and full resolution images spread over ap-
average images of the single clusters consistently discover                                                                                                                                 proximately 50K synsets; (ii) deliver ImageNet to research
viewpoints or common poses.                                                                                                                                                                 communities by making it publicly available and readily ac-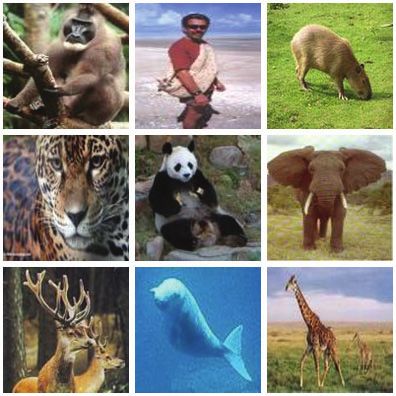
cessible online. We plan to use cloud storage to enable effi-      References
cient distribution of ImageNet data; (iii) extend ImageNet to       [1]   http://www.hunch.net/˜jl/.
include more information such as localization as described          [2]   The Chinese WordNet. http://bow.sinica.edu.tw.
in Sec. 4.3, segmentation, cross-synset referencing of im-          [3]   The Spanish WordNet. http://www.lsi.upc.edu/˜nlp.
ages, as well as expert annotation for difficult synsets and        [4]   A. Artale, B. Magnini, and S. C. Wordnet for italian and its use for
                                                                          lexical discrimination. In AI*IA97, pages 16–19, 1997.
(iv) foster an ImageNet community and develop an online             [5]   O. Boiman, E. Shechtman, and M. Irani. In defense of nearest-
platform where everyone can contribute to and benefit from                neighbor based image classification. In CVPR08, pages 1–8, 2008.
ImageNet resources.                                                 [6]   B. Collins, J. Deng, K. Li, and L. Fei-Fei. Towards scalable dataset
                                                                          construction: An active learning approach. In ECCV08, pages I: 86–
5.2. Exploiting ImageNet                                                  98, 2008.
                                                                    [7]   M. Everingham, L. Van Gool, C. K. I. Williams, J. Winn, and
    We hope ImageNet will become a central resource for a                 A. Zisserman. The PASCAL Visual Object Classes Challenge 2008
broad of range of vision related research. For the computer               (VOC2008) Results. http://www.pascal-network.org/
                                                                          challenges/VOC/voc2008/workshop/.
vision community in particular, we envision the following           [8]   L. Fei-Fei, R. Fergus, and P. Perona. One-shot learning of object
possible applications.                                                    categories. PAMI, 28(4):594–611, April 2006.
    A training resource. Most of today’s object recognition         [9]   C. Fellbaum. WordNet: An Electronic Lexical Database. Bradford
                                                                          Books, 1998.
algorithms have focused on a small number of common ob-            [10]   R. Fergus, L. Fei-Fei, P. Perona, and A. Zisserman. Learning object
jects, such as pedestrians, cars and faces. This is mainly due            categories from google’s image search. In ICCV05, pages II: 1816–
to the high availability of images for these categories. Fig. 6           1823, 2005.
has shown that even the largest datasets today have a strong       [11]   M. Fink and S. Ullman. From aardvark to zorro: A benchmark for
                                                                          mammal image classification. IJCV, 77(1-3):143–156, May 2008.
bias in their coverage of different types of objects. Ima-         [12]   G. Griffin, A. Holub, and P. Perona. Caltech-256 object category
geNet, on the other hand, contains a large number of images               dataset. Technical Report 7694, Caltech, 2007.
for nearly all object classes including rare ones. One inter-      [13]   G. Huang, M. Ramesh, T. Berg, and E. Learned Miller. Labeled
                                                                          faces in the wild: A database for studying face recognition in uncon-
esting research direction could be to transfer knowledge of
                                                                          strained environments. Technical Report 07-49, UMass, 2007.
common objects to learn rare object models.                        [14]   L.-J. Li, G. Wang, and L. Fei-Fei. OPTIMOL: automatic Online
    A benchmark dataset. The current benchmark datasets                   Picture collecTion via Incremental MOdel Learning. In CVPR07,
in computer vision such as Caltech101/256 and PASCAL                      pages 1–8, 2007.
                                                                   [15]   D. Lowe. Distinctive image features from scale-invariant keypoints.
have played a critical role in advancing object recognition               IJCV, 60(2):91–110, November 2004.
and scene classification research. We believe that the high        [16]   M. Marszalek and C. Schmid. Semantic hierarchies for visual object
quality, diversity and large scale of ImageNet will enable                recognition. In CVPR07, pages 1–7, 2007.
it to become a new and challenging benchmark dataset for           [17]   M. Marszalek and C. Schmid. Constructing category hierarchies for
                                                                          visual recognition. In ECCV08, pages IV: 479–491, 2008.
future research.                                                   [18]   D. Nister and H. Stewenius. Scalable recognition with a vocabulary
    Introducing new semantic relations for visual modeling.               tree. In CVPR06, pages II: 2161–2168, 2006.
Because ImageNet is uniquely linked to all concrete nouns          [19]   P. Phillips, H. Wechsler, J. Huang, and P. Rauss. The feret database
                                                                          and evaluation procedure for face-recognition algorithms. IVC,
of WordNet whose synsets are richly interconnected, one                   16(5):295–306, April 1998.
could also exploit different semantic relations for instance       [20]   E. Rosch and B. Lloyd. Principles of categorization. In Cognition
to learn part models. To move towards total scene under-                  and categorization, pages 27–48, 1978.
standing, it is also helpful to consider different depths of       [21]   B. Russell, A. Torralba, K. Murphy, and W. Freeman. Labelme:
                                                                          A database and web-based tool for image annotation. IJCV, 77(1-
the semantic hierarchy.                                                   3):157–173, May 2008.
    Human vision research. ImageNet’s rich structure and           [22]   J. Shotton, J. Winn, C. Rother, and A. Criminisi. Textonboost: Joint
dense coverage of the image world may help advance the                    appearance, shape and context modeling for multi-class object recog-
                                                                          nition and segmentation. In ECCV06, pages I: 1–15, 2006.
understanding of the human visual system. For example,             [23]   A. Sorokin and D. Forsyth. Utility data annotation with amazon me-
the question of whether a concept can be illustrated by im-               chanical turk. In InterNet08, pages 1–8, 2008.
ages is much more complex than one would expect at first.          [24]   A. Torralba, R. Fergus, and W. Freeman. 80 million tiny images: A
Aligning the cognitive hierarchy with the “visual” hierarchy              large data set for nonparametric object and scene recognition. PAMI,
                                                                          30(11):1958–1970, November 2008.
also remains an unexplored area.                                   [25]   L. von Ahn and L. Dabbish. Labeling images with a computer game.
                                                                          In CHI04, pages 319–326, 2004.
Acknowledgment                                                     [26]   P. Vossen, K. Hofmann, M. de Rijke, E. Tjong Kim Sang, and K. De-
                                                                          schacht. The Cornetto database: Architecture and user-scenarios. In
   The authors would like to thank Bangpeng Yao, Hao Su, Barry            Proceedings DIR 2007, pages 89–96, 2007.
Chai and anonymous reviewers for their helpful comments. WD is     [27]   B. Yao, X. Yang, and S. Zhu. Introduction to a large-scale general
supported by Gordon Wu fellowship. RS is supported by the ERP             purpose ground truth database: Methodology, annotation tool and
and Upton fellowships. KL is funded by NSF grant CNS-0509447              benchmarks. In EMMCVPR07, pages 169–183, 2007.
                                                                   [28]   A. Zweig and D. Weinshall. Exploiting object hierarchy: Combining
and by research grants from Google, Intel, Microsoft and Yahoo!.          models from different category levels. In ICCV07, pages 1–8, 2007.
LFF is funded by research grants from Microsoft and Google.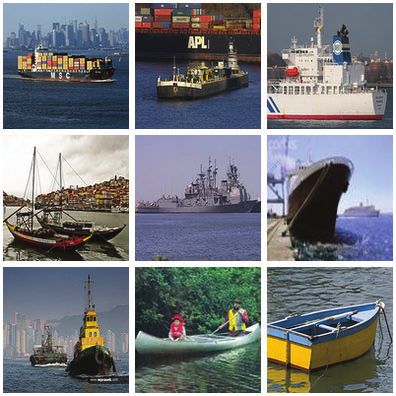
You can also read