Impact of Adding Polysaccharides on the Stability of Egg Yolk/Fish Oil Emulsions under Accelerated Shelf-Life Conditions - MDPI
←
→
Page content transcription
If your browser does not render page correctly, please read the page content below

molecules
Article
Impact of Adding Polysaccharides on the Stability of
Egg Yolk/Fish Oil Emulsions under Accelerated
Shelf-Life Conditions
Selene Yadira Gonzalez Toledo † and Jianping Wu *

                                          4-10 Ag/For Centre, Department of Agricultural, Food and Nutritional Science,
                                          University of Alberta, Edmonton, AB T6G 2P5, Canada; selene.yg@gmail.com
                                          * Correspondence: jwu3@ualberta.ca
                                          † Current Address: Nestlé Development Centre (NDC), Rue d’Orival, 14100 Lisieux, France.

                                          Abstract: Polysaccharides can form interfacial complexes with proteins to form emulsions with
                                          enhanced stability. We assessed the effect of adding gum guar or gum arabic to egg yolk/fish oil
                                          emulsions. The emulsions were produced using simple or high-pressure homogenization, stored
                                          for up to 10 days at 45 ◦ C, and characterized for their particle size and distribution, viscosity,
                                          encapsulation efficiency, oxidative stability, and cytotoxicity. Emulsions containing gum guar and/or
                                          triglycerides had the highest viscosity. There was no significant difference in the encapsulation
                                          efficiency of emulsions regardless of the polysaccharide used. However, emulsions containing
                                          gum arabic displayed a bridging flocculation effect, resulting in less stability over time compared
                                to those using gum guar. Emulsions produced using high-pressure homogenization displayed a

                                          narrower size distribution and higher stability. The formation of peroxides and propanal was lower
Citation: Gonzalez Toledo, S.Y.;
                                          in emulsions containing gum guar and was attributed to the surface oil. No significant toxicity
Wu, J. Impact of Adding
                                          toward Caco-2 cells was found from the emulsions over time. On the other hand, after 10 days of
Polysaccharides on the Stability of
                                          storage, nonencapsulated fish oil reduced the cell viability to about 80%. The results showed that
Egg Yolk/Fish Oil Emulsions under
                                          gum guar can increase the particle stability of egg yolk/fish oil emulsions and decrease the oxidation
Accelerated Shelf-Life Conditions.
Molecules 2021, 26, 4020. https://
                                          rate of omega-3 fatty acids.
doi.org/10.3390/molecules26134020
                                          Keywords: egg yolk; gum guar; gum arabic; high-pressure homogenization; oxidation; EPA; DHA
Academic Editors:
Ryszard Amarowicz and
Adriano Costa de Camargo
                                          1. Introduction
Received: 30 May 2021                          Emulsions have great potential for use as the delivery systems of lipophilic bioactive
Accepted: 26 June 2021
                                          compounds, mainly for applications in food and pharmaceutical products. The effective-
Published: 30 June 2021
                                          ness of these delivery systems can be assessed by the degree of protection they offer to
                                          the encapsulated compounds, or core material, from environmental stresses, such as those
Publisher’s Note: MDPI stays neutral
                                          encountered during food processing and later in the gastrointestinal tract.
with regard to jurisdictional claims in
                                               A critical factor that will determine this effectiveness is the encapsulating material.
published maps and institutional affil-
                                          Emulsions are commonly prepared using synthetic or natural emulsifiers (biopolymers) that
iations.
                                          can form a single layer surrounding the core material [1–3]. However, producing double-
                                          layer emulsion systems has been gaining attraction due to their potentially enhanced
                                          stability when compared with conventional monolayer emulsions [4–8]. In these systems,
                                          the primary coating is usually achieved with proteins, whereas the secondary layer can
Copyright: © 2021 by the authors.         be formed using an oppositely charged polysaccharide [4,7]. The predominant stabilizing
Licensee MDPI, Basel, Switzerland.
                                          mechanism of polysaccharides is known to be steric, which, unlike proteins that generate
This article is an open access article
                                          electrostatic forces, forms emulsions with better stability under different environmental
distributed under the terms and
                                          stresses. Thus, the addition of polysaccharides to a protein monolayer emulsion leads to
conditions of the Creative Commons
                                          the formation of interfacial complexes that reduce the van der Waals attractions between
Attribution (CC BY) license (https://
                                          proteins and increase the steric and electrostatic repulsion between droplets, which could
creativecommons.org/licenses/by/
                                          result in increased physical stability of the emulsion [9].
4.0/).

Molecules 2021, 26, 4020. https://doi.org/10.3390/molecules26134020                                      https://www.mdpi.com/journal/molecules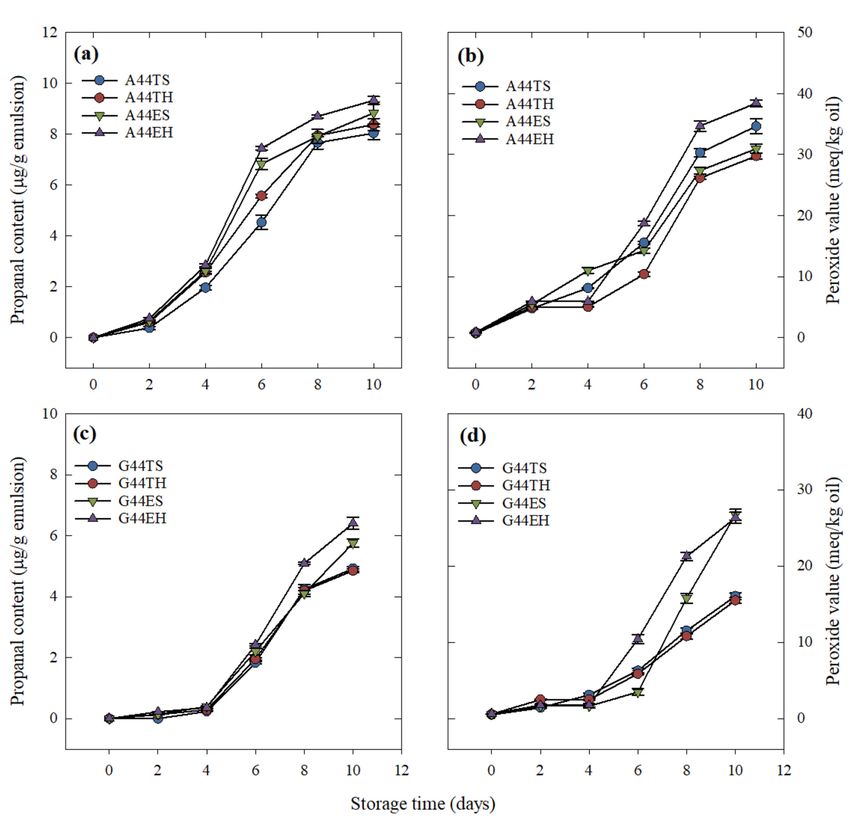
Molecules 2021, 26, 4020                                                                                           2 of 16

                                 Polysaccharides have been extensively used in the food industry not only as thicken-
                           ing and gelling agents but also for their emulsifying properties. For instance, gum arabic,
                           a polysaccharide derived from the exudate of the Acacia senegal tree, has been extensively
                           used as an emulsifier for food applications [5,10,11]. The emulsifying properties of gum
                           arabic are conferred by its amphiphilic nature: its hydrophobic side, the polypeptide
                           chain, anchors the molecules to the lipid phase, while the arabinogalactan fraction (hy-
                           drophilic side) extends into the aqueous phase. Alternatively, guar gum, a linear nonionic
                           polysaccharide, which consists of a chain of β(1–4)-linked mannopyranosyl units with an
                           α(1–6)-linked D-galactopyranosyl chain every second residue [12], is commonly used in
                           the food industry as a thickening and stabilizing agent. Resistance to pH changes, ionic
                           strength, and/or harsh temperatures, such as heating and freezing, non-toxicity, and easy
                           digestion, are among the potential advantages of adding polysaccharides as secondary
                           layers for food applications [6,13]. Those characteristics have practical significance for
                           encapsulation and preservation during processing and storage, as well as the targeted
                           delivery of highly sensitive or unstable bioactive compounds, such as polyunsaturated
                           fatty acids.
                                 Another important consideration during the production of emulsions is the process-
                           ing technology selected, which can vary from low to high energy, such as spontaneous
                           emulsification, high-shear mixing [4], high-pressure homogenization [14], microfluidiza-
                           tion [2,3], ultrasonication, and membrane and microchannel emulsification. High-pressure
                           homogenization has been widely used to form mono- and double-layer emulsions. The
                           high shear force generated during the homogenization process entails the rapid movement
                           of the encapsulating materials to the interfacial region and causes violent disruption of the
                           droplets, making most droplets in the nano-size range (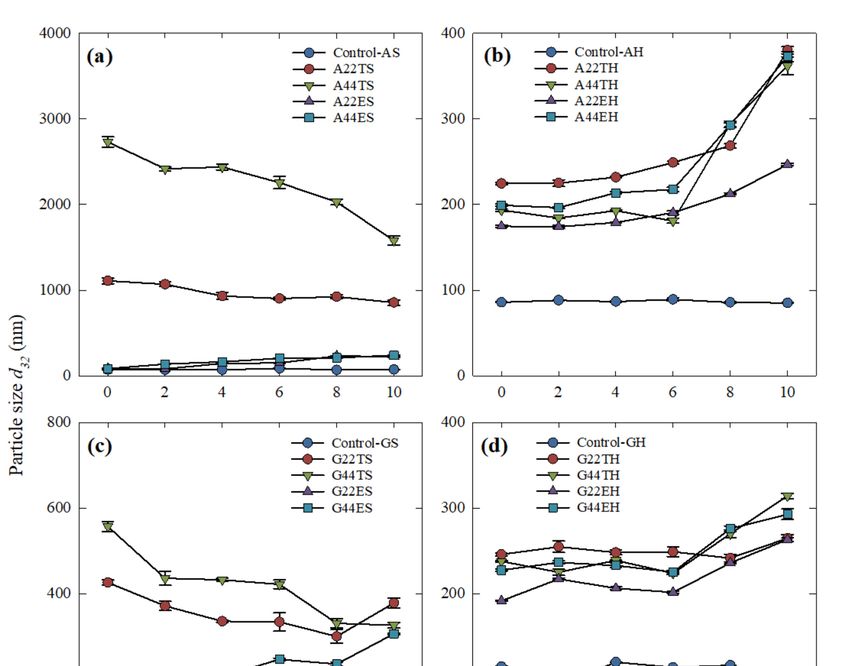
of samples containing 44% EPA + DHA is displayed in Figure 1a,b. Secondary homogeni-
zation had a highly significant influence (p < 0.001) on the apparent viscosity of all emul-
Molecules 2021, 26, 4020 sions, regardless of the esterification type. Nevertheless, the esterification type of3the
of 16fatty
acids in the fish oil had a significant influence (p < 0.05) on samples within the same pro-
cessing type. For instance, samples containing triglycerides had a higher viscosity than
those containing ethyl esters. Overall, emulsions where gum guar was used as the second-
than those containing ethyl esters. Overall, emulsions where gum guar was used as the
ary layer had higher viscosity (p < 0.05) than those using gum arabic.
secondary layer had higher viscosity (p < 0.05) than those using gum arabic.
Figure
Figure1.1.Effect
Effect of
of (a)
(a) primary (S)
(S) and
and(b)
(b)secondary
secondary(H)
(H) homogenization
homogenization on on
thethe apparent
apparent viscosity
viscosity of eggof yolk/fish
egg yolk/fishoil oil
triglyceride
triglyceride(T)
(T)or
orethyl
ethyl ester emulsionscontaining
ester (E) emulsions containinggum
gumarabic
arabic (A)
(A) oror
gumgum guar
guar (G).(G).
EachEach curve
curve is the
is the average
average of three
of three
replications.
replications.The
Theviscosity
viscosity of emulsions formedusing
emulsions formed usingsecondary
secondary homogenization
homogenization was
was significantly
significantly higherhigher
(p < (p < 0.001)
0.001) thanthan
those prepared under primary homogenization conditions. G44TH was significantly more viscous (p < 0.05)
those prepared under primary homogenization conditions. G44TH was significantly more viscous (p < 0.05) than all other than all other
treatments under the same processing conditions.
treatments under the same processing conditions.
2.3. Particle
2.3. Particle Size
Size and
andDistribution
DistributionasasAffected
Affectedbyby
Treatment andand
Treatment Time
Time
2.3.1. Effect of Treatment and Time on the Particle Size Distribution
2.3.1. Effect of Treatment and Time on the Particle Size Distribution
The effect of processing type on the particle size distribution of the emulsions contain-
The effect of processing type on the particle size distribution of the emulsions con-
ing 44% EPA + DHA triglycerides or ethyl esters is shown in Figure 2a,b. The distribution
taining
curves of44% EPA +using
samples DHAgum triglycerides
guar as theorsecondary
ethyl esters is were
layer shown in Figure
narrower 2a,b.
and The to
skewed distri-
bution curves
the smaller size of
endsamples
after theusing gumhomogenization.
secondary guar as the secondary
Moreover, layer were containing
emulsions narrower and
skewed to the smaller size end after the secondary homogenization. Moreover,
gum arabic and triglycerides processed using primary homogenization (A44TS) showed emulsions
containing gum arabic and triglycerides processed using primary
a second peak in the micro-size region that almost disappeared after secondary homog- homogenization
(A44TS)
enizationshowed
(A44TH). a second
On thepeakotherinhand,
the micro-size
A44ES (gum region that
arabic + almost disappeared
ethyl esters after sec-
after primary
ondary homogenization
homogenization) (A44TH).
did not show On the
an obvious otherpeak
second hand,
but A44ES (gum
the curve arabic
became more + ethyl
skewed esters
to the lower size end after the secondary homogenization.
after primary homogenization) did not show an obvious second peak but the curve be-
came more skewed to the lower size end after the secondary homogenization.
2.3.2. Effect of Treatment and Time on the Average Particle Size
The mean particle size of emulsions containing triglycerides was significantly larger
than those with ethyl esters at all levels evaluated. The most significant effect of time on
the average particle size was observed at day 10 and the treatments most affected by time
were those containing gum arabic.
lecules 2021, 26, x FOR PEER REVIEW 4 o
Molecules 2021, 26, 4020 4 of 16
ofEffect
Figure 2.
Figure 2. Effect of (a) primary
(a) primary (S) and
(S) and (b)(b) secondary (H)
secondary (H)homogenization
homogenization on theon
particle size distribution
the particle of egg yolk/fish
size distribution oil yolk/fish
of egg
triglycerides (T) or ethyl esters (E) emulsions containing gum arabic (A) or gum guar (G). Each curve is the
oil triglycerides (T) or ethyl esters (E) emulsions containing gum arabic (A) or gum guar (G). Each curve is the average of average of three
replications. All treatments showed a monomodal particle size distribution in the nano-size region after the high-pressure
three replications. All treatments showed a monomodal particle size distribution in the nano-size region after the high-
homogenization, with the exception of A44TH, which showed some residual in the micro-size region.
pressure homogenization, with the exception of A44TH, which showed some residual in the micro-size region.
The effects of the processing conditions and time on the particle size of emulsions are
2.3.2.shown
Effectinof Treatment
Figure and
3a,b when Time
gum arabicon the
was Average
used Particle
as a secondary Size
layer and Figure 3c,d when
gum guar was used. On day 0, the smallest average particle size corresponded to Control-
The mean particle size of emulsions containing triglycerides was significantly lar
AS (72.4 nm); however, this value was not significantly different from the other controls
than (-AH,
those-GS,
withandethyl
-GH).esters
On the at allhand,
other levels evaluated.larger
a significantly The particle
most significant effectinof time
size was obtained
the average
emulsions particle
carryingsize was observed
triglycerides. Samplesatsubjected
day 10 and the treatments
to secondary most affected
homogenization (high- by ti
pressure homogenization
were those containing gum arabic. at 200 MPa) showed a significantly smaller particle size (p < 0.01)
than their counterparts processed only through primary homogenization. In our study, the
The effects of the processing conditions and time on the particle size of emulsions
strongest effect of high-pressure homogenization was observed in samples containing gum
shown in Figure
arabic and 22 or3a,b
44% when gum after
triglycerides arabic was used
secondary as a secondary
homogenization (A22THlayer and Figure 3
and A44TH),
whenwhich
gumexhibited
guar was used.
about 5- andOn12-fold
day 0, the smallest
reductions in size average
comparedparticle size corresponded
to those formed using
Control-AS (72.4 nm); however,
primary homogenization, A22TS andthisA44TS,
valuerespectively.
was not significantly different
A significant effect from
of storage on the ot
the particle size of emulsions stabilized by gum guar was observed only
controls (-AH, -GS, and -GH). On the other hand, a significantly larger particle size w on day 10.
A significant effect (p < 0.05) of the EPA + DHA concentration on the particle size was
obtained in emulsions carrying triglycerides. Samples subjected to secondary homoge
also observed. At lower concentrations of the lipid phase, a smaller average particle size
zation (high-pressure
was recorded. homogenization at 200 MPa) showed a significantly smaller parti
size (p < 0.01) than their counterparts processed only through primary homogenizati
2.4. Influence of Treatment on the EPA + DHA Encapsulation Efficiency of Egg Yolk
In our study, the strongest effect of high-pressure homogenization was observed in sa
Table 1 shows the initial encapsulation efficiency and the total EPA + DHA that
ples containing gum arabic and 22 or 44% triglycerides after secondary homogenizat
remained encapsulated after 10 days of storage at 45 ◦ C for emulsions with the highest con-
(A22TH and A44TH),
centrations which
of EPA + DHA. Onexhibited about 5- and
day 0, the encapsulation 12-foldofreductions
efficiency in size compa
emulsions containing
to those
gum formed
guar and using
producedprimary homogenization,
using secondary homogenizationA22TS and
(G44TH andA44TS,
G44EH)respectively.
was signif- As
nificant effect
icantly of than
higher storage
thoseon theaparticle
using sizeofofgum
combination emulsions
arabic andstabilized by gum guar was
primary homogenization
(A44ES
served onlyandon A44TS).
day 10.
A significant effect (p < 0.05) of the EPA + DHA concentration on the particle size w
also observed. At lower concentrations of the lipid phase, a smaller average particle s
was recorded.
Molecules 2021, 26, x FOR PEER REVIEW 5 of 16
Molecules 2021, 26, 4020 5 of 16
Figure
Figure 3. 3. Average
Average particle
particle size
size ofof egg
egg yolk/fishoil
yolk/fish oiltriglycerides
triglycerides(T)
(T)ororethyl
ethylesters
esters(E)
(E)emulsions
emulsionscontaining
containinggum
gumarabic
arabic(A)
(A)
after
after (a)(a) primary
primary and
and (b)
(b) secondary
secondary homogenization,
homogenization, oror
gumgum guar(G)
guar (G)after
after(c)(c)primary
primaryand and(d)
(d)secondary
secondaryhomogenization.
homogenization.
Changes
Changes inin the
the particle
particle size
size areare shown
shown over
over 1010 days
days ofof storage
storage at at
4545 °C.
◦ C. TheThe graphs
graphs are
are organized
organized toto display
display differences
differences
between main plots (polysaccharide type, rows) and the influence of the split-plot (processing
between main plots (polysaccharide type, rows) and the influence of the split-plot (processing type, columns). Each type, columns). Each data
data
point corresponds to the mean ± standard error of three replications.
point corresponds to the mean ± standard error of three replications.
2.4.Differences
Influence of in
Treatment on the EPA
the efficiencies + DHA
between theEncapsulation Efficiencywere
two polysaccharides of Egg Yolk observed
clearly
after 10Table
days 1ofshows
storage when
the theencapsulation
initial analysis of variance showed
efficiency and athe
highly
totalsignificant
EPA + DHA influence
that re-
(pmained
< 0.001)encapsulated
of treatment,after
time,10and
daystheir interaction
of storage at 45on
°Cthe
forpercentage of encapsulated
emulsions with the highest oil,
con-
displaying a clear separation of the main plots. For instance, the four samples
centrations of EPA + DHA. On day 0, the encapsulation efficiency of emulsions containing prepared
with
gumgumguarguar
andshowed
producedsignificantly higher (p
using secondary < 0.05) encapsulation
homogenization (G44TH efficiencies
and G44EH) thanwas
those
sig-
ofnificantly
gum arabic. Furthermore,
higher than those the effecta of
using processing time
combination wasarabic
of gum significant only in emulsions
and primary homogeni-
using
zationgum arabic
(A44ES andasA44TS).
the secondary layer after 10 days of storage, with those emulsions
formed using secondary homogenization being the ones displaying the lowest release of
the core material.
Molecules 2021, 26, 4020                                                                                                      6 of 16

                               Table 1. Encapsulation efficiency of emulsions containing 44% EPA + DHA (w/w egg yolk dry matter
                               basis) and gum arabic (A) or gum guar (G) after primary (S) or secondary (H) homogenization and
                               the remaining encapsulated oil after 10 days of storage at 45 ◦ C. The percentages are given based
                               on the total EPA + DHA quantification. Every value corresponds to the mean ± standard error of
                               three replications. Different letters within columns mean significant differences between treatments.
                               The encapsulated oil efficiency was significantly lower for all treatments at day 10. Significance was
                               considered at p < 0.05.

                                   Treatment        Encapsulation Efficiency (%) at Day 0        Encapsulated Oil (%) at Day 10
                                     A44TS                        97.3 ± 0.4 b                             80.7 ± 0.7 d
                                     A44TH                        98.4 ± 0.2 ab                            89.7 ± 0.3 c
                                     A44ES                        97.0 ± 0.2 b                             91.0 ± 0.7 c
                                     A44EH                        98.4 ± 0.2 ab                            90.6 ± 0.5 c
                                     G44TS                        98.0 ± 0.2 ab                            94.7 ± 0.2 a
                                     G44TH                        99.5 ± 0.1 a                             94.6 ± 0.3 a
                                     G44ES                        97.4 ± 0.1 b                             94.6 ± 0.4 a
                                     G44EH                        99.4 ± 0.1 a                             92.8 ± 0.3 b

                                2.5. Formation of EPA + DHA Oxidation Products as an Indicator of the Emulsion Stability
                                        The propanal and peroxide formation in emulsions containing the highest concentra-
                                   tion of EPA + DHA during storage at 45 ◦ C is shown in Figure 4. The effect of the fixed
                                   factors on the oxidative stability of emulsions showed the same trend as their effect on
                                   encapsulated oil.
                                        Emulsions using gum guar (Figure 4d) had higher stability, as shown by the lack of
                                   significant peroxide formation from day 0 to day 4 of storage, whereas those emulsions
                                   using gum arabic (Figure 4b) showed significantly higher values on day 2 of storage.
                                   Overall, a clear difference was observed between the main plots, with lower peroxide
Molecules 2021, 26, x FOR PEER REVIEW
                                   values for treatments using gum guar throughout the storage time evaluated. On day  7 of 10,
                                                                                                                            16
                                   emulsions containing triglycerides, regardless of the processing type, showed significantly
                                   lower peroxide values than those containing ethyl esters.

                                                         Figure 4. Cont.
Molecules 2021, 26, 4020                                                                                                                      7 of 16

     Figure
Figure        4. Oxidative
         4. Oxidative       stability
                         stability     of the
                                   of the     emulsions
                                           emulsions      over
                                                        over 1010days
                                                                   daysofofstorage
                                                                            storageat at45
                                                                                        45 ◦°C.
                                                                                             C. The
                                                                                                The graphs
                                                                                                      graphs are
                                                                                                               areorganized
                                                                                                                   organizedtotodisplay
                                                                                                                                 displaydiffer-
                                                                                                                                          differences
between main plots (polysaccharide type, rows) and the influence of the split-plot (processing type, columns). (a) Propanal(a)content
     ences  between     main plots   (polysaccharide   type, rows)   and  the  influence   of the  split-plot (processing  type, columns).
     Propanal content of egg yolk/fish oil triglycerides (T) or ethyl esters (E) emulsions containing gum arabic (A) after primary
of egg yolk/fish oil triglycerides (T) or ethyl esters (E) emulsions containing gum arabic (A) after primary (S) or secondary (H)
     (S) or secondary (H) homogenization. (b) Peroxide value of egg yolk/fish oil triglycerides or ethyl esters emulsions con-
homogenization. (b) Peroxide value of egg yolk/fish oil triglycerides or ethyl esters emulsions containing gum arabic after primary or
     taining gum arabic after primary or secondary homogenization. (c) Propanal content of egg yolk/fish oil triglycerides or
secondary    homogenization.
     ethyl esters                (c) Propanal
                    emulsions containing        content
                                              gum  guar of egg
                                                         (G)    yolk/fish
                                                             after  primary oilor
                                                                                triglycerides   or ethyl esters emulsions
                                                                                   secondary homogenization.                containing
                                                                                                                    (d) Peroxide  value gum  guar (G)
                                                                                                                                        of egg
afteryolk/fish
      primary oilor secondary   homogenization.
                    triglycerides                   (d) Peroxide
                                   or ethyl esters emulsions      value of gum
                                                               containing    egg yolk/fish
                                                                                   guar afteroil triglycerides
                                                                                               primary          or ethylhomogenization.
                                                                                                         or secondary    esters emulsionsEach
                                                                                                                                          containing
gumdata
      guarpoint
            after corresponds
                  primary or secondary
                                 to the meanhomogenization.   Each
                                               ± standard error   of data
                                                                     threepoint   corresponds to the mean ± standard error of three replications.
                                                                            replications.

                                          A similar
                                   2.6. Toxicity of thepattern wasunder
                                                        Emulsions   observed  for propanal
                                                                        Accelerated Shelf-Lifeformation.   No
                                                                                               Conditions on    propanal
                                                                                                             Caco-2  Cells formation
                                    was detected on freshly prepared emulsions (day 0), whereas at the end of the storage
                                         The toxicity of fresh emulsions (day 0) and the negative controls were evaluated at
                                    time (day 10), the lowest (α = 0.05) propanal contents, with values of 4.85 and 4.92 µg/g
                                   different concentrations (Supplementary Material) to screen for potential dose-dependent
                                    emulsion, were obtained from emulsions containing gum guar and triglycerides, G44TH
                                   toxicity. No significant differences in cell viability were found within treatments at all
                                    and G44TS, respectively. The processing conditions did not show a significant effect on the
                                   levels evaluated.
                                    oxidative stability However,  a lower variation
                                                          of the emulsions          was observed
                                                                           over the evaluated       overall
                                                                                                storage      at a dose of 75 μg fish
                                                                                                         period.
                                   oil/mL medium; therefore, this concentration was used for the analyses over time.
                                    2.6. Toxicity of the Emulsions under Accelerated Shelf-Life Conditions on Caco-2 Cells
                                           The toxicity of fresh emulsions (day 0) and the negative controls were evaluated at
                                     different concentrations (Supplementary Material) to screen for potential dose-dependent
                                     toxicity. No significant differences in cell viability were found within treatments at all
                                     levels evaluated. However, a lower variation was observed overall at a dose of 75 µg fish
                                     oil/mL medium; therefore, this concentration was used for the analyses over time.
                                           The toxicity of the emulsions, the controls without fish oil, and nonencapsulated fish
                                     oil over 10 days of storage at 45 ◦ C is shown in Figure 5. A significant decrease in cell
                                     viability was observed only for the negative control, resulting in an average viability of
                                     69.52% for the nonencapsulated fish oil ethyl esters (FOE) (Figure 5c). This effect is clearly
                                     illustrated in the light microscopy images in Figure 6, showing the differences in the purple
                                     color intensity, which was related to the activity of mitochondrial dehydrogenases.
The toxicity of the emulsions, the controls without fish oil, and nonencapsulated fish
                                    oil over 10 days of storage at 45 °C is shown in Figure 5. A significant decrease in cell
                                    viability was observed only for the negative control, resulting in an average viability of
                                    69.52% for the nonencapsulated fish oil ethyl esters (FOE) (Figure 5c). This effect is clearly
Molecules 2021, 26, 4020            illustrated in the light microscopy images in Figure 6, showing the differences8in   the pur-
                                                                                                                      of 16
                                    ple color intensity, which was related to the activity of mitochondrial dehydrogenases.

              5. Toxicity                                                                                      ◦ C. (a) Relative viability of Caco-2
     Figure
 Figure  5. Toxicity     of of emulsionsand
                            emulsions      andnonencapsulated
                                                nonencapsulated fish     oiloil
                                                                      fish   over 10 days
                                                                                over         of storage
                                                                                       10 days           at 45 at
                                                                                                 of storage       45 °C. (a) Relative viability of Caco-
     cells
 2 cells   aftertreatment
         after    treatment with
                               withegg
                                     eggyolk/fish
                                          yolk/fishoiloil
                                                       triglycerides  (T) or(T)
                                                           triglycerides      ethyl  esters esters
                                                                                or ethyl    (E) emulsions    containing
                                                                                                    (E) emulsions          gum arabicgum
                                                                                                                        containing     (A) produced
                                                                                                                                            arabic (A) pro-
     by simple
 duced   by simple (S) or(S)
                          secondary    (H) homogenization.
                              or secondary                       (b) Relative
                                               (H) homogenization.           (b)viability
                                                                                 Relative  of viability
                                                                                              Caco-2 cellsof after
                                                                                                              Caco-2treatment    with treatment
                                                                                                                         cells after  egg yolk/fish with egg
 yolk/fish  oil triglycerides
     oil triglycerides     or ethyloresters
                                      ethylemulsions
                                             esters emulsions      containing
                                                          containing  gum guargum        guar (G) produced
                                                                                    (G) produced     by simple or bysecondary
                                                                                                                       simple orhomogenization.
                                                                                                                                    secondary homogeni-
 zation.  (c) Relative
     (c) Relative         viability
                    viability         of Caco-2
                               of Caco-2         cellstreatment
                                          cells after   after treatment      with nonencapsulated
                                                                  with nonencapsulated                     fish oil triglycerides
                                                                                              fish oil triglycerides   (FOT) or ethyl(FOT)
                                                                                                                                        estersor(FOE),
                                                                                                                                                  ethyl esters
 (FOE), and the control emulsions without fish oil (Control-AH, Control-GH) produced by secondary (H) homogenization.
     and   the control    emulsions    without  fish  oil (Control-AH,    Control-GH)      produced     by  secondary     (H)  homogenization.      All
 All samples
     samples wereweretested
                         testedatata aconcentration
                                        concentration      of 75
                                                       of 75  µg μg
                                                                  fishfish  oil/mL
                                                                       oil/mL         medium.
                                                                                 medium.       EachEach
                                                                                                     pointpoint    represents
                                                                                                             represents           the mean
                                                                                                                            the mean   of fouroftofour
                                                                                                                                                    six to six
 replications
     replications    ± standard
                 ± standard     error.
                                   error.
Molecules 2021, 26, 4020 9 of 16
Molecules 2021, 26, x FOR PEER REVIEW 9 of 16
Figure
Figure 6. Light
6. Light microscopyimages
microscopy imagesdisplaying
displaying the
the purple
purple formazan
formazan crystals
crystalsresulting
resultingfrom
fromthe mitochondrial
the activity
mitochondrial of of
activity
Caco-2 cells after 24 h incubation with (a) egg yolk/fish oil ethyl esters emulsions containing gum guar (G44EH)
Caco-2 cells after 24 h incubation with (a) egg yolk/fish oil ethyl esters emulsions containing gum guar (G44EH) or (b) or (b)
nonencapsulated fish oil ethyl esters (FOE) on day 8 of storage.
nonencapsulated fish oil ethyl esters (FOE) on day 8 of storage.
3. Discussion
3. Discussion
In this study, egg yolk was used as the primary emulsifier of fish oil triglycerides or
ethylInesters.
this study,
Gum egg guaryolk wasarabic
or gum used as wasthe primary
further emulsifier
added of fish oil
to the primary triglycerides
emulsion to act or
ethyl esters. Gum
as a secondary layer.guar or gum
Simple arabic was
or combined further added to the
simple/high-pressure primary emulsion
homogenization were the to act
astwo
a secondary
homogenizationlayer. Simple
processes or tested.
combined The simple/high-pressure
resulting emulsions were homogenization
developed to protect were the
two homogenization
highly sensitive lipophilicprocesses tested.
bioactive The resulting
compounds, emulsions
namely, EPA and were DHA,developed to protect
from environ-
highly
mentalsensitive
stresses.lipophilic bioactiveof
The effectiveness compounds,
the emulsions namely,
was EPA
givenandby DHA, from environmental
their stability and their
stresses.
ability toThe effectiveness
prevent of the emulsions
oxidation/degradation was given
of EPA and DHA by their
overstability
10 days and their ability
of storage at 45 to
prevent
°C. oxidation/degradation of EPA and DHA over 10 days of storage at 45 ◦ C.
ItItwas
was shown
shown that thatthe
therheological
rheological properties
properties of oil-in-water
of oil-in-water emulsions
emulsions are mostly
are mostly de-
dependent
pendent on the original properties of the biopolymers used as wall materials andand
on the original properties of the biopolymers used as wall materials their
their
effective
effectivevolume
volume occupied
occupied in in the
the emulsion
emulsionsystem system[3,4,17].
[3,4,17].For For instance,
instance, gum gum arabic
arabic is is
commonlyused
commonly used as as an emulsifier
emulsifier in inbeverage
beverageindustries
industries due
due toto
itsits
lowlowviscosity,
viscosity, whereas
whereas
gumguar
gum guarisiswidely
widely used in the the food
foodindustry
industryasasaathickening
thickeningagent.agent. GumGum guarguarbelongs
belongs to to
thegalactomannan
the galactomannan family, family, which is is known
knownfor forits
itshigh-water-binding
high-water-binding capacity
capacity that allows
that allows
themto
them toform
formviscous
viscous emulsions,
emulsions, even evenatatlow lowconcentrations.
concentrations. Consequently,
Consequently, thetheemulsions
emulsions
wheregum
where gumguarguarwas was used
used asas aa secondary
secondarylayer layerhadhadhigher
higherviscosity
viscosity (p (p
< 0.05)
< 0.05)thanthanthose
those
usinggum
using gumarabic.
arabic.
Theparticle
The particle sizes
sizes and
and distribution
distributionofofan anemulsion
emulsionisisananimportant
important characteristic
characteristic to to
evaluate since it is an indicator of the efficiency of the emulsification
evaluate since it is an indicator of the efficiency of the emulsification process and the sta- process and the sta-
bilityof
bility ofthe
theemulsions
emulsions [4,18,19].
[4,18,19]. The
Thenarrower
narrowerparticle
particledistribution
distribution observed
observed in gum
in gum guar guar
emulsions after secondary homogenization agreed with the observations of Bai et [2],
emulsions after secondary homogenization agreed with the observations of Bai et al. al. [2],
whoreported
who reportednarrower
narrower monomodal
monomodal particleparticledistributions
distributions atat
higher
higher homogenization
homogenization pres-
pres-
sures. On the other hand, the size distribution of emulsions containing
sures. On the other hand, the size distribution of emulsions containing gum arabic seemed gum arabic seemed
totodepend
depend not only on the processing type but also on the esterification of the fish oil used
not only on the processing type but also on the esterification of the fish oil used
as the core material.
as the core material.
The overall changes in the distribution curves were also reflected in the average par-
The overall changes in the distribution curves were also reflected in the average
ticle size of each treatment. In this case, the factor that caused the highest variability in the
particle size of each treatment. In this case, the factor that caused the highest variability
average particle size was the esterification type: triglycerides displayed a larger average
in the average particle size was the esterification type: triglycerides displayed a larger
size. In a previous study [14], we showed that during emulsification, the fish oil triglycer-
average size. In a previous study [14], we showed that during emulsification, the fish oil
ides have more affinity for the granule fraction of the egg yolk (micro-size region), thus
triglycerides have more affinity for the granule fraction of the egg yolk (micro-size region),
increasing its volume percentage, which results in a larger average particle size. On the
thus
otherincreasing its volume percentage,
hand, a high-pressure homogenization whichprocess
resultswas in ashown
largerto average particle size.
form emulsions withOn
the otherparticle
smaller hand, asize,high-pressure
usually in the homogenization
nano-size range,process regardless wasofshown to form emulsions
the biopolymer used as
with smaller particle size, usually in the nano-size range, regardless of the biopolymer used
as the coating material. For instance, high-pressure homogenization of sodium caseinate-Molecules 2021, 26, 4020 10 of 16
coated fish oil emulsions at 12 kpsi showed an average particle diameter of 168 nm [7];
this trend was also observed in samples A22TH and A44TH. In comparison, the larger
particle size obtained for their counterparts A22TS and A44TS could be the result of larger
particles formed by a bridging flocculation effect [6,11]. These flocculated particles could
be responsible for the peak observed in the micro-size region of the distribution curves
(Figure 1a). Xu et al. [6] observed the same effect in emulsions using rice glutelin as a
primary coating and 0.01% of anionic polysaccharides as the secondary layer.
Polysaccharides can form thick interfacial layers, which can prevent droplet floccu-
lation and coalescence [10,20]. Nevertheless, the bridging flocculation effect is observed
if the concentration of polysaccharide molecules is not enough to cover the entire oil
droplet in the case of single-layer emulsions or to bond with protein-coated droplets in
double-layer emulsions, causing one molecule to adsorb to the surface of several droplets
at the same time [4]. Bouyer et al. [11] suggested that this effect can also be related to the
emulsification process in turbulent flow and storage. Compared to other surface-active
biopolymers, gum arabic displays a lower affinity for oil-in-water interfaces; thus, a ratio as
high as 1:1 gum arabic:oil phase ratio is needed to form emulsions that are more resistant
to flocculation [12]. The observations from our study suggest that the concentration of
gum arabic as a secondary layer was not high enough to prevent this effect; however,
emulsions using gum guar at the same concentration did not show bridging flocculation.
The effectiveness of gum guar, a nonionic polysaccharide, to prevent aggregation was
the result of the hydration of its polar head groups. However, the accelerated shelf-life
conditions tested in this study caused dehydration of these head groups that eventually
resulted in aggregation [12], as observed by the increase in the average particle size. Hence,
a significant effect of storage on the particle size of emulsions stabilized by gum guar
was observed only on day 10. Shi et al. [18] also observed a significant increase of the
particle size over the storage of fish oil-in-water emulsions stabilized by lecithin, gum
arabic, or Tween 80. On the other hand, the resulting smaller particle size obtained at lower
concentrations of EPA + DHA could be explained by the higher availability and faster
adsorption of the biopolymer molecules used as emulsifiers to the oil phase surface due to
the higher wall material:oil phase ratio [2], resulting in greater efficiency when coating the
lipid droplets and forming smaller particles.
Another important characteristic to consider during the study of emulsions is their
efficiency at preventing the release of the core material during processing and storage.
Polysaccharides have shown potential to enhance the stability of oil-in-water emulsions
using proteins as primary emulsifiers [6,13]. In these double-layer emulsions, proteins
and polysaccharides can interact via covalent or noncovalent bonds, which influences the
stability of the emulsions [9]. Therefore, this study assessed the differences between adding
a neutral (gum guar) or an anionic (gum arabic) polysaccharide on the encapsulation
efficiency and stability given by the total EPA+DHA that remained encapsulated during
storage under accelerated shelf-life conditions (up to 10 days at 45 ◦ C).
The lack of significant differences in the encapsulation efficiencies between the two
main plots in our experimental design (gum arabic versus gum guar) indicates that despite
the bridging flocculation effect observed in treatments with gum arabic, the core material
remained encapsulated within the continuous phase of the emulsion. Nevertheless, the
clear differences between the efficiencies of the two polysaccharides to keep the EPA + DHA
encapsulated after 10 days of storage could be partially attributed to the behavior of gum
arabic under the pH conditions used during the processing of the emulsions. The initial egg
yolk solutions were adjusted to pH 6.0 before proceeding with the primary homogenization.
Under these conditions, the zeta potential of egg yolk is slightly negative [21], which could
have caused repulsion between the gum arabic molecules and the proteins adsorbed at
the surface of the lipid droplets, resulting in poor efficiency when forming a secondary
layer [7]. Furthermore, as previously discussed, gum arabic requires a ratio of 1:1 (w/w)
with the oil phase to reach its stable effect. Results from the encapsulation efficiency over
time from this study seemed to be related to the overall particle stability found for theMolecules 2021, 26, 4020 11 of 16
same treatments. The lack of significant differences between processing types on emulsions
containing gum guar suggests that the stability of the emulsions at this stage was given
mostly by the ability of the polysaccharide to act as an extra barrier to entrap the lipids in
the core material and not due to the particle size of the emulsion.
The encapsulation efficiency of an emulsion and its ability to prevent the core material
release during processing and storage will impact its oxidative stability, as it is known that
the nonencapsulated material will be more prone to oxidation in the presence of oxygen
and high temperatures [18,22,23]. Therefore, a higher concentration of surface oil results in
higher oxidation. This oxidation will adversely impact the nutritional value and sensory
quality of the product [18]. Moreover, oxidation of long-chain polyunsaturated fatty acids,
such as EPA and DHA, produces toxic compounds that are related to aging, mutagenesis,
and carcinogenesis [24,25]. Thus, the prevention of lipid oxidation is of crucial importance
in an oil-in-water emulsion system. The lack of significant effects of processing type on
the oxidative stability of emulsions containing gum guar suggests that their stability was
mostly the result of an efficient interaction between the egg yolk and the polysaccharide
when acting as a barrier between the environment and the core material.
The development of cytotoxic oxidation products from fish oil was studied to complete
the assessment of the developed egg yolk/polysaccharide emulsions. For this purpose, the
relative viability of Caco-2 cells was measured after incubation with fish oil from emulsions
throughout storage and compared to that of cells incubated with nonencapsulated fish oil.
Some compounds can display dose-dependent cytotoxicity on Caco-2 cells [26]; however,
our emulsions did not show this effect at concentrations ranging from 50–100 µg fish
oil/mL of incubation medium. Additionally, the lack of significant cell viability reduction
of Caco-2 cells showed that our developed egg yolk/polysaccharide emulsions can prevent
the formation of cytotoxic components from fish oil. Further studies are needed to evaluate
the mechanisms with which these polysaccharides exert these beneficial properties.
4. Materials and Methods
4.1. Materials
White-shelled eggs were collected from the Alberta Poultry Research Centre (Edmon-
ton, AB, Canada). Egg yolks were manually separated from the whites and rolled on
Whatman no. 1 paper to eliminate the albumen residues. After puncturing the vitelline
membrane, the egg yolk content was collected in a container placed in an ice bath and used
to form the monolayer emulsions.
Fish oil from Alaska Pollock (Gadus chalcogrammus) with a high content of eicos-
apentaenoic (EPA) and docosahexaenoic (DHA) fatty acids as triglycerides or ethyl esters
was obtained from AlaskOmega Products (Organic Technologies, Coshocton, OH, USA).
Caco-2 cells were obtained from the American Type Culture Collection and used from
passages 19–32. Dulbecco’s modified Eagle’s medium (DMEM), fetal bovine serum (FBS),
phosphate buffer saline (PBS), Hank’s balanced salt solution (HBSS), 0.25% (w/v) trypsin–
0.53 mM EDTA, 1% non-essential amino acids, 1% (w/v) penicillin–streptomycin, and
4-(2-hydroxyethyl)-1-piperazineethanesulfonic acid (HEPES) were obtained from Gibco
Invitrogen (Burlington, ON, Canada). Gum guar, gum arabic, an in vitro toxicology assay,
and all reagents used for chemical analyses were obtained from Sigma-Aldrich (Oakville,
ON, Canada).
4.2. Emulsion Formation
A graphical overview of the process followed to produce the emulsions is shown in
Figure 7.
The moisture content of the freshly extracted egg yolk was determined using a convec-
tion oven set a 105–110 ◦ C for 5 h. The 1% w/w polysaccharide solutions were prepared by
stirring gum guar or gum arabic in cool Milli-Q water at 400 rpm until complete dissolution.
The concentration and type of fish oil added followed the experimental design further4.2. Emulsion Formation
A graphical overview of the process followed to produce the emulsions is shown in
Figure 7.
The moisture content of the freshly extracted egg yolk was determined using a con-
Molecules 2021, 26, 4020 12 of 16
vection oven set a 105–110 °C for 5 h. The 1% w/w polysaccharide solutions were prepared
by stirring gum guar or gum arabic in cool Milli-Q water at 400 rpm until complete disso-
lution. The concentration and type of fish oil added followed the experimental design fur-
described
ther describedin Section 4.4.4.4.
in Section EggEgg
yolk/polysaccharide emulsions
yolk/polysaccharide werewere
emulsions formed usingusing
formed two two
processing approaches: simple and high-pressure homogenization, as described below.
processing approaches: simple and high-pressure homogenization, as described below.
Figure 7. Graphical
Figure layout
7. Graphical of the
layout processes
of the processesfollowed
followed to
to prepare theemulsions
prepare the emulsions and
and thethe sample
sample codes
codes for each
for each group.group.
4.2.1.
4.2.1. Simple
Simple (Primary)Homogenization
(Primary) Homogenization
Fishoil
Fish oilwas
was added
added totothe egg
the yolk
egg andand
yolk mixed manually
mixed to facilitate
manually its dispersion,
to facilitate then
its dispersion,
homogenized at 24,000 rpm for 2 min using a T25 Ultra Turrax (IKA Works Inc., Wilmington,
then homogenized at 24,000 rpm for 2 min using a T25 Ultra Turrax (IKA Works Inc.,
DE, USA). The polysaccharide solution was then added to reach a final concentration of
Wilmington, DE, USA). The polysaccharide solution was then added to reach a final con-
0.25 g polysaccharide per 100 g of emulsion. Based on the egg yolk moisture content, the
centration of 0.25
necessary amount g of
polysaccharide peradded
Milli-Q water was 100 g to
of obtained
emulsion.30% Based on the
egg yolk egginyolk
solids moisture
the final
content,
emulsion.the necessary
This mixture amount of Milli-Q water
was homogenized again atwas added
24,000 rpmto forobtained 30%this
2 min. Thus, eggratio
yolkofsolids
in the finalegg
1:0.0083 emulsion. This mixture was was
yolk solids:polysaccharide homogenized
kept constantagain
in allattreatments,
24,000 rpmvarying
for 2 min.
onlyThus,
thistheratio
proportion of fishegg
of 1:0.0083 oil. yolk solids:polysaccharide was kept constant in all treatments,
varying only the proportion of fish oil.
4.2.2. Secondary (High-Pressure) Homogenization
Egg yolk/fish
4.2.2. Secondary oil mixtures were
(High-Pressure) homogenized at 24,000 rpm for 2 min using a T25
Homogenization
Ultra Turrax. The corresponding polysaccharide solution was then added and mixed
Egg yolk/fish
manually oil mixtureskeeping
until homogeneous, were homogenized at 24,000
the 1:0083 egg yolk rpm for 2 min ratio
solids:polysaccharide using
in a T25
Ultra
the final emulsion. This mixture was subjected to secondary homogenization in a Pressuremixed
Turrax. The corresponding polysaccharide solution was then added and
manually until homogeneous,
Cell Homogenizer keeping Fluid
FPG 12,800 (Stansted the 1:0083
Power egg
LTD,yolk solids:polysaccharide
London, UK) at 200 MPa andratio
a in
thehydraulic relief pressure
final emulsion. of 240 MPa.
This mixture was subjected to secondary homogenization in a Pressure
Cell Homogenizer FPG 12,800 (Stansted Fluid Power LTD, London, UK) at 200 MPa and
4.2.3. Accelerated Shelf-Life
a hydraulic relief pressure of 240 MPa.
To simulate accelerated shelf-life conditions, freshly prepared emulsions (simple and
high-pressure) were transferred to air-tight sterile plastic tubes and stored at 45 ◦ C for up
4.2.3. Accelerated Shelf-Life
to 10 days. Samples from the same experimental unit were analyzed right after preparation
To0)
(day simulate accelerated
and at days 2, 4, 6, 8,shelf-life conditions,
and 10. Based freshly prepared
on preliminary emulsions
results, all treatments(simple
were and
high-pressure) were transferred
characterized according to air-tight
to their particle sterile
size and plasticover
distribution tubes andbut
time, stored at 45 °C for up
only treatments
displaying
to 10 significant
days. Samples differences
from the same with the controls (mainly
experimental those
unit were containing
analyzed 50%
right fish prepara-
after oil)
were analyzed for viscosity, encapsulation efficiency, oxidative stability, and cytotoxicity.
tion (day 0) and at days 2, 4, 6, 8, and 10. Based on preliminary results, all treatments were
characterized according
4.3. Characterization of theto their particle size and distribution over time, but only treat-
Emulsions
ments displaying
4.3.1. Viscosity significant differences with the controls (mainly those containing 50%
fish oil) were analyzed for viscosity, encapsulation efficiency, oxidative stability, and cy-
The apparent viscosity at 25 ◦ C was determined using steady-state shear measure-
totoxicity. − 1
ments (0.1–100 s ) in a Modular Compact Rheometer 302 (Anton Paar, Graz, Austria). A
concentric cylinder measuring tool with an active length of 120.2 mm and a positioning
length of 72.5 mm was used to determine the viscosity curves of emulsions formed usingMolecules 2021, 26, 4020 13 of 16
primary homogenization. A 50 mm diameter parallel plate measuring tool and a 1 mm gap
setting were used for the emulsions resulting from the secondary homogenization.
4.3.2. Particle Size and Distribution (PSD)
Emulsions were diluted 1:4 (w/w) with 1% (w/w) sodium dodecyl sulfate solution,
then vortexed for 30 s prior to analysis to avoid multiple scattering. The 2 mL samples were
placed in a disposable polystyrene cuvette for measurement. The particle size (as given
by the Sauter mean diameter, d32 ) and distribution (given by the volume percentage) of
the emulsions were measured via dynamic light scattering (DLS) in a LitesizerTM 500
(Anton Paar, Graz, Austria) using backscattered angle (175 degrees) at 25 ◦ C and 2 min of
equilibration time.
4.3.3. Encapsulation Efficiency (EEf)
The encapsulation efficiency was calculated based on the concentration of EPA + DHA
in the total and surface oil of the emulsions using the following formula:
EEf (%) = [(Total EPA + DHA − Surface EPA + DHA)/Total EPA + DHA] × 100 (1)
Total oil was extracted following the chloroform:methanol method developed by
Bligh and Dyer [27], whereas the surface oil extraction was conducted by washing with
hexanes [22]. Both methods were modified to adapt to the matrix of the emulsions to obtain
dependable yields according to previous observations [14].
Furthermore, the methylation and quantification of EPA + DHA were conducted
following the method developed by Joseph and Ackman [28] using internal standard 23:0
methyl esters for triglycerides samples, and 23:0 ethyl esters for ethyl ester samples. The
results are expressed as mg EPA + DHA/g oil.
The amount of surface oil obtained from most emulsions was below 25 mg; therefore,
the weight of the oil was recorded for considerations in the final calculation. The appro-
priate internal standard was directly added into the tube containing the surface oil for
further methylation.
The EPA/DHA content was quantified after methylation by injecting 1 µL samples
into an Agilent 7890 Gas Chromatograph with 5975 Mass Selective Detector using MSD
Chemstation software. The carrier gas was Helium 5.0 and the column was an Agilent
HP-5 MS with 30 m × 250 µm × 0.25 µm dimensions. The inlet temperature was set at
200 ◦ C and operated in splitless mode. The oven was set to 50 ◦ C for 5 min, then increased
at 5 ◦ C/min until 320 ◦ C for 5 min. Total run time was 64 min. The mass spectrum was
scanned from 40–500 m/z.
4.3.4. Propanal Content
The propanal formation in the emulsions, as assessed using headspace chromatog-
raphy, was used as a marker for the oxidation of omega-3 fatty acids. About 2 g of the
corresponding emulsion was placed into a 20 mL headspace vial, sealed, and heated at
60 ◦ C for 30 min, followed by 30 min of equilibration time at room temperature. The
headspace was then sampled manually using a Hamilton® GASTIGHT syringe, 1725 N
(Sigma-Aldrich, Oakville, ON, Canada). A total of 100 µL was manually injected in a
capillary gas chromatograph equipped with a Restek Stabilwax (Crossbond Carbowax,
Restek, Bellefonte, PA, USA) column measuring 20 m in length with a 0.53 mm internal
diameter and 0.5 µm df while using helium as the carrier gas. The oven was set to 45 ◦ C and
the total run time was 2 min. The temperature of the detector and injector was 250 ◦ C. The
propanal content was calculated using a standard curve (r2 = 0.99) built with 0, 3, 6, 9, 12,
and 15 µg propanal (98% purity) in Milli-Q water and expressed as µg propanal/g sample.Molecules 2021, 26, 4020 14 of 16
4.3.5. Peroxide Value
The peroxide value (POV) was measured following the AOAC official method 965.33 [29].
The POV was expressed as meq peroxide per kg oil and calculated using the following formula:
meq peroxide/kg oil = (mL Na2 S2 O3 × molarity Na2 S2 O3 × 1000)/g test portion (2)
4.3.6. Cytotoxicity Analysis
Caco-2 cells were routinely grown in supplemented DMEM, refreshing the medium
every other day, and used for seeding at 80% confluence. The toxicity of emulsions was
evaluated on days 0, 2, 4, 6, 8, and 10 of storage at 45 ◦ C. The egg yolk/polysaccharide
solutions without fish oil (controls) were tested under the same conditions to eliminate the
effect of the carrier components. Non-encapsulated fish oil ethyl esters (FOE) were used as
a negative control.
The toxicity of the samples was assessed by measuring the relative viability of Caco-2
cells using the In Vitro Toxicology Assay Kit from Sigma-Aldrich, which is based on the
MTT (3-[4,5-dimethylthiazol-2-yl]-2,5-diphenyl tetrazolium bromide) method developed
by Mosmann [30].
Caco-2 cells were harvested with PBS containing 0.25% trypsin and 0.53 mM EDTA,
then seeded in high-glucose and L-glutamine DMEM medium supplemented with 10%
FBS, 1% non-essential amino acids, 1% penicillin and streptomycin, and 2.5% (v/v) HEPES
to a concentration of 50,000 cells/mL. Then, 10,000 cells/well (200 µL) were placed on a
96-well plate and incubated at 37 ◦ C in a humidified incubator with 5% CO2 for 24 h.
After incubation, the original medium was replaced with the corresponding treatment
suspended in the supplemented DMEM at final concentrations of 50, 75, and 100 µg
EPA + DHA/mL medium and incubated for 24 h. The same concentration of EPA + DHA
from FOE was used for comparisons with the negative control. Supplemented DMEM
without emulsions was used as a blank reference for 100% viability. After the second
incubation, the wells were gently washed 3 times with PBS. The cells were then incubated
for 4 h with DMEM medium containing 10% MTT solution (5 mg/mL PBS). The medium
was then removed and the formazan crystals formed on each well were observed at 40×
in a Zeiss Axio Scope A1 light microscope (Zeiss, Oberkochen, Germany). The crystals
were then dissolved by pipetting up and down with 200 µL of acidified isopropanol. The
absorbance of each well was measured spectrophotometrically at a wavelength of 570 nm.
The background absorbance of the plate was measured at 690 nm and subtracted from the
value at 570 nm. This result was used to calculate the relative cell viability (%) using the
following formula:
Relative cell viability (%) = (Abs treated cells × 100)/(Abs blank) (3)
4.4. Sample Identification and Statistical Analysis
As an example, sample IDs were structured as follows: G44TS. The first letter refers to
the polysaccharide type: G for gum guar or A for gum arabic. The following two digits
refer to the percentage of total EPA + DHA from fish oil added, which was calculated
based on the egg yolk’s dry matter. The third character indicates the esterification type:
T for triglycerides and E for ethyl esters. Finally, the last letter refers to the process used
for the emulsion formation: S means simple homogenization and H means high-pressure
homogenization. Each group of treatments was paired with its control without fish oil,
which were identified as Control-AS, Control-AH, Control-GS, and Control-GH, where the
last two letters mean the same as specified before. Non-encapsulated fish oil ethyl esters
(FOE) were used as negative controls for toxicity assays and oxidative stability.
Emulsions were formed using a combination of polysaccharide type, processing
method, concentration, and type of esterification of EPA + DHA. The experimental design
was a split-split-plot in time. The main plots were the egg yolk:polysaccharide solutions.
The fixed factor for the split-plot was the processing type at two levels: simple or high-Molecules 2021, 26, 4020 15 of 16
pressure homogenization. Finally, the fixed factor for the split-split-plot was the type
and concentration of fish oil at 4 levels: 22 and 44% EPA + DHA triglycerides and 22
and 44% EPA + DHA ethyl esters. Time (at 6 levels) was considered a fixed effect since
its effect on the output variables was of interest. All chemical analyses were carried out
in triplicates. Four replications were conducted for the toxicity analysis. Results were
expressed as the mean and the standard error. A linear mixed-effects model was used to
assess the significance of time as a factor and the fixed factors over time; a one-way analysis
of variance (ANOVA) was used to find significant factors among treatments at a given time.
Significant differences in the mean values were considered at p < 0.05 using Tukey’s test.
All the statistical analyses were conducted using the statistical package R version 3.3.2 in R
studio version 1.0.136 [13].
Supplementary Materials: The following are available online, Figure S1: Toxicity of emulsions at
day 0.
Author Contributions: Conceptualization, S.Y.G.T.; Formal analysis, S.Y.G.T.; Funding acquisition,
J.W.; Investigation, S.Y.G.T.; Methodology, S.Y.G.T.; Project administration, S.Y.G.T.; Resources, J.W.;
Supervision, J.W.; Validation, J.W.; Visualization, S.Y.G.T.; Writing—original draft, S.Y.G.T.; Writing—
review & editing, J.W. Both authors have read and agreed to the published version of the manuscript.
Funding: This research was funded by the Alberta Innovates -Bio Solutions, the Natural Sciences and
Engineering Research Council (NSERC) of Canada, and the Mexican Consejo Nacional de Ciencia y
Tecnologia (grant number 391557).
Institutional Review Board Statement: Not applicable.
Informed Consent Statement: Not applicable.
Data Availability Statement: The data that support the findings of this study are available upon
request from the corresponding author.
Conflicts of Interest: The authors declare no conflict of interest.
Sample Availability: Due to the nature of the samples, they were not physically kept.
References
1. Ding, M.; Zhang, H.; Zhang, H.; Tao, N.; Wang, X.; Zhong, J. Gelatin molecular structures affect behaviors of fish oil-loaded
traditional and Pickering emulsions. Food Chem. 2020, 309, 125642. [CrossRef]
2. Bai, L.; Huan, S.; Gu, J.; McClements, D.J. Fabrication of oil-in-water nanoemulsions by dual-channel microfluidization using
natural emulsifiers: Saponins, phospholipids, proteins, and polysaccharides. Food Hydrocoll. 2016, 61, 703–711. [CrossRef]
3. Liu, F.; Zhu, Z.; Ma, C.; Luo, X.; Bai, L.; Decker, E.A.; Gao, Y.; McClements, D.J. Fabrication of concentrated fish oil emulsions
using dual-channel microfluidization: Impact of droplet concentration on physical properties and lipid oxidation. J. Agric.
Food Chem. 2016, 64, 9532–9541. [CrossRef]
4. Lin, D.; Kelly, A.L.; Miao, S. The role of mixing sequence in structuring O/W emulsions and emulsion gels produced by electro-
static protein-polysaccharide interactions between soy protein isolate-coated droplets and alginate molecules. Food Hydrocoll.
2021, 113, 106537. [CrossRef]
5. Zha, F.; Dong, S.; Rao, J.; Chen, B. Pea protein isolate-gum Arabic Maillard conjugates improves physical and oxidative stability
of oil-in-water emulsions. Food Chem. 2019, 285, 130–138. [CrossRef]
6. Xu, X.; Luo, L.; Liu, C.; McClements, D.J. Utilization of anionic polysaccharides to improve the stability of rice glutelin emulsions:
Impact of polysaccharide type, pH, salt, and temperature. Food Hydrocoll. 2017, 64, 112–122. [CrossRef]
7. Chang, Y.; McClements, D.J. Influence of emulsifier type on the in vitro digestion of fish oil-in-water emulsions in the presence of
an anionic marine polysaccharide (fucoidan): Caseinate, whey protein, lecithin, or Tween 80. Food Hydrocoll. 2016, 61, 92–101.
[CrossRef]
8. Jimenez-Martin, E.; Gharsallaoui, A.; Perez-Palacios, T.; Ruiz, C.J.; Antequera, R.T. Suitability of using monolayered and
multilayered emulsions for microencapsulation of o-3 fatty acids by spray drying: Effect of storage at different temperatures.
Food Bioproc. Technol. 2015, 8, 100–111. [CrossRef]
9. Gentile, L. Protein-polysaccharide interactions and aggregates in food formulations. Curr. Opin. Colloid Interface Sci. 2020, 48,
18–27. [CrossRef]
10. Charoen, R.; Jangchud, A.; Jangchud, K.; Harnsilawat, T.; Naivikul, O.; McClements, D.J. Influence of biopolymer emulsifier type
on formation and stability of rice bran oil-in-water emulsions: Whey protein, gum arabic, and modified starch. J. Food Sci. 2011,
76, E165–E172. [CrossRef]You can also read