New particle formation event detection with Mask R-CNN
←
→
Page content transcription
If your browser does not render page correctly, please read the page content below

Research article
Atmos. Chem. Phys., 22, 1293–1309, 2022
https://doi.org/10.5194/acp-22-1293-2022
© Author(s) 2022. This work is distributed under
the Creative Commons Attribution 4.0 License.

                         New particle formation event detection
                                   with Mask R-CNN
       Peifeng Su1,2 , Jorma Joutsensaari3 , Lubna Dada4,5 , Martha Arbayani Zaidan2,6 , Tuomo Nieminen2,7 ,
       Xinyang Li2 , Yusheng Wu2 , Stefano Decesari8 , Sasu Tarkoma9 , Tuukka Petäjä2,6 , Markku Kulmala2,6 ,
                                                and Petri Pellikka1,2
               1 Department      of Geosciences and Geography, University of Helsinki, 00014 Helsinki, Finland
                2 Institute   for Atmospheric and Earth System Research (INAR/Physics), Faculty of Science,
                                          University of Helsinki, 00014 Helsinki, Finland
            3 Department of Applied Physics, University of Eastern Finland, P.O. Box 1627, 70211 Kuopio, Finland
          4 Extreme Environments Research Laboratory, École Polytechnique Fédérale de Lausanne (EPFL) Valais,

                                                       1951 Sion, Switzerland
                   5 Laboratory of Atmospheric Chemistry, Paul Scherrer Institute, 5232 Villigen, Switzerland
                      6 Joint International Research Laboratory of Atmospheric and Earth System Sciences,

                           School of Atmospheric Sciences, Nanjing University, Nanjing, 210023, China
         7 Institute for Atmospheric and Earth System Research (INAR/Forest Sciences), Faculty of Agriculture and

                                      Forestry, University of Helsinki, 00014 Helsinki, Finland
                  8 Institute of Atmospheric and Climate Sciences, National Research Council of Italy (CNR),

                                                        40129, Bologna, Italy
            9 Department of Computer Science, Faculty of Science, University of Helsinki, 00014 Helsinki, Finland

                                  Correspondence: Peifeng Su (peifeng.su@helsinki.fi)

                               Received: 8 September 2021 – Discussion started: 13 September 2021
                     Revised: 14 December 2021 – Accepted: 14 December 2021 – Published: 25 January 2022

      Abstract. Atmospheric new particle formation (NPF) is an important source of climate-relevant aerosol parti-
      cles which has been observed at many locations globally. To study this phenomenon, the first step is to identify
      whether an NPF event occurs or not on a given day. In practice, NPF event identification is performed visually
      by classifying the NPF event or non-event days from the particle number size distribution surface plots. Un-
      fortunately, this day-by-day visual classification is time-consuming and labor-intensive, and the identification
      process renders subjective results. To detect NPF events automatically, we regard the visual signature (banana
      shape) which has been observed all over the world in NPF surface plots as a special kind of object, and a deep
      learning model called Mask R-CNN is applied to localize the spatial layouts of NPF events in their surface plots.
      Utilizing only 358 human-annotated masks on data from the Station for Measuring Ecosystem–Atmosphere Re-
      lations (SMEAR) II station (Hyytiälä, Finland), the Mask R-CNN model was successfully generalized for three
      SMEAR stations in Finland and the San Pietro Capofiume (SPC) station in Italy. In addition to the detection of
      NPF events (especially the strongest events), the presented method can determine the growth rates, start times,
      and end times for NPF events automatically. The automatically determined growth rates agree with the manu-
      ally determined growth rates. The statistical results validate the potential of applying the proposed method to
      different sites, which will improve the automatic level for NPF event detection and analysis. Furthermore, the
      proposed automatic NPF event analysis method can minimize subjectivity compared with human-made analysis,
      especially when long-term data series are analyzed and statistical comparisons between different sites are needed
      for event characteristics such as the start and end times, thereby saving time and effort for scientists studying
      NPF events.

Published by Copernicus Publications on behalf of the European Geosciences Union.
1294                                                     P. Su et al.: New particle formation event detection with Mask R-CNN

1   Introduction                                                    tion method that applies to NPF datasets collected in different
                                                                    sites is necessary.
                                                                       Although not all NPF events show signs of growth (Dal
Atmospheric aerosols have profound impacts on air quality,          Maso et al., 2005) or have the commonly known “banana”
human health, ecosystems, weather, and climate (Asmi et al.,        shape, in this work, we only focus on the regional (banana-
2011a; Hirsikko et al., 2011; Joutsensaari et al., 2018; Chu        type) NPF events which are the most common type of event
et al., 2019; Lee et al., 2019). New particle formation (NPF)       observed globally and whose formation signature is the con-
is an important source of atmospheric aerosols, which has           tinuous formation and subsequent growth of nucleation mode
been observed in a variety of locations in the world such           (sub-25 nm) particles. We observe that there are some simi-
as different types of forests, semi-polluted or heavily pol-        larities between recognizing NPF events in surface plots and
luted cities, high-altitude sites, coastal sites, and polar re-     other objects in digital images. Taking cats as an example, no
gions (Kulmala et al., 2004; Kuang et al., 2010; Kulmala            unique mathematical criterion or definition for NPF events or
et al., 2012; Nieminen et al., 2018; Dada et al., 2018; Lee         cats can be found. However, humans can easily distinguish
et al., 2019). In addition to the spatial scale, on the tempo-      whether an NPF event occurs in a surface plot or whether a
ral scale, NPF events have also been observed in sites built        cat occurs in a digital image in most cases. Inspired by this
a long time ago (Dal Maso et al., 2005; Järvi et al., 2009;         observation, we regard the banana-type NPF events as a spe-
Asmi et al., 2011b) and newly built sites (Kerminen et al.,         cial kind of object, and thus the object detection techniques
2018; Chu et al., 2019; Liu et al., 2020; Yan et al., 2021).        for detecting cats can be used to detect the banana-shaped
   To analyze NPF events, the first step is to determine            NPF events. For simplicity, we use NPF images to represent
whether an NPF event has occurred or not (Kulmala et al.,           surface plots without axes. Though surface plots have clear
2012). Previous studies on detecting NPF types can be               physical meanings, we can apply different image transforma-
roughly divided into three categories: vision-based, rule-          tions to NPF images without any restriction. In this study, we
based, and data-driven. Vision-based methods visually clas-         use an instance segmentation method called Mask R-CNN
sify the NPF types day by day according to some criteria            (He et al., 2017), a deep learning model, to localize the NPF
based on surface plots of the size distribution time series         events by predicting a mask that can cover the spatial layout
(Mäkelä et al., 2000; Dal Maso et al., 2005; Hirsikko et al.,       (the banana shape) of each NPF event. In other words, we try
2011). The advantage of vision-based methods is that experts        to answer the NPF classification problem by directly localiz-
can explicitly tell which region in a surface plot is thought       ing the visual signature of NPF events. Since Mask R-CNN
of as the evidence of an NPF event, and the drawbacks of            only focuses on the banana shape that has been observed
vision-based methods are that they are labor-intensive and          globally, it can be used on datasets collected from different
time-consuming and the classification process is subject to         sites automatically. For more information about object detec-
human bias. Rule-based methods classify NPF types with              tion and instance segmentation, please refer to Appendix A.
several explicit steps where some thresholds on the parti-             To verify the generality of the presented method, we test
cle number concentrations are used as prior knowledge (Kul-         the Mask R-CNN model on three SMEAR stations (Sta-
mala et al., 2012; Dada et al., 2018). Rule-based methods can       tion for Measuring Ecosystem–Atmosphere Relations I, II,
classify NPF types automatically, but the drawback of these         and III) in Finland and one station located in San Pietro
methods is that the particle number concentrations can vary         Capofiume in the Po Valley basin in Italy (SPC station).
a lot between different environments, meaning that the prior        The datasets collected in the four stations sum up approxi-
knowledge used in one site may fail in other sites or complex       mately 73 years of measurements. Besides the classification
situations. Data-driven methods utilize the measured particle       problem, the accurate location of events makes it easier to
number size distributions and annotated NPF types (labels)          determine the growth rates, start times, and end times au-
to establish a model which can identify NPF types. For in-          tomatically. Our code at https://github.com/cvvsu/maskNPF
stance, neural networks (NNs) have been used to classify            (last access: 20 January 2022) has been released to test it
NPF types no matter whether handcrafted features (Nanni             on datasets collected in other sites and facilitate future re-
et al., 2017) are used (Zaidan et al., 2018) or not (Joutsensaari   search. Our aims in this study are (1) to automatically local-
et al., 2018). The advantages of data-driven or NN-based            ize the globally observed visual signature (banana shape) for
methods are that they do not need any specific threshold on         regional NPF events, which can identify NPF types (events
particle number concentration and the classification process        occur or not, especially for the strongest events), and deter-
is automatic. However, annotated NPF labels are required to         mine the growth rates, start times, and end times and (2) to
train the NNs, and since the label annotation process is sub-       investigate the statistical characteristics of growth rates, start
jective, the trained NNs also “learn” the biases in the labels,     times, and end times for the strongest NPF events for the
which impedes the application of NN-based methods to dif-           three SMEAR stations in Finland and the SPC station in Italy.
ferent sites. Considering the increasing number of global ob-
servation stations (Kulmala, 2018), an automatic NPF detec-

Atmos. Chem. Phys., 22, 1293–1309, 2022                                               https://doi.org/10.5194/acp-22-1293-2022
P. Su et al.: New particle formation event detection with Mask R-CNN                                                              1295

2     Materials and methods                                            in Po Valley, which is the largest industrial, trading, and
                                                                       agricultural area in Italy (Joutsensaari et al., 2018). The
2.1    Measurement sites                                               particle number size distribution measurements started in
                                                                       March 2002 and were carried out continuously, except
We utilized aerosol size distribution data from three obser-           for occasional system malfunctions, until 2017. A detailed
vation sites in Finland and one in Italy. All the sites oper-          overview of the site and measurements can be found in Jout-
ated similar instrumentation, and the observations followed            sensaari et al. (2018). The analyzed particle number size
guidelines set by the Aerosols, Clouds, and Trace gases Re-            distribution dataset collected in SPC covers 4177 d from
search InfraStructure Network (ACTRIS) for in situ aerosol             24 March 2002 until 16 May 2017 (5534 d in total).
number size distribution measurements (Wiedensohler et al.,               The aerosol particle number size distributions were mea-
2012). The observation sites and instruments are briefly de-           sured by differential mobility particle sizer (DMPS) sys-
scribed below.                                                         tems (Aalto et al., 2001) at all four stations (Fig. 1). The
   The SMEAR I station is located at the Värriö Subarctic              particle number size distribution datasets collected from the
Research Station of the University of Helsinki (67◦ 460 N,             four stations are termed the Värriö dataset, Hyytiälä dataset,
29◦ 360 E; 390 m a.s.l.) in northern Finland. The station is sur-      Kumpula dataset, and SPC dataset. The DMPS systems in-
rounded by 70-year-old Scots pine (Pinus sylvestris) boreal            stalled in different stations have different detection ranges for
forest at Kotovaara hill, and some small lakes and mires exist         particle sizes, and particle sizes ranging from 3 to 1000 nm
in valleys 60 m lower and more than 1 km away. The mea-                are considered in this work. Note that the detected particle
surements of particle number size distribution started in 1997         size does not have to reach 1000 nm for all DMPS systems.
in SMEAR I. For more details about the site and measure-
ments, please refer to Vana et al. (2016), Kyrö et al. (2014),         2.2   NPF types
and Hari et al. (1994). The analyzed particle number size
distribution dataset collected in Värriö covers 8189 d from            According to the guidelines reported in previous studies, the
10 December 1997 until 14 January 2021 (8436 d in total,               particle number size distributions can be classified into six
and the days with no data were omitted from this study).               different types (Dal Maso et al., 2005; Kulmala et al., 2012;
   The SMEAR II station is located in the Hyytiälä Forestry            Joutsensaari et al., 2018):
Field Station of the University of Helsinki in central Finland
(61◦ 510 N, 24◦ 170 E; 130 m a.s.l.), within pine-dominated bo-          – Class Ia events. Ia-type events show clear and strong
real forest with some deciduous birch (Betula pubescens) and               formation of small particles (especially 3–6 nm), with
aspen (Populus tremuloides) trees. Comprehensive measure-                  few or no pre-existing particles in the smallest size
ments including particle, radiation, gas, meteorological, and              ranges (Fig. 2a).
complementary data have been made for more than 20 years                 – Class Ib events. Ib-type events show the same behavior
(Hari and Kulmala, 2005; Dada et al., 2017, 2018). The lo-                 as class Ia but with less clarity (Fig. 2b).
cation is considered a semi-clean boreal forest environment
according to the level of anthropogenic pollutants (Nieminen             – Class II events. II-type events do not show clear ev-
et al., 2015; Dada et al., 2018; Zaidan et al., 2018). A de-               idence for observing the growth. That is, the growth
tailed overview of the site and measurements can be found in               rate cannot be determined without a large uncertainty
Hari et al. (2013). The analyzed particle number size distribu-            (Fig. 2c).
tion dataset collected in Hyytiälä covers 8642 d from 31 Jan-
uary 1996 until 21 January 2020 (8756 d in total).                       – Class Non-Event (NE). NE does not show any evidence
   The SMEAR III station is located in the Kumpula campus                  for new particle formation in the nucleation particle size
of the University of Helsinki in southern Finland (60◦ 120 N,              range (Fig. 2d).
24◦ 580 E; 26 m a.s.l.). The station has accumulated approxi-
                                                                         – Class Undefined (Undef). Undef is a type that is difficult
mately 17 years of measurements such as air pollution and
                                                                           to be classified as events or NEs since some but not all
meteorological and turbulent exchange (Järvi et al., 2009).
                                                                           features for events can be seen (Fig. 2e).
The location is within an urban environment surrounded both
by campus buildings, busy streets, and open bedrock and                  – Class Bad-Data (BD). The BD type is caused by instru-
by parklands of deciduous forest, such as birch, aspen, and                ment malfunction. Generally, too high or too low par-
maple (Acer pseudoplatanus). For more details about the site               ticle concentrations or missing data can be observed in
and measurements, please refer to Järvi et al. (2009) and                  the surface plots (Fig. 2f).
Dada et al. (2020b). The analyzed particle number size dis-
tribution dataset collected in Kumpula covers 5775 d from                 Figure 2 shows the example surface plots for different NPF
1 January 2005 until 14 January 2021 (5857 d in total).                types. The banana shape can be seen clearly for Ia-type and
   The San Pietro Capofiume measurement station (SPC sta-              Ib-type NPF events because they are so consistent throughout
tion) is located in a rural area (44◦ 390 N, 11◦ 370 E; 11 m a.s.l.)   the day and are little influenced by local wind fields. Ia-type

https://doi.org/10.5194/acp-22-1293-2022                                               Atmos. Chem. Phys., 22, 1293–1309, 2022
1296                                                       P. Su et al.: New particle formation event detection with Mask R-CNN

Figure 1. Värriö, Hyytiälä, Kumpula, and San Pietro Capofiume stations. Image credits: (a, b) Kansalaisen karttapaikka of the National
Land Survey of Finland (https://asiointi.maanmittauslaitos.fi/karttapaikka/, last access: 20 January 2022); (c, d) © Google Earth; (e) Matias
Uusinoka, 2021; (f) Petri Pellikka, 2019; (g) http://www.arimola.it/sito/2-non-categorizzato, last access: 20 January 2022, V. Martignani,
2020; (h) INAR.

and Ib-type NPF events are usually connected with phenom-                That is,
ena happening at large (regional) spatial scales. However, for
                                                                         Y = fθ (X),                                                     (1)
II-type NPF events, interruptions in surface plots are often
associated with more local sources of variability. The banana            where X is an input NPF image and Y contains three outputs:
shape is not very clear for II-type NPF events and can be                the class labels, bounding boxes, and masks. During train-
observed even in some Undef types.                                       ing, the parameters are updated by reducing the losses be-
                                                                         tween the output and annotated class labels, bounding boxes,
2.3    Mask R-CNN                                                        and masks, leading to the best-fitted function fθ ∗ (Girshick,
                                                                         2015; Ren et al., 2016; He et al., 2017). The learned function
In order to fill the research gap mentioned in the Introduction,         fθ ∗ is then applied to the test set to verify its generality.
we used an object instance segmentation technique called                    Similarly to Joutsensaari et al. (2018), we fine-tuned the
Mask R-CNN, which can accurately localize an NPF event’s                 Mask R-CNN model which had been pre-trained on the Mi-
spatial layout. Mask R-CNN extends the object detection                  crosoft COCO dataset (Lin et al., 2014) with only 358 an-
method Faster R-CNN (Ren et al., 2016) by adding a new                   notated masks. These 358 masks were created through the
branch for generating segmentation masks of objects (He                  labeling tool “LabelMe” (Russell et al., 2008) and were
et al., 2017), and Faster R-CNN is an advanced version of                from 358 NPF images (78 Ia-type, 202 Ib-type, and 78 II-
Fast R-CNN (Girshick, 2015). The Mask R-CNN, Faster R-                   type). The 358 NPF images were generated from the Hyytiälä
CNN, and Fast R-CNN models are derived from the Regions                  dataset, and the period was from 1996 to 2003. During
with CNN features (R-CNN) model (Girshick et al., 2014),                 training, 300 NPF images with masks were randomly se-
where CNN means convolutional neural network. The archi-                 lected as the training set, and the remaining 58 NPF im-
tecture of Mask R-CNN is shown in Fig. 3.                                ages with masks were the validation set (Fig. 4). The learn-
   The Mask R-CNN model can be seen as a learnable func-                 ing rate was 5 × 10⁻³ , and decreased every 3 epochs with
tion fθ that is parameterized by the learnable parameters θ .            a factor of 0.10. The stochastic gradient descent optimizer
                                                                         was used. We used weight decay of 5 × 10⁻⁴ and momen-
                                                                         tum of 0.90. The Mask R-CNN model was fine-tuned for

Atmos. Chem. Phys., 22, 1293–1309, 2022                                                     https://doi.org/10.5194/acp-22-1293-2022
P. Su et al.: New particle formation event detection with Mask R-CNN                                                                  1297

Figure 2. Example surface plots in the Hyytiälä dataset for different new particle formation types. Dates of measurements are used as titles
for subplots, and class names are in parentheses. Dates in figures throughout this paper are given in the format year-month-day.

10 epochs. All the NPF images and masks were resampled to                and end times, respectively. The bottom and upper edges of
256 × 256 pixels, and with an NVIDIA V100 GPU, the train-                bounding boxes automatically provide a size window that
ing process lasted around 5 min. Data collected after 2003               covers the related NPF event (Figs. 3 and 5).
in Hyytiälä and datasets collected in Värriö, Kumpula, and
SPC are the test sets. Code and more results are available at            2.4   Growth rate
https://github.com/cvvsu/maskNPF.git (last access: 20 Jan-
uary 2022).                                                              The particle growth rate (GR) is the rate of change for a given
   Given a specific day, if no mask can be detected by the               particle:
Mask R-CNN model, then this day will not be classified as an
                                                                                dDp   1Dp   Dp2 − Dp1
event day. On the other hand, if at least one mask is detected           GR =       =     =           ,                                 (2)
by the Mask R-CNN model, then this day will be recognized                        dt    1t    t2 − t1
as an event day by the Mask R-CNN model. Since Mask R-                   where Dp2 and Dp1 are the particle diameters at times t2 and
CNN only focuses on the banana shape, some regions in NPF                t1 , respectively.
images that are not events can also be localized, resulting in               The maximum concentration method and log-normal dis-
more than one mask that can be detected for one NPF im-                  tribution function (mode fitting) method are two widely used
age (Fig. 3). For each mask, there is an objectiveness score             methods to calculate the growth rate (GR) for an NPF event
in terms of [0, 1] showing the probability of an event occur-            (Kulmala et al., 2012; Dada et al., 2020a). The GRs de-
rence. In addition to the objectiveness score, a bounding box            termined by these two methods have the same order and
is also obtained.                                                        seasonal variations (Dal Maso et al., 2005; Hirsikko et al.,
   Assuming the time resolution of DMPS systems are                      2005; Yli-Juuti et al., 2011). Since the localization of the
10 min and there are 52 samples for particle sizes ranging               NPF events can be detected, we can accordingly calculate
from 3 to 1000 nm, the recorded particle number size distri-             the GR of an NPF event automatically using the maximum
bution for 1 d is a data matrix with the shape of 52 × 144 (3            concentration method. We used the random sample consen-
to 1000 nm from the bottom row to the top row and 00:00 to               sus (RANSAC) algorithm (Choi et al., 2009) instead of or-
00:00 the next day (local time) from the first column to the             dinary least squares fitting to determine GRs. Compared to
last column). We resampled the predicted masks to the size               ordinary least squares fitting, the RANSAC algorithm is ro-
of 52 × 144, aligning to the shapes of collected data (Fig. 5).          bust to outliers. In addition to GRs, the predicted masks can
   The value of a pixel in a mask represents the probability             also be used to analyze the characters of start times and end
of the pixel belonging to an event. For each predicted mask,             times of the strongest NPF events.
it was binarized at a threshold of 0.50 (He et al., 2017). The
left and right edges of bounding boxes determine the start

https://doi.org/10.5194/acp-22-1293-2022                                                  Atmos. Chem. Phys., 22, 1293–1309, 2022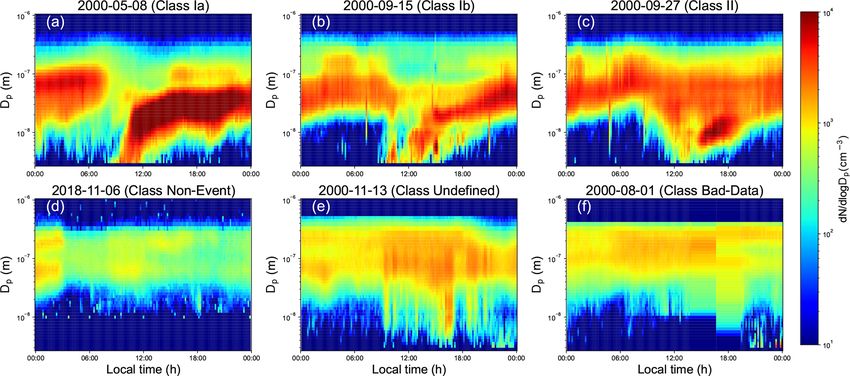
1298                                                      P. Su et al.: New particle formation event detection with Mask R-CNN

Figure 3. The architecture of Mask R-CNN. ResNet-50 is ResNet (He et al., 2016a, b) with 50 layers. FPN is the feature pyramid network
(Lin et al., 2017). RPN is the region proposal network (Ren et al., 2016). RoIAlign (region of interest align) is the RoIAlign layer that
properly aligning the features (He et al., 2017).

3     Results and discussion                                           in NPF images as a special object is reasonable. In Table 1,
                                                                       some Undef, NE, and BD days are classified as event days
3.1    Classification results                                          by the Mask R-CNN model. We visualize these misclassified
                                                                       days in Appendix B to help readers have a better understand-
According to the classification results on the Hyytiälä dataset        ing of the detection results.
(Table 1), changing the threshold of the objectiveness score              According to the classification results of the four datasets,
does not affect the Ia and Ib types. However, on the SPC               for scientists who are only concerned about identifying Ia
dataset, different thresholds have a big effect on the clas-           and Ib event types, this method will save them plenty of time
sification accuracy of Ia and Ib types (Table 2). Since the            and effort. Since the II-type events usually do not present a
Mask R-CNN model was trained on the masks derived from                 clear banana shape in the NPF images and Undef days are
the Hyytiälä dataset, it did not contain any information about         difficult to be classified as events or NEs, the Mask R-CNN
the SPC dataset, resulting in unstable classification accuracy         model fails to distinguish some of these days (Tables 1 and
when changing the threshold.                                           2). However, detection results of Mask R-CNN can be used
   According to the classification results shown in Tables 1           as auxiliary information to help determine the II and Undef
and 2, there is a trade-off between the classification accu-           types for scientists.
racy of NPF events and the number of “misclassified” days
(NE, Undef, or BD days are classified as event days by Mask            3.2   Growth rate
R-CNN), which is controlled by the threshold. Re-training
the Mask R-CNN model on masks derived from the SPC                     In this study, we show that combined with the detected
dataset may improve the classification accuracy on the SPC             masks, the maximum concentration method can be used to
dataset and make the classification results stable indepen-            calculate the GRs automatically (Figs. 5 and 6). If not speci-
dent of the chosen threshold. We did not re-train the Mask             fied, we only focus on determining the GRs, start times, and
R-CNN model to demonstrate the generality of our method                end times for the strongest NPF events.
(Table 2). Once a small threshold such as 0.20 for the ob-                Daytime hours between 06:00 and 18:00 (local time) were
jectiveness score is selected, on the SPC dataset and without          used for the traditional maximum concentration method to
annotated masks or class labels, the classification accuracy           calculate the GRs. However, when the prior is not satisfied
is 94.80 % for Ia-type NPF events, 87.94 % for Ib-type NPF             or particle burst is present in the surface plots, scientists need
events, 90.57 % for a combination of Ia-type and Ib-type NPF           to select the start and end times manually. With the detected
events (Table 2), which are higher accuracies than the results         masks, the proposed method can automatically determine the
reported in Joutsensaari et al. (2018), where an NN-based              time window (left and right edges of the bounding boxes,
method was applied. The classification results on the SPC              Figs. 3 and 5), and there is no need to manually adjust the
dataset demonstrate the idea that regarding the banana shape           start and end times. Usually, different size windows were ap-

Atmos. Chem. Phys., 22, 1293–1309, 2022                                                  https://doi.org/10.5194/acp-22-1293-2022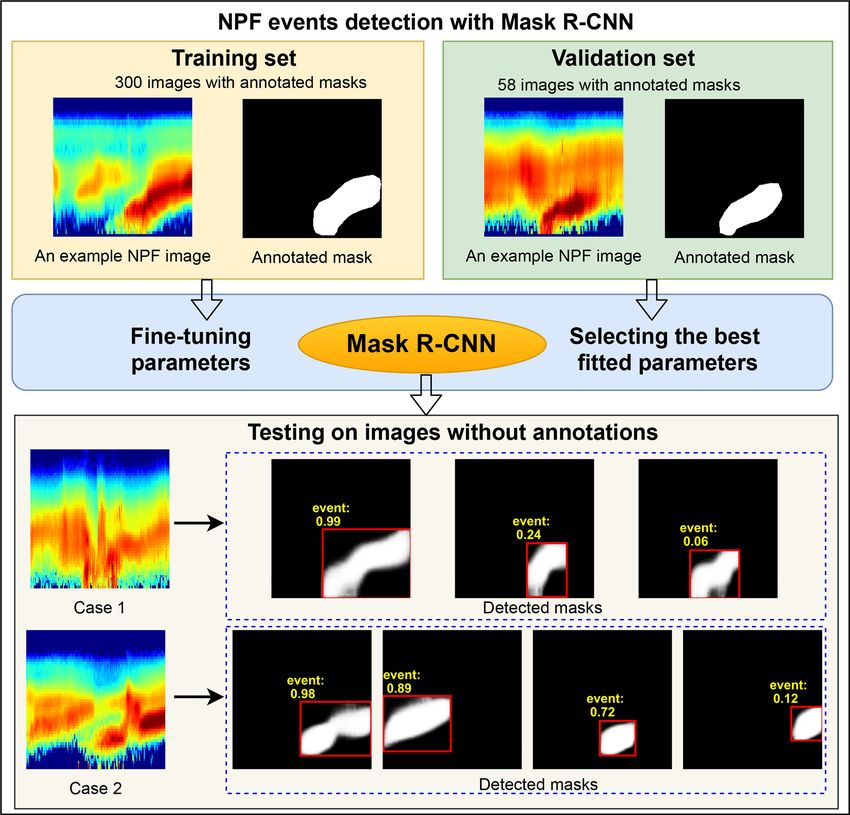
P. Su et al.: New particle formation event detection with Mask R-CNN                                                               1299

Figure 4. The flowchart of new particle formation event detection via Mask R-CNN.

Table 1. Classification results on the Hyytiälä dataset (8642 d). Numbers in parentheses are days for each class annotated by experts. An
objectiveness score ≥ 0.00 means that no threshold is applied and all the detected days are seen as event days.

            Objectiveness score     Ia (137)   Ib (722)    II (1031)   NE (1991)     Undef (3456)      BD (305)    Total (8642)
            ≥ 0.90                      137         688         690            18              419            20          1972
            ≥ 0.80                      137         703         759            42              594            24          2259
            ≥ 0.60                      137         706         829            65              815            31          2583
            ≥ 0.40                      137         711         880           110             1023            38          2899
            ≥ 0.20                      137         715         922           216             1312            57          3359
            ≥ 0.00                      137         717         967           461             1770            81          4133

plied to calculate GRs, and we selected the 3–25 nm as the               concentration and mode fitting methods are termed tradi-
size range for GR calculation (Fig. 6). However, other size              tional methods in this work.
ranges are also possible, and for more information, please                  As shown in Fig. 7, an obvious downtrend of GRs for the
refer to our code at https://github.com/cvvsu/maskNPF (last              SPC station can be seen, and the medians of GRs for the
access: 20 January 2022). To avoid confusion, the maximum                SPC station are the highest compared to those for the other

https://doi.org/10.5194/acp-22-1293-2022                                                  Atmos. Chem. Phys., 22, 1293–1309, 2022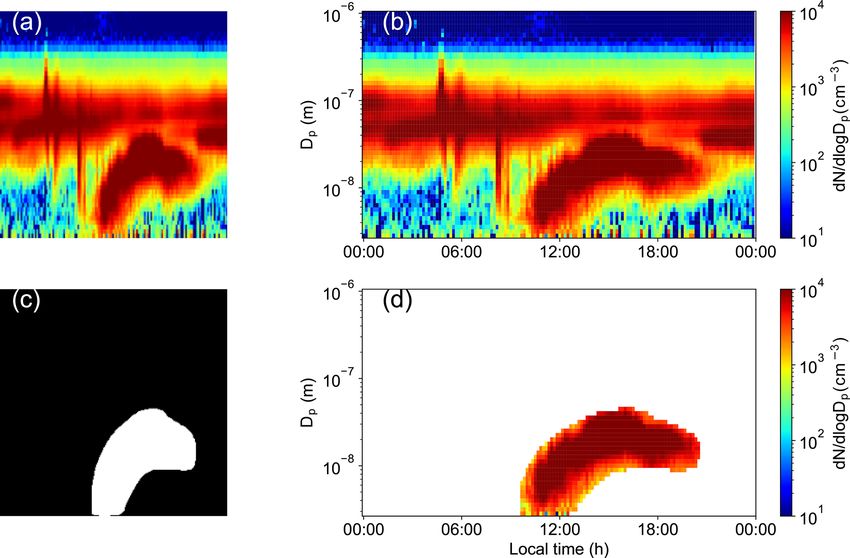
1300                                                       P. Su et al.: New particle formation event detection with Mask R-CNN

Figure 5. Example surface plot with the aligned mask. (a) An NPF image (size 256 × 256 pixels). (b) Related surface plot of (a). (c) Detected
mask of (a) (size 256 × 256 pixels). (d) Surface plot with the aligned mask.

Table 2. Classification results on the SPC dataset (4177 d) without annotations. Numbers in parentheses are days for each class annotated by
experts.

              Objectiveness score    Ia (269)   Ib (431)    II (619)   NE (1416)     Undef (841)     BD (601)     Total (4177)
              ≥ 0.90                     179         208        111              1              9           19            527
              ≥ 0.80                     210         275        159              2             25           28            699
              ≥ 0.60                     241         329        228              5             46           40            889
              ≥ 0.40                     249         357        280             12             64           56           1018
              ≥ 0.20                     255         379        347            101            141          107           1330
              ≥ 0.00                     262         402        448            275            290          180           1857

stations in most of the years, which is the same with the GRs            for the Hyytiälä and SPC stations, respectively. The tradition-
determined by the traditional methods. The traditionally de-             ally determined GRs of the Hyytiälä station were calculated
termined GRs of the SPC dataset utilized two different meth-             by the mode fitting method, which further verified that the
ods: from 24 March 2002 to 18 June 2011, the maximum                     GRs determined by the maximum concentration and mode
concentration method was used, and from 19 June 2011 to                  fitting methods should have the same order and variations
14 August 2017, the mode fitting method was applied. The                 (Yli-Juuti et al., 2011). The statistical results of GRs indi-
median of GRs for the Kumpula station is greater than that               cate the potential to utilize the automatic method to calculate
for the Värriö and Hyytiälä stations but smaller than that for           GRs. Additionally, determining the GRs automatically leads
the SPC station in most of the years, which is consistent                to consistent results and eliminates human-made errors.
with the observation that the GRs are highly related to the
local pollution levels (Kulmala et al., 2005; Hamed et al.,              3.3   Start time and end time
2007). The Pearson correlation coefficients between tradi-
tionally and automatically determined GRs are 0.59 and 0.53              In addition to the GR, with the detected mask, the start time
                                                                         and end time of an event can also be determined automat-

Atmos. Chem. Phys., 22, 1293–1309, 2022                                                     https://doi.org/10.5194/acp-22-1293-2022
P. Su et al.: New particle formation event detection with Mask R-CNN                                                                  1301

Figure 6. Examples of the automatically determined growth rates by the proposed method. From the top row to the bottom row, each row
shows the examples (white curves) for the Värriö, Hyytiälä, Kumpula, and SPC datasets, respectively. The date is shown as the title for each
example.

ically. Start and end times of events are reported in very                 The event durations for the NPF events on the SPC station
few publications (Kerminen et al., 2018; Dada et al., 2018).            are generally shorter than those for the Värriö, Hyytiälä, and
Figure 8 shows the start and end times for the NPF events               Kumpula stations (Fig. 8 and Table 3). The possible reason
for different datasets. For the SPC dataset, the automatic              for this is that the atmospheric environment for the SPC sta-
method summarized the start times for events that occurred              tion is much more polluted compared to the three SMEAR
from 2002 to 2017, and the human-annotated results sum-                 stations in Finland, making the events last for shorter times.
marized the start times for events that occurred from 2011              The events in the Värriö and Hyytiälä stations have similar
to 2017. However, the histograms of the start times and end             median durations, followed by the Kumpula and SPC sta-
times determined by different methods show similar shapes               tions, possibly indicating that the atmospheric environment
(Fig. 8). Considering the end time of an event is difficult to          is less polluted in the Värriö and Hyytiälä stations than in
determine in some cases, the end time of the NPF event can-             the Kumpula station and most polluted in the SPC station.
not be identified as clearly as the start time.                         Another possible reason for this is that spring has the most
   Generally, the histograms of the start times for four                frequent events and all stations other than SPC are higher in
datasets are bell-shaped, which may be controlled by nor-               latitude and thus have longer sunlight hours during spring.
mal distributions (Fig. 8). The histograms of end times for                The median start times are almost the same for the
the SPC station also show the bell shape, but there is more             Hyytiälä and Kumpula stations (Table 3, in boldface), which
than one peak in the histograms of end times for the Värriö             is consistent with these two stations being located close to-
and Hyytiälä stations (Fig. 8). For NPF events that last for            gether and further verifies that the intensity of solar radiation
more than 1 d, interactions between particles in the 2 d lead           reaching the Earth’s surface seems to be the most important
to the end times being much more difficult to determine.                factor affecting whether an NPF event occurs or not (Kermi-
                                                                        nen et al., 2018).

https://doi.org/10.5194/acp-22-1293-2022                                                 Atmos. Chem. Phys., 22, 1293–1309, 2022
1302                                                     P. Su et al.: New particle formation event detection with Mask R-CNN

Figure 7. Comparison of growth rates calculated by different methods. GR-T means that growth rates are determined by the traditional
methods (manually selecting the start and end times when necessary), and GR-P means that growth rates are determined by the proposed
automatic method. r is the Pearson correlation coefficient between GRs calculated by different methods. The density scatterplots in the
bottom row show the ranges that the growth rates are usually located in.

3.4    Advantages, limitations, and future studies                    be used for datasets collected in different sites. For instance,
                                                                      the model trained on the masks from the Hyytiälä dataset
There are four major advantages of using the Mask R-CNN               works well on the SPC dataset. Fourth, the Mask R-CNN
model (or other instance segmentation models) to detect NPF           model is insensitive to the sizes and aspect ratios of the input
events. First, the process is simple, automatic, and straight-        NPF images since the model has already “seen” the related
forward. Second, the Mask R-CNN model can explicitly out-             image transformations during training. For practical usage,
put masks for banana-shaped events, making the calculation            we can plot the NPF images with the size of 256 × 256 or
of growth rates convenient together with the determination            128 × 128 pixels for NPF event detection.
of start and end times. Third, the Mask R-CNN model can

Atmos. Chem. Phys., 22, 1293–1309, 2022                                                 https://doi.org/10.5194/acp-22-1293-2022
P. Su et al.: New particle formation event detection with Mask R-CNN 1303
Figure 8. Start and end times for the NPF events for different stations. The times mentioned in the plots are local times.
For short-term (1- or 2-year) datasets, it is better to set The key to determining the correct start time and end time
the threshold as 0.00 for the objectiveness score to detect as and the GR for an event is that the detected mask can accu-
many NPF events as possible, while for long-term datasets, rately depict the spatial layout of an NPF event. Since the
a small threshold such as 0.20 or 0.40 will accelerate the de- Mask R-CNN model used in this study was only trained
tection and the statistical properties may not change if only a on 358 annotated masks, its generality may fail on some
few event days are not included. special observation stations. Thus, scientists need to re-train
As mentioned above, the Undef days are difficult to be the Mask R-CNN model on their special datasets. However,
classified with 100 % certainty. Some manually classified there is no need to manually annotate masks again since some
Undef days are recognized as event days by the Mask R- detected masks by our pre-trained model can be used as the
CNN model (Tables 1 and 2). These misclassified Undef days annotated masks for the re-training.
can be used as auxiliary information for scientists, in terms of
classifying days as the Undef type or not. On the other hand,
for scientists focusing on the comparison between event and 4 Conclusions
non-event types, manual work is still required to select the
Undef days out. In this case, the Mask R-CNN model can With an increasing number of global observation stations,
only be used as an auxiliary tool. automatic NPF detection methods are required to speed up
the NPF analysis process and minimize subjectivity caused
https://doi.org/10.5194/acp-22-1293-2022 Atmos. Chem. Phys., 22, 1293–1309, 20221304 P. Su et al.: New particle formation event detection with Mask R-CNN
Table 3. Summary of start times, end times, and duration times Appendix A: Object detection and instance
for the NPF events for the Värriö, Hyytiälä, Kumpula, and SPC segmentation
datasets. A 2 d unit was used for analysis. Hours more than 24 mean
the related times the next day. Similar median start times for the Object detection is one of the fundamental and challenging
Hyytiälä and Kumpula stations are in boldface. tasks in computer vision. Generally, some object detection
techniques focus on detecting different kinds of objects such
Värriö Hyytiälä Kumpula SPC as cats and cars, while others focus on specific scenarios such
Min 00:29 06:29 04:49 04:56 as face detection (Zou et al., 2019). With the development
Max 20:00 20:49 20:29 18:10 of deep learning, object detection achieves unprecedented
Start time
Mean 12:11 11:09 11:22 09:20 improvements. The techniques can be roughly divided into
Median 11:55 10:58 11:04 09:16 one-stage detection such as single-shot multi-box detectors
Min 10:30 11:39 09:30 12:25
(Liu et al., 2016) and two-stage detection such as Faster R-
Max 47:40 47:28 40:28 43:28 CNN (Ren et al., 2016). Usually, one-stage detection is much
End time faster, while two-stage detection can achieve better detection
Mean 28:57 28:01 24:15 19:38
Median 30:00 28:58 24:10 18:47 accuracy. Instance segmentation, however, tries to delineate
each distinct object of interest in a more precise manner. In
Min 02:30 03:50 02:20 02:50
other words, instance segmentation segments an object ac-
Max 37:30 37:10 29:18 33:10
Duration cording to its spatial layout. Compared with a bounding box,
Mean 16:46 16:52 12:53 10:18
Median 17:20 17:30 12:40 09:45 which needs four corner positions to cover an object, an in-
stance segmentation model needs to find all the pixels that
belong in the object.
by human-made analysis. To improve the automatic level of
NPF detection, we presented a method called Mask R-CNN Appendix B: Misclassified days in the Hyytiälä
for identifying the regional (banana-type) NPF events (espe- dataset
cially the strongest events), and the method can also be ap-
plied to determine the growth rates, start times, and end times Example surface plots for the NE, Undef, and BD days mis-
for events automatically. The method generalized well on dif- classified by the Mask R-CNN model are shown (Figs. B1,
ferent stations, and we tested the method on the SMEAR I, B2, and B3). Misclassified means that these days were clas-
II, and III (Värriö, Hyytiälä, and Kumpula, respectively) sta- sified as NE, Undef, and BD days by scientists, while the
tions in Finland as well as the SPC station in Italy. All to- Mask R-CNN model classified these days as event days. If
gether approximately 73 years of measurements for datasets the threshold for the objectiveness score is 0.90, then there
collected in the four stations was processed. are 18, 419, and 20 misclassified days for the NE, Undef, and
The proposed automatic method achieved the best classi- BD types, respectively. All the NE and BD days are shown in
fication results for Ia-type and Ib-type events for the SPC Figs. B1 and B3, but only the first 20 Undef days are shown
station without any annotated information, showing the po- in Fig. B2. These misclassified days can help readers under-
tential to apply the new method to other stations. The growth stand the detection capability of the Mask R-CNN model.
rates automatically determined by the new method are con-
sistent with the manually calculated growth rates. The start
times and end times determined by the new method illus-
trated that the start times may be controlled by normal dis-
tributions but the end times presented more than one peak in
their histograms for the Värriö and Hyytiälä stations.
In the future, the proposed method can be applied to
datasets collected in different stations and over different time
periods to produce comparable results, which will aid sci-
entists in understanding the underlying mechanisms of NPF
and assessing the impact of atmospheric aerosol particles on
the climate.
Atmos. Chem. Phys., 22, 1293–1309, 2022 https://doi.org/10.5194/acp-22-1293-2022P. Su et al.: New particle formation event detection with Mask R-CNN 1305 Figure B1. Misclassified NE days detected by Mask R-CNN in the Hyytiälä dataset (the threshold for the objectiveness score is 0.90). Figure B2. Misclassified Undef days detected by Mask R-CNN in the Hyytiälä dataset (the threshold for the objectiveness score is 0.90). https://doi.org/10.5194/acp-22-1293-2022 Atmos. Chem. Phys., 22, 1293–1309, 2022
1306                                                           P. Su et al.: New particle formation event detection with Mask R-CNN

Figure B3. Misclassified BD days detected by Mask R-CNN in the Hyytiälä dataset (the threshold for the objectiveness score is 0.90).

Code and data availability. Code is available at https://github.          Financial support. This research has been supported by Business
com/cvvsu/maskNPF.git (Su et al., 2022). Datasets collected in            Finland (grant no. UIA03-240) and the Academy of Finland (grant
the three SMEAR stations are available at https://smear.avaa.csc.fi/      nos. 337549, 302958, 311932).
(Junninen et al., 2009). The dataset collected in the San Pietro
Capofiume station is available from Jorma Joutsensaari on request         Open-access funding was provided by the Helsinki
(Joutsensaari et al., 2018).                                              University Library.

Author contributions. PS, JJ, LD, MA, XL, YW, TP, and PP                  Review statement. This paper was edited by Manish Shrivastava
planned the study. PS, JJ, LD, MZ, TN, XL, YW, and SD analyzed            and reviewed by two anonymous referees.
the data and wrote the code and manuscript draft; all authors re-
viewed and edited the manuscript.

                                                                          References
Competing interests. The contact author has declared that nei-
ther they nor their co-authors have any competing interests.              Aalto, P., Hämeri, K., Becker, E., Weber, R., Salm, J., Mäkelä,
                                                                            J., Hoell, C., O’Dowd, C., Karlsson, H., Hansson, H.-C.,
                                                                            Väkevä, M., Koponen, I., Buzorius, G., and Kulmala, M.:
                                                                            Physical characterization of aerosol particles during nucleation
Disclaimer. Publisher’s note: Copernicus Publications remains
                                                                            events, Tellus B, 53, 344–358, https://doi.org/10.1034/j.1600-
neutral with regard to jurisdictional claims in published maps and
                                                                            0889.2001.530403.x, 2001.
institutional affiliations.
                                                                          Asmi, A., Wiedensohler, A., Laj, P., Fjaeraa, A.-M., Sellegri, K.,
                                                                            Birmili, W., Weingartner, E., Baltensperger, U., Zdimal, V.,
                                                                            Zikova, N., Putaud, J.-P., Marinoni, A., Tunved, P., Hansson, H.-
Acknowledgements. The authors wish to acknowledge CSC –                     C., Fiebig, M., Kivekäs, N., Lihavainen, H., Asmi, E., Ulevicius,
IT Center for Science, Finland, for computational resources. The            V., Aalto, P. P., Swietlicki, E., Kristensson, A., Mihalopoulos,
authors would like to thank Leone Tarozzi for his technical support         N., Kalivitis, N., Kalapov, I., Kiss, G., de Leeuw, G., Henzing,
in field operations of the DMPS in SPC.                                     B., Harrison, R. M., Beddows, D., O’Dowd, C., Jennings, S. G.,
                                                                            Flentje, H., Weinhold, K., Meinhardt, F., Ries, L., and Kulmala,
                                                                            M.: Number size distributions and seasonality of submicron par-

Atmos. Chem. Phys., 22, 1293–1309, 2022                                                     https://doi.org/10.5194/acp-22-1293-2022
P. Su et al.: New particle formation event detection with Mask R-CNN 1307 ticles in Europe 2008–2009, Atmos. Chem. Phys., 11, 5505– chini, M. C., Decesari, S., Mircea, M., Lehtinen, K. E. J., 5538, https://doi.org/10.5194/acp-11-5505-2011, 2011a. and Laaksonen, A.: Nucleation and growth of new parti- Asmi, E., Kivekäs, N., Kerminen, V.-M., Komppula, M., Hyvärinen, cles in Po Valley, Italy, Atmos. Chem. Phys., 7, 355–376, A.-P., Hatakka, J., Viisanen, Y., and Lihavainen, H.: Secondary https://doi.org/10.5194/acp-7-355-2007, 2007. new particle formation in Northern Finland Pallas site between Hari, P. and Kulmala, M.: Station for Measuring Ecosystem- the years 2000 and 2010, Atmos. Chem. Phys., 11, 12959–12972, Atmosphere Relations (SMEAR II), Boreal Environ. Res., 10, https://doi.org/10.5194/acp-11-12959-2011, 2011b. 315–322, 2005. Choi, S., Kim, T., and Yu, W.: Performance Evaluation of RANSAC Hari, P., Nikinmaa, E., Pohja, T., Siivola, E., Bäck, J., Vesala, T., Family, in: Proceedings of the British Machine Vision Confer- and Kulmala, M.: Station for measuring ecosystem-atmosphere ence, BMVA Press, 81.1–81.12, https://doi.org/10.5244/C.23.81, relations: SMEAR, in: Physical and physiological forest ecol- 2009. ogy, Springer, 471–487, https://doi.org/10.1007/978-94-007- Chu, B., Kerminen, V.-M., Bianchi, F., Yan, C., Petäjä, T., and Kul- 5603-8_9, 2013. mala, M.: Atmospheric new particle formation in China, Atmos. Hari, P., Aalto, P., Hämeri, K., Kulmala, M., Lahti, T., Lu- Chem. Phys., 19, 115–138, https://doi.org/10.5194/acp-19-115- oma, S., Palva, L., Pohja, T., Pulliainen, E., Siivola, E., and 2019, 2019. Vesala, T.: Air pollution in eastern Lapland: challenge for Dada, L., Paasonen, P., Nieminen, T., Mazon, S., Kontkanen, J., an environmental measurement station, Silva Fenn., 28, 5526, Peräkylä, O., Lehtipalo, K., Hussein, T., Petäjä, T., Kerminen, https://doi.org/10.14214/sf.a9160, 1994. V.-M., Bäck, J., and Kulmala, M.: Long-term analysis of clear- He, K., Zhang, X., Ren, S., and Sun, J.: Deep residual learning for sky new particle formation events and nonevents in Hyytiälä, At- image recognition, in: IEEE Conference on Computer Vision and mos. Chem. Phys., 17, 6227–6241, https://doi.org/10.5194/acp- Pattern Recognition (CVPR), 27–30 June 2016, Las Vegas, NV, 17-6227-2017, 2017. USA, 770–778, https://doi.org/10.1109/CVPR.2016.90, 2016a. Dada, L., Chellapermal, R., Buenrostro Mazon, S., Paasonen, He, K., Zhang, X., Ren, S., and Sun, J.: Identity mappings in deep P., Lampilahti, J., Manninen, H. E., Junninen, H., Petäjä, residual networks, in: European Conference on Computer Vision T., Kerminen, V.-M., and Kulmala, M.: Refined classifica- (ECCV), Springer, 14th European Conference, Amsterdam, The tion and characterization of atmospheric new-particle formation Netherlands, October 11–14, 2016, Proceedings, Part IV, 630– events using air ions, Atmos. Chem. Phys., 18, 17883–17893, 645, https://doi.org/10.1007/978-3-319-46493-0_38, 2016b. https://doi.org/10.5194/acp-18-17883-2018, 2018. He, K., Gkioxari, G., Dollár, P., and Girshick, R.: Mask R- Dada, L., Lehtipalo, K., Kontkanen, J., Nieminen, T., Baalbaki, CNN, in: IEEE International Conference on Computer Vi- R., Ahonen, L., Duplissy, J., Yan, C., Chu, B., Petäjä, T., sion (ICCV), 22–29 October 2017, Venice, Italy, 2961–2969, Lehtinen, K., Kerminen, V.-M., Kulmala, M., and Kangaslu- https://doi.org/10.1109/ICCV.2017.322, 2017. oma, J.: Formation and growth of sub-3-nm aerosol parti- Hirsikko, A., Kulmala, M., Laakso, L., Horrak, U., Kerminen, V.- cles in experimental chambers, Nat. Protoc., 15, 1013–1040, M., and Aalto, P.: Annual and size dependent variation of growth https://doi.org/10.1038/s41596-019-0274-z, 2020a. rates and ion concentrations in boreal forest, Boreal Environ. Dada, L., Ylivinkka, I., Baalbaki, R., Li, C., Guo, Y., Yan, C., Yao, Res., 10, 357–369, 2005. L., Sarnela, N., Jokinen, T., Dällenbach, K., Yin, R., Deng, C., Hirsikko, A., Nieminen, T., Gagné, S., Lehtipalo, K., Manninen, Chu, B., Nieminen, T., Wang, Y., Lin, Z., Thakur, R., Kontkanen, H. E., Ehn, M., Hõrrak, U., Kerminen, V.-M., Laakso, L., Mc- J., Stolzenburg, D., Sipila, M., Hussein, T., Paasonen, P., Bianchi, Murry, P. H., Mirme, A., Mirme, S., Petäjä, T., Tammet, H., F., Salma, I., Weidinger, T., Pikridas, M., Sciare, J., Jiang, J., Vakkari, V., Vana, M., and Kulmala, M.: Atmospheric ions and Liu, Y., Petaja, T., Kerminen, V.-M., and Kulmala, M.: Sources nucleation: a review of observations, Atmos. Chem. Phys., 11, and sinks driving sulfuric acid concentrations in contrasting en- 767–798, https://doi.org/10.5194/acp-11-767-2011, 2011. vironments: implications on proxy calculations, Atmos. Chem. Järvi, L., Hannuniemi, H., Hussein, T., Junninen, H., Aalto, P., Phys., 20, 11747–11766, https://doi.org/10.5194/acp-20-11747- Hillamo, R., Mäkelä, T., Keronen, P., Siivola, E., Vesala, T., and 2020, 2020b. Kulmala, M.: The urban measurement station SMEAR III: con- Dal Maso, M., Kulmala, M., Riipinen, I., Wagner, R., Hussein, T., tinuous monitoring of air pollution and surface-atmosphere inter- Aalto, P., and Lehtinen, K.: Formation and growth of fresh at- actions in Helsinki, Finland, Boreal Environ. Res., 14, 86–109, mospheric aerosols: eight years of aerosol size distribution data 2009. from SMEAR II, Hyytiälä, Finland, Boreal Environ. Res., 10, Joutsensaari, J., Ozon, M., Nieminen, T., Mikkonen, S., Lähivaara, 323–336, 2005. T., Decesari, S., Facchini, M. C., Laaksonen, A., and Lehti- Girshick, R.: Fast R-CNN, in: Proceedings of the IEEE In- nen, K. E.: Identification of new particle formation events ternational Conference on Computer Vision (ICCV), with deep learning, Atmos. Chem. Phys., 18, 9597–9615, IEEE, 7–13 December 2015, Santiago, Chile, 1440–1448, https://doi.org/10.5194/acp-18-9597-2018, 2018. https://doi.org/10.1109/ICCV.2015.169, 2015. Junninen, H., Lauri, A., Keronen, P., Aalto, P., Hiltunen, V., Hari, P., Girshick, R., Donahue, J., Darrell, T., and Malik, J.: Rich Feature and Kulmala, M.: Smart-SMEAR: on-line data exploration and Hierarchies for Accurate Object Detection and Semantic Seg- visualization tool for SMEAR stations, Boreal Environ. Res., 14, mentation, in: IEEE Conference on Computer Vision and Pattern 447–457, 2009. Recognition (CVPR), IEEE, 23–28 June 2014, Columbus, OH, Kerminen, V.-M., Chen, X., Vakkari, V., Petäjä, T., Kulmala, M., USA, 580–587, https://doi.org/10.1109/CVPR.2014.81, 2014. and Bianchi, F.: Atmospheric new particle formation and growth: Hamed, A., Joutsensaari, J., Mikkonen, S., Sogacheva, L., review of field observations, Environ. Res. Lett., 13, 103003, Dal Maso, M., Kulmala, M., Cavalli, F., Fuzzi, S., Fac- https://doi.org/10.1088/1748-9326/aadf3c, 2018. https://doi.org/10.5194/acp-22-1293-2022 Atmos. Chem. Phys., 22, 1293–1309, 2022
1308                                                          P. Su et al.: New particle formation event detection with Mask R-CNN

Kuang, C., Riipinen, I., Sihto, S.-L., Kulmala, M., McCormick,             and Kulmala, M.: Continuous and comprehensive atmospheric
  A., and McMurry, P.: An improved criterion for new par-                  observations in Beijing: a station to understand the complex
  ticle formation in diverse atmospheric environments, Atmos.              urban atmospheric environment, Big Earth Data, 4, 295–321,
  Chem. Phys., 10, 8469–8480, https://doi.org/10.5194/acp-10-              https://doi.org/10.1080/20964471.2020.1798707, 2020.
  8469-2010, 2010.                                                       Mäkelä, J. M., Maso, M. D., Pirjola, L., Keronen, P., Laakso, L.,
Kulmala, M.: Build a global Earth observatory, Nature, 553, 21–23,         Kulmala, M., and Laaksonen, A.: Characteristics of the atmo-
  https://doi.org/10.1038/d41586-017-08967-y, 2018.                        spheric particle formation events observed at a borel forest site
Kulmala, M., Vehkamäki, H., Petäjä, T., Dal Maso, M., Lauri,               in southern Finland, Boreal Environ. Res., 5, 299–313, 2000.
  A., Kerminen, V.-M., Birmili, W., and McMurry, P.: For-                Nanni, L., Ghidoni, S., and Brahnam, S.: Hand-
  mation and growth rates of ultrafine atmospheric particles:              crafted vs. non-handcrafted features for computer vi-
  a review of observations, J. Aerosol Sci., 35, 143–176,                  sion classification, Pattern Recognit., 71, 158–172,
  https://doi.org/10.1016/j.jaerosci.2003.10.003, 2004.                    https://doi.org/10.1016/j.patcog.2017.05.025, 2017.
Kulmala, M., Petäjä, T., Mönkkönen, P., Koponen, I. K., Maso,            Nieminen, T., Yli-Juuti, T., Manninen, H., Petäjä, T., Kermi-
  M. D., Aalto, P. P., Lehtinen, K., and Kerminen, V.-M.: On the           nen, V.-M., and Kulmala, M.: New particle formation event
  growth of nucleation mode particles: source rates of condensable         forecasts during PEGASOS–Zeppelin Northern mission 2013
  vapor in polluted and clean environments, Atmos. Chem. Phys.,            in Hyytiälä, Finland, Atmos. Chem. Phys., 15, 12385–12396,
  5, 409–416, https://doi.org/10.5194/acp-5-409-2005, 2005.                https://doi.org/10.5194/acp-15-12385-2015, 2015.
Kulmala, M., Petaja, T., Nieminen, T., Sipila, M., Manni-                Nieminen, T., Kerminen, V.-M., Petäjä, T., Aalto, P. P., Arshinov,
  nen, H., Lehtipalo, K., Dal Maso, M., Aalto, P., Junni-                  M., Asmi, E., Baltensperger, U., Beddows, D. C. S., Beukes, J.
  nen, H., Paasonen, P., Riipinen, I., Lehtinen, K., Laakso-               P., Collins, D., Ding, A., Harrison, R. M., Henzing, B., Hooda,
  nen, A., and Kerminen, V.-M.: Measurement of the nucleation              R., Hu, M., Hõrrak, U., Kivekäs, N., Komsaare, K., Krejci, R.,
  of atmospheric aerosol particles, Nat. Protoc., 7, 1651–1667,            Kristensson, A., Laakso, L., Laaksonen, A., Leaitch, W. R., Li-
  https://doi.org/10.1038/nprot.2012.091, 2012.                            havainen, H., Mihalopoulos, N., Németh, Z., Nie, W., O’Dowd,
Kyrö, E.-M., Väänänen, R., Kerminen, V.-M., Virkkula, A.,                  C., Salma, I., Sellegri, K., Svenningsson, B., Swietlicki, E.,
  Petäjä, T., Asmi, A., Dal Maso, M., Nieminen, T., Juhola, S.,            Tunved, P., Ulevicius, V., Vakkari, V., Vana, M., Wiedensohler,
  Shcherbinin, A., Riipinen, I., Lehtipalo, K., Keronen, P., Aalto,        A., Wu, Z., Virtanen, A., and Kulmala, M.: Global analysis of
  P. P., Hari, P., and Kulmala, M.: Trends in new particle forma-          continental boundary layer new particle formation based on long-
  tion in eastern Lapland, Finland: effect of decreasing sulfur emis-      term measurements, Atmos. Chem. Phys., 18, 14737–14756,
  sions from Kola Peninsula, Atmos. Chem. Phys., 14, 4383–4396,            https://doi.org/10.5194/acp-18-14737-2018, 2018.
  https://doi.org/10.5194/acp-14-4383-2014, 2014.                        Ren, S., He, K., Girshick, R., and Sun, J.: Faster R-CNN: to-
Lee, S.-H., Gordon, H., Yu, H., Lehtipalo, K., Haley, R., Li, Y.,          wards real-time object detection with region proposal net-
  and Zhang, R.: New particle formation in the atmosphere: From            works, IEEE Trans. Pattern Anal. Mach. Intell., 39, 1137–1149,
  molecular clusters to global climate, J. Geophys. Res.-Atmos.,           https://doi.org/10.1109/TPAMI.2016.2577031, 2016.
  124, 7098–7146, https://doi.org/10.1029/2018JD029356, 2019.            Russell, B. C., Torralba, A., Murphy, K. P., and Freeman, W. T.: La-
Lin, T.-Y., Maire, M., Belongie, S., Hays, J., Perona, P., Ra-             belMe: a database and web-based tool for image annotation, Int.
  manan, D., Dollár, P., and Zitnick, C. L.: Microsoft coco: Com-          J. Comput. Vis., 77, 157–173, https://doi.org/10.1007/s11263-
  mon objects in context, in: European Conference on Computer              007-0090-8, 2008.
  Vision (ECCV), Springer, 13th European Conference, Zurich,             Su, P., Joutsensaari, J., Dada, L., Zaidan, M. A., Nieminen, T., Li,
  Switzerland, September 6-12, 2014, Proceedings, Part V, 740–             X., Wu, Y., Decesari, S., Tarkoma, S., Petäjä, T., Kulmala, M.,
  755, https://doi.org/10.1007/978-3-319-10602-1_48, 2014.                 and Pellikka, P.: maskNPF, GitHub [code], available at: https:
Lin, T.-Y., Dollár, P., Girshick, R., He, K., Hariharan, B., and Be-       //github.com/cvvsu/maskNPF.git, last access: 20 January 2022.
  longie, S.: Feature pyramid networks for object detection, in:         Vana, M., Komsaare, K., Hõrrak, U., Mirme, S., Nieminen, T., Kon-
  IEEE Conference on Computer Vision and Pattern Recogni-                  tkanen, J., Manninen, H. E., Petäjä, T., Noe, S. M., and Kulmala,
  tion (CVPR), 21–26 July 2017, Honolulu, HI, USA, 2117–2125,              M.: Characteristics of new-particle formation at three SMEAR
  https://doi.org/10.1109/CVPR.2017.106, 2017.                             stations, Boreal Environ. Res., 21, 345–362, 2016.
Liu, W., Anguelov, D., Erhan, D., Szegedy, C., Reed, S., Fu,             Wiedensohler, A., Birmili, W., Nowak, A., Sonntag, A., Weinhold,
  C.-Y., and Berg, A. C.: SSD: Single shot multibox detec-                 K., Merkel, M., Wehner, B., Tuch, T., Pfeifer, S., Fiebig, M.,
  tor, in: European Conference on Computer Vision (ECCV),                  Fjäraa, A. M., Asmi, E., Sellegri, K., Depuy, R., Venzac, H., Vil-
  Springer, 14th European Conference, Amsterdam, The Nether-               lani, P., Laj, P., Aalto, P., Ogren, J. A., Swietlicki, E., Williams,
  lands, 11–14 October 2016, Proceedings, Part I, 21–37,                   P., Roldin, P., Quincey, P., Hüglin, C., Fierz-Schmidhauser, R.,
  https://doi.org/10.1007/978-3-319-46448-0_2, 2016.                       Gysel, M., Weingartner, E., Riccobono, F., Santos, S., Grün-
Liu, Y., Yan, C., Feng, Z., Zheng, F., Fan, X., Zhang, Y., Li, C.,         ing, C., Faloon, K., Beddows, D., Harrison, R., Monahan, C.,
  Zhou, Y., Lin, Z., Guo, Y., Zhang, Y., Ma, L., Zhou, W., Liu,            Jennings, S. G., O’Dowd, C. D., Marinoni, A., Horn, H.-G.,
  Z., Dada, L., Dällenbach, K., Kontkanen, J., Cai, R., Chan, T.,          Keck, L., Jiang, J., Scheckman, J., McMurry, P. H., Deng, Z.,
  Chu, B., Du, W., Yao, L., Wang, Y., Cai, J., Kangasluoma, J.,            Zhao, C. S., Moerman, M., Henzing, B., de Leeuw, G., Löschau,
  Kokkonen, T., Kujansuu, J., Rusanen, A., Deng, C., Fu, Y., Yin,          G., and Bastian, S.: Mobility particle size spectrometers: har-
  R., Li, X., Lu, Y., Liu, Y., Lian, C., Yang, D., Wang, W., Ge,           monization of technical standards and data structure to facili-
  M., Wang, Y., Worsnop, D. R., Junninen, H., He, H., Kermi-               tate high quality long-term observations of atmospheric parti-
  nen, V.-M., Zheng, J., Wang, L., Jiang, J., Petäjä, T., Bianchi, F.,

Atmos. Chem. Phys., 22, 1293–1309, 2022                                                     https://doi.org/10.5194/acp-22-1293-2022
You can also read