Improved representation of plant physiology in the JULES-vn5.6 land surface model: photosynthesis, stomatal conductance and thermal acclimation
←
→
Page content transcription
If your browser does not render page correctly, please read the page content below
Development and technical paper
Geosci. Model Dev., 15, 5567–5592, 2022
https://doi.org/10.5194/gmd-15-5567-2022
© Author(s) 2022. This work is distributed under
the Creative Commons Attribution 4.0 License.

Improved representation of plant physiology in the
JULES-vn5.6 land surface model: photosynthesis,
stomatal conductance and thermal acclimation
Rebecca J. Oliver1 , Lina M. Mercado1,2 , Doug B. Clark1 , Chris Huntingford1 , Christopher M. Taylor1,5 ,
Pier Luigi Vidale3 , Patrick C. McGuire3 , Markus Todt3 , Sonja Folwell1 , Valiyaveetil Shamsudheen Semeena1 , and
Belinda E. Medlyn4
1 UK  Centre for Ecology and Hydrology, Wallingford, OX10 8BB, UK
2 College of Life and Environmental Sciences, University of Exeter, Exeter, EX4 4RJ, UK
3 Department of Meteorology and National Centre for Atmospheric Science, Reading University, Reading, RG6 6BB, UK
4 Hawkesbury Institute for the Environment, Western Sydney University, Sydney, New South Wales, Australia
5 National Centre for Earth Observation, Wallingford, OX10 8BB, UK

Correspondence: Rebecca J. Oliver (rfu@ceh.ac.uk)

Received: 12 January 2022 – Discussion started: 14 March 2022
Revised: 1 July 2022 – Accepted: 1 July 2022 – Published: 20 July 2022

Abstract. Carbon and water cycle dynamics of vegetation         with an associated increase in sensible heat flux) across re-
are controlled primarily by photosynthesis and stomatal con-    gions dominated by needleleaf evergreen forest in the North-
ductance (gs ). Our goal is to improve the representation of    ern Hemisphere summer. Thermal acclimation of photosyn-
these key physiological processes within the JULES land sur-    thesis coupled with the Medlyn gs scheme reduced tropical
face model, with a particular focus on refining the tempera-    forest GPP by up to 5 % and increased GPP in the high-
ture sensitivity of photosynthesis, impacting modelled car-     northern-latitude forests by between 2 % and 5 %. Evaluation
bon, energy and water fluxes. We test (1) an implementa-        of simulated carbon and water fluxes by each model config-
tion of the Farquhar et al. (1980) photosynthesis scheme and    uration against global data products shows this latter con-
associated plant functional type-dependent photosynthetic       figuration generates improvements in these key areas. Ther-
temperature response functions, (2) the optimality-based gs     mal acclimation of photosynthesis coupled with the Medlyn
scheme from Medlyn et al. (2011) and (3) the Kattge and         gs scheme improved modelled carbon fluxes in tropical and
Knorr (2007) photosynthetic capacity thermal acclimation        high-northern-latitude forests in JJA and improved the sim-
scheme. New parameters for each model configuration are         ulation of evapotranspiration across much of the Northern
adopted from recent large observational datasets that synthe-   Hemisphere in JJA. Having established good model perfor-
sise global experimental data. These developments to JULES      mance for the contemporary period, we force this new ver-
incorporate current physiological understanding of vegeta-      sion of JULES offline with a future climate scenario cor-
tion behaviour into the model and enable users to derive di-    responding to rising atmospheric greenhouse gases (Shared
rect links between model parameters and ongoing measure-        Socioeconomic Pathway (SSP5), Representative Concentra-
ment campaigns that refine such parameter values. Replace-      tion Pathway 8.5 (RCP8.5)). In particular, these calculations
ment of the original Collatz et al. (1991) C3 photosynthesis    allow for understanding of the effects of long-term warm-
model with the Farquhar scheme results in large changes in      ing. We find that the impact of thermal acclimation coupled
GPP for the current day, with ∼ 10 % reduction in seasonal      with the optimality-based gs model on simulated fluxes in-
(June–August, JJA, and December–February, DJF) mean             creases latent heat flux (+50 %) by the year 2050 compared
GPP in tropical forests and ∼ 20 % increase in the northern     to the JULES model configuration without acclimation. This
high-latitude forests in JJA. The optimality-based gs model     new JULES configuration also projects increased GPP across
decreases the latent heat flux for the present day (∼ 10 %,     tropical (+10 %) and northern-latitude regions (+30 %) by

Published by Copernicus Publications on behalf of the European Geosciences Union.

5568                   R. J. Oliver et al.: Photosynthesis, stomatal conductance and thermal acclimation in JULES-vn5.6

2050. We conclude that thermal acclimation of photosyn-              paramount importance. Booth et al. (2012) show that a sig-
thesis with the Farquhar photosynthesis scheme and the new           nificant uncertainty is the temperature sensitivity of photo-
optimality-based gs scheme together improve the simulation           synthesis and suggest that thermal acclimation of photosyn-
of carbon and water fluxes for the current day and have a            thesis – where plants adjust their optimum temperature for
large impact on modelled future carbon cycle dynamics in a           photosynthesis to growth conditions experienced over the
warming world.                                                       timescale of days to weeks – might reduce the spread in
                                                                     modelled carbon exchange. Yet despite strong evidence of
                                                                     the thermal acclimation capability of plant photosynthesis
                                                                     (Dusenge et al., 2020; Slot et al., 2021; Way et al., 2017; Way
1   Introduction                                                     and Yamori, 2014; Yamaguchi et al., 2016), incorporation of
                                                                     this process in large-scale LSMs is limited to only a few, for
Photosynthesis and stomatal conductance (gs ) together ex-           example, TEM (Chen and Zhuang, 2013), CLM4.5 (Lombar-
ert a strong control over the exchange of carbon, water and          dozzi et al., 2015), LM3 (Smith et al., 2016), JULES (Mer-
energy between the land surface and the atmosphere. The              cado et al., 2018), ORCHIDEE (Krinner et al., 2005) and
behaviour of stomatal pores on the leaf surface link these           BETHY (Ziehn et al., 2011), and is not yet commonly repre-
processes, controlling the amount of carbon dioxide (CO2 )           sented in ESMs. Currently, the majority of LSMs and ESMs
entering and water leaving each leaf. Photosynthesis repre-          use simple fixed (i.e. non-acclimating) temperature response
sents the largest exchange of carbon between the land and            functions for photosynthetic capacity parameters (Smith and
atmosphere (Friedlingstein et al., 2020), being more substan-        Dukes, 2013), which, in general, cause the rate of leaf pho-
tial than respiration loss. This imbalance is central to the         tosynthesis to increase with temperature to an optimum and
global carbon cycle because it slows the rate of accumula-           then decrease under higher temperatures. These functional
tion of CO2 in the atmosphere caused by fossil fuel burning          forms are either generic for all C3 and C4 species and fixed in
and therefore also lowers the rate of atmospheric temperature        time and space or are dependent on a small number of plant
increase. As stomata open to take up CO2 for photosynthe-            functional types (PFTs) but again fixed in time and space.
sis, plants also lose water through transpiration, and this flux     Consequently, climate–carbon feedbacks in ESMs are sen-
has been estimated to account for 60 %–80 % of evapotran-            sitive to the assumed value of the fixed optimum tempera-
spiration (ET) across the land surface (Jasechko et al., 2013;       ture for photosynthetic capacity (Topt ) because the amount of
Schlesinger and Jasechko, 2014). Hence, for vegetated sur-           carbon assimilated depends on whether leaf temperature is
faces, transpiration is the primary driver of the latent heat flux   dominantly above or below Topt . Improved process represen-
(LE), the latter describing the overall transfer of water vapour     tation of gs , photosynthesis and its temperature sensitivity in
to the atmosphere. The partitioning of available net radiation       LSMs is necessary to support robust predictions of global cli-
between LE and sensible heat (H ) is also a key determinant          mate change via their coupling into ESMs. Modelling studies
of land surface temperature, therefore having a feedback on          have shown how photosynthesis and gs impact climate feed-
photosynthesis and other key metabolic processes that influ-         backs, play a critical role in how climate will change, and
ence the global carbon cycle such as plant respiration.              strongly influence climate-induced impacts such as water re-
   Land surface models (LSMs) simulate the exchange of               sources (Betts et al., 2007; Cruz et al., 2010; De Arellano et
carbon, water and energy between the land surface and the            al., 2012; Gedney et al., 2006; Kooperman et al., 2018; Zeng
atmosphere, providing the lower boundary conditions for              et al., 2017).
the atmospheric component of Earth system models (ESMs)                 This study, therefore, updates the plant physiology rou-
when run in a coupled configuration. ESM projections form            tines in the Joint UK Land Surface Environment Simulator
the main tool to predict future climate change and under-            (JULES-vn5.6) LSM, the land surface component of the UK
pin much of the regular United Nations Intergovernmental             Hadley Centre ESM (Sellar et al., 2019). To date, JULES
Panel on Climate Change (IPCC) reports that inform policy-           has employed the mechanistic C3 photosynthesis scheme of
makers. However, ESM predictions of the global carbon sink           Collatz et al. (1991) (“Collatz”). However, the Farquhar et
are fraught with large uncertainties surrounding projections         al. (1980) (“Farquhar”) scheme is more generally adopted by
of future carbon uptake (Friedlingstein et al., 2014), caus-         those modelling photosynthetic response and by researchers
ing uncertainty in any translation from CO2 emissions to at-         analysing data from empirical studies. The Farquhar scheme
mospheric CO2 trajectory. A lack of knowledge in how the             has been recently implemented in JULES by Mercado et
global carbon cycle operates creates uncertainties in trans-         al. (2018) for C3 plant types, though a big leaf canopy scal-
lating from emissions to global warming, and these uncer-            ing approach was used, and it was not parameterised and
tainties are a sizeable fraction of those associated with un-        evaluated for global applications. Here we build on that
knowns of physical climate processes (Huntingford et al.,            previous study by using a data-driven approach incorporat-
2009). Therefore, given the critical role of both photosynthe-       ing data from multiple biomes to parameterise the Farquhar
sis and gs in determining land–atmosphere exchanges, their           model photosynthetic capacity parameters and their tempera-
accurate representation and parameterisation in LSMs are of          ture sensitivity so it is amenable for use in global studies. Our

Geosci. Model Dev., 15, 5567–5592, 2022                                               https://doi.org/10.5194/gmd-15-5567-2022
R. J. Oliver et al.: Photosynthesis, stomatal conductance and thermal acclimation in JULES-vn5.6                             5569

specific rationale for including the Farquhar photosynthesis      cobs (1994) gs scheme (“Jacobs”), and in this study we com-
scheme is twofold. Firstly, studies by Rogers et al. (2017)       pare the behaviour of this scheme against the Medlyn et
and Walker et al. (2021) demonstrate that despite only the        al. (2011) gs scheme (“Medlyn”), which is based on opti-
Collatz or Farquhar descriptions of leaf photosynthesis be-       misation theory. The Medlyn gs model has been previously
ing in general use, simulated photosynthesis varies signif-       implemented in JULES by Oliver et al. (2018). However, in
icantly between LSMs. This variation is attributed to sev-        this study, we advance on that previous work by calibrating
eral factors, including (1) differences in prescribed Rubisco     for the increased number of plant functional types now in
kinetic constants and their temperature responses (Rogers         JULES (nine PFTs, as opposed to five in the original study),
et al., 2017), (2) structural differences, namely the method      and we parameterise using data from a global synthesis of
used to determine the transition point between the limit-         experimental observations.
ing rates of photosynthesis which has a disproportionate im-         There is increasing evidence that the short-term vegetation
pact on estimates (Huntingford and Oliver, 2021; Walker et        temperature responses are themselves sensitive to tempera-
al., 2021), and (3) the sensitivity of photosynthesis to tem-     tures experienced over longer timescales (days to weeks to
perature, in terms of the under-representation of parameters      seasons) and, in particular, have the capability to acclimate
from different biomes to describe the short-term instanta-        to growth temperature (Tgrowth ) (Kattge and Knorr, 2007).
neous response of photosynthesis to temperature (Rogers et        Observational evidence of thermal acclimation of photosyn-
al., 2017). In particular, these differences imply that parame-   thesis has been widely reported, primarily for temperate and
ter values derived calibrating the Collatz model against data     boreal ecosystems (Atkin et al., 2006; Gunderson et al., 2000,
will differ to those derived using Farquhar against the same      2010; Hikosaka et al., 2007; Way and Yamori, 2014; Yamori
set of measurements. Parameter values are not transferable        et al., 2014). The effect is defined as the fast temporal adjust-
between models; hence such differences will lead to incon-        ment of the temperature response of photosynthesis driven
sistencies and projection errors if parameters are fitted to      by a change in Tgrowth . Thermal acclimation of photosyn-
data but then applied within the alternative model. Building      thesis typically results in a shift in the optimum tempera-
in the capacity of an LSM to run with either photosynthe-         ture (Topt ) for photosynthesis towards the new growth tem-
sis scheme greatly enhances flexibility in modelling. Impor-      perature, which can result in an increase or maintenance of
tantly, this flexibility allows for consistency between param-    the photosynthetic rate respective to Tgrowth (Yamori et al.,
eters used by empiricists to derive leaf-level photosynthetic     2014). In this study, we implement thermal acclimation of
parameters from observations and those used in large-scale        photosynthetic capacity in JULES using the scheme from
modelling. Additionally, our re-parameterisation of the pho-      Kattge and Knorr (2007). The scheme attributes all changes
tosynthetic capacity and temperature sensitivity parameters       in the photosynthetic response to changing Tgrowth , with-
is based on recent global datasets that are more extensive, in-   out specifically separating adaptation from acclimation pro-
cluding species from a range of different biomes, further en-     cesses. Of those LSMs that do account for thermal acclima-
hancing the capacity for global modelling applications. Our       tion of photosynthesis (e.g. TEM, CLM4.5, LM3, JULES)
second rationale is that the Farquhar photosynthesis scheme       (Chen and Zhuang, 2013; Lombardozzi et al., 2015; Mer-
is required as the underlying model to implement the Kattge       cado et al., 2018; Smith et al., 2016), all similarly use this
and Knorr (2007) thermal acclimation scheme.                      numerical algorithm from Kattge and Knorr (2007). Mercado
   Leaf-level gs response to water vapour is commonly rep-        et al. (2018) investigated the impacts of thermal acclimation
resented in LSMs empirically (Jarvis et al., 1976) or with a      on the future land carbon sink using an implementation of
semi-empirical model (Ball et al., 1987; Damour et al., 2010;     the Kattge and Knorr (2007) in JULES though using a sim-
Leuning, 1995). Values of gs are subsequently scaled, yield-      ple big leaf scaling approach. In this study we apply the ther-
ing an estimate of canopy conductance for vegetation in dif-      mal acclimation scheme in the updated JULES model (i.e.
ferent ecosystems. De Kauwe et al. (2013) showed that 10          newly parameterised Farquhar scheme, running with a multi-
of the 11 ecosystem models studied in their inter-comparison      layer canopy and nine PFTs) and updated with the Medlyn gs
used a form of the Ball–Berry–Leuning approximation. This         scheme and related parameters.
model form links gs to changes in environmental conditions           This paper therefore brings together these three key re-
and directly to photosynthetic rate. However, there is increas-   cent developments of the JULES plant physiology routines,
ing interest in using models based on optimisation theory         (1) implementation of the Farquhar photosynthesis scheme,
(Franks et al., 2017, 2018), using evidence that stomata may      (2) the optimisation-based Medlyn model of stomatal open-
behave to maximise CO2 gain whilst minimising water loss.         ing and (3) thermal acclimation of photosynthesis, along with
The major advantage of optimality theory is that the opti-        updated parameters and an evaluation of model behaviour.
misation criterion will apply under any environmental con-        We make incremental additions of the different processes to
ditions, past or future. Hence the derived equations can re-      the JULES model in a set of factorial simulations and run the
place uncertain mechanistic formulations and may also have        model with current-day (1979 to 2013) near-surface meteo-
more predictive capability corresponding to future climate        rological forcing and CO2 levels. First, we present the dif-
regimes. JULES traditionally uses the empirically based Ja-       ferent factorial simulations in the context of a thorough eval-

https://doi.org/10.5194/gmd-15-5567-2022                                            Geosci. Model Dev., 15, 5567–5592, 2022

5570                   R. J. Oliver et al.: Photosynthesis, stomatal conductance and thermal acclimation in JULES-vn5.6

uation of simulated contemporary carbon and energy fluxes.           2011; Mercado et al., 2009). The implementation of a mul-
Such evaluation includes comparison against individual eddy          tilayer canopy for light interception in JULES was shown
covariance sites and at spatial scales up to the global scale        to improve modelled canopy-scale photosynthetic fluxes at
against satellite products. Timescales analysed are both sea-        eddy covariance sites compared to the “big leaf approach”
sonal and annual. Secondly, we apply the new model con-              (Blyth et al., 2011; Jogireddy et al., 2006; Mercado et al.,
figurations within a past-to-future climate change simulation        2007). Specifically, the multi-layer approach better captured
based on a high-end emissions scenario (Shared Socioeco-             the light response and diurnal cycles of canopy photosyn-
nomic Pathway (SSP5) Representative Concentration Path-              thesis. While light inhibition of leaf respiration and chang-
way 8.5 (RCP8.5)). We use output from HadGEM3-GC3.1                  ing photosynthetic capacity with canopy depth are supported
spanning the years 1960 to 2050 to explore sensitivity of            by observations (Atkin et al., 2000, 1998; Meir et al., 2002).
global vegetation to future climate change. This choice of           Sunfleck penetration through the canopy and the differential
scenario is to allow for eventual comparison between these           effects of direct and diffuse beam radiation on modelled car-
offline simulations and the equivalent in the coupled global         bon and water exchange in JULES were studied by Mercado
climate model to investigate land–atmosphere feedbacks re-           et al. (2009). This enabled JULES to reproduce the different
sulting from these changes to the plant physiology routines.         light-response curves of GPP under diffuse and direct radia-
This is currently work being undertaken. This updated ver-           tion conditions at both a broadleaf and needleleaf temperate
sion of the JULES model is now available in official JULES           forest.
releases for use by the community (see “Code and data avail-
ability” section). It is therefore also readily available for full   2.2     Physiology developments
coupling into the UK community ESM (UKESM), a process
that is just starting.                                               2.2.1    Farquhar photosynthesis for C3 plants and
                                                                              parameterisation

                                                                     We implement the Farquhar photosynthesis scheme (Far-
2     Model description                                              quhar et al., 1980) to describe the leaf-level biochemistry
                                                                     of photosynthesis for C3 vegetation following the approach
2.1    JULES land surface model                                      of Mercado et al. (2018). Here the leaf-level photosynthe-
                                                                     sis is calculated as the minimum (note no smoothing) of
Our modelling framework is JULES (https://jules.jchmr.org,
                                                                     two potentially limiting rates (Eq. 1a). These two rates are
last access: 5 April 2022), the land surface component of the
                                                                     (i) Rubisco-limited photosynthesis (Eq. 2) and (ii) light-
Hadley Centre climate models, which includes the new UK
                                                                     limited photosynthesis with a dependence on the incident
community Earth System Model (UKESM1) (Sellar et al.,
                                                                     photosynthetically active photon flux density and the poten-
2019). JULES can be run offline, as in this study, forced with
                                                                     tial electron transport rate (Eqs. 3 and 4). Note, as in the
observed meteorology, at different spatial scales (from a sin-
                                                                     original Farquhar formulation, we do not include a TPU-
gle location to global). A full description of JULES is pro-
                                                                     limited (triose phosphate utilisation) rate. Further, recent
vided in Best et al. (2011), Clark et al. (2011) and Harper
                                                                     empirical studies suggest that TPU limitation rarely limits
et al. (2016). Of particular relevance for this study is the
                                                                     photosynthesis under present-day CO2 concentrations and is
plant physiological representation in JULES. JULES uses a
                                                                     also unlikely to limit photosynthesis at elevated CO2 (Ku-
leaf-level coupled model of photosynthesis and gs (Cox et
                                                                     marathunge et al., 2019a). This, and the current uncertainty
al., 1998) based on Collatz et al. (1991, 1992) (for C3 and
                                                                     in the formulation of TPU limitation of photosynthesis, led
C4 plants) and Jacobs (1994) respectively. Photosynthesis
                                                                     Rogers et al. (2021) to conclude it is an unnecessary compli-
and gs are modelled to respond to changes in environmental
                                                                     cation in LSMs. Hence,
drivers of temperature, humidity deficit, light, CO2 concen-

tration and water availability. Soil moisture content is mod-        Ap = min Av , Aj − Rd                                    (1a)
elled using a dimensionless soil water stress factor, which is       An = Ap β,                                                (1b)
related to the mean soil water concentration in the root zone,
and the soil water contents at the critical and wilting point        where Ap is the net potential (i.e. unstressed) leaf photosyn-
(Best et al., 2011). The critical and wilting point soil moisture    thetic carbon uptake (mol m2 s−1 ), Rd is the rate of leaf res-
concentrations vary by soil type in these simulations. In this       piration in the dark (mol m2 s−1 ) and An is the net photo-
study, JULES uses a multilayer canopy radiation intercep-            synthetic rate (mol m2 s−1 ), which accounts for the impact
tion and photosynthesis scheme (i.e. 10 layers) that accounts        of soil moisture stress on photosynthetic rate by multiplying
for vertical variation of incoming direct and diffuse radiation,     Ap by the soil water stress factor β. Rubisco-limited photo-
sunfleck penetration through the canopy, change in photosyn-         synthesis (Av , mol m2 s−1 ) is calculated as in Eq. (2). The
thetic capacity with depth into the canopy and inhibition of         maximum rate of carboxylation of Rubisco is determined by
leaf respiration in the light and differentiates calculation of      Vcmax (mol m2 s−1 ), ci and oa are the intercellular concentra-
sunlit and shaded photosynthesis at each layer (Clark et al.,        tions of CO2 and O2 (both Pa), Kc and Ko (both units of Pa)

Geosci. Model Dev., 15, 5567–5592, 2022                                              https://doi.org/10.5194/gmd-15-5567-2022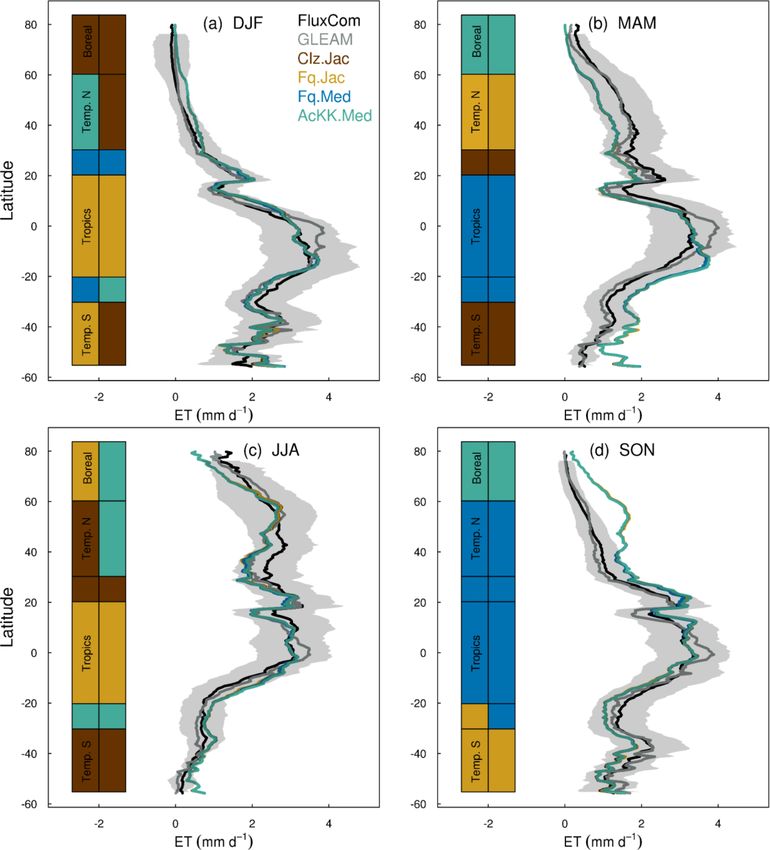
R. J. Oliver et al.: Photosynthesis, stomatal conductance and thermal acclimation in JULES-vn5.6                            5571

are the Michaelis Menten coefficients for Rubisco carboxy-
lation and oxygenation respectively, and 0 (Pa) is the CO2           To find new estimates for Vcmax and the Jmax : Vcmax ratio
compensation point in the absence of mitochondrial respira-       at Tref of 25 ◦ C for use with the Farquhar model for the nine
tion.                                                             PFTs in JULES, we used the global dataset from Walker et
          Vcmax (ci − 0)                                          al. (2014), which includes data from 356 species. For Vcmax
Av = h                  i                             (2)       and Jmax , Walker et al. (2014) re-analysed the data to remove
        ci + Kc 1 + Koao                                          the variation in these two parameters across studies caused
                                                                  by different parametric assumptions used in their derivation
The light-limited rate of photosynthesis (Aj , mol m2 s−1 )
                                                                  from A − Ci curves (e.g. using a common set of kinetic pa-
(Eq. 3) is a function of the rate of electron transport J
                                                                  rameters and reporting values at 25 ◦ C). We calculated the
(mol m2 s−1 ) which is represented in Eq. (4). J depends on
                                                                  mean Vcmax and Jmax across studies conducted at ambient
the incident photosynthetically active photon flux density
                                                                  CO2 concentration for each of the JULES PFTs (Table 2). To
Q (mol quanta m2 s−1 ), the potential rate of electron trans-
                                                                  parameterise the deciduous needleleaf tree (NDT) PFT, we
port Jmax (mol m2 s−1 ), the apparent quantum yield of elec-
                                                                  use the values for the evergreen needleleaf tree (NET) PFT
tron transport α (mol electrons mol−1 photon) fixed at 0.3
                                                                  because the data for NDT were from a single study on one
(mol electrons mol−1 photon) following Medlyn et al. (2002)
                                                                  juvenile (3 years old) species. An exception was the trop-
and θ a non-rectangular hyperbola smoothing parameter,
                                                                  ical broadleaf evergreen tree (BET-tr) PFT, where we use
which takes a value of 0.9 (unitless) following Medlyn et
                                                                  Vcmax and Jmax from the dataset collated in the more recent
al. (2002). The factor of 4 used in the Farquhar model in
                                                                  compilation by Kumarathunge et al. (2019b), as this study
Eq. (3) accounts for four electrons being required per car-
                                                                  includes many more tropical tree species than any previous
boxylation/oxygenation reaction.
                                                                meta-analysis.
        J (ci − 0)                                                   Parameter values for the temperature response functions
Aj =                                                      (3)
         4 (ci + 20)                                              for Vcmax and Jmax (Eq. 5) in the Farquhar scheme were taken
θJ 2 − (αQ + Jmax ) J + αQJmax = 0                         (4)    from a global dataset of photosynthetic CO2 response curves,
                                                                  which entrained data from 141 C3 species, ranging from
JULES currently uses Q10 functions in the Collatz scheme to       the tropical rainforest to Arctic tundra (Kumarathunge et al.,
describe the temperature dependency of Vcmax , Kc , Ko and 0      2019b). The study provides parameter values for tree PFTs
(see Sect. S1 in the Supplement). In our implementation of        that match those in JULES, for example, tropical broadleaf
the Farquhar scheme, temperature sensitivities for the Kc , Ko    evergreen trees (BET-tr PFT in JULES), temperate broadleaf
and 0 are taken from Bernacchi et al. (2001) as described in      evergreen trees (BET-te), broadleaf deciduous trees (BDTs)
Medlyn et al. (2002). These are the same temperature sensi-       and needleleaf evergreen trees (NETs). For the remaining
tivities used by experimentalist to derive estimates of photo-    JULES PFTs, BDT values are used for NDT and decidu-
synthetic capacity parameters (Rogers et al., 2017). Of par-      ous shrubs (DSH), and BET-te values are used for evergreen
ticular importance to our analysis here are the temperature       shrubs (ESH). Kumarathunge et al. (2019b) do not include
responses of Vcmax and Jmax . Equation (5) describes the tem-     data for C3 grasses; therefore to parameterise the tempera-
perature response of both parameters:                             ture dependency of Vcmax and Jmax for this PFT, we fitted

                                         h
                                 1 + exp Tref 1S−Hd
                                                      i           both to the existing Vcmax temperature response function in
                   (Tl − Tref )                Tref R             the Collatz scheme for C3 grasses because of a scarcity of
kT = k25 exp Ha                           h           i.    (5)
                    Tref RTl      1 + exp   Tl 1S− Hd             data in the literature. Figure S1 in the Supplement shows
                                             Tl R
                                                                  the temperature dependency of Vcmax , Jmax and gross pho-
Here, kT (µmol m2 s−1 ) is either Vcmax or Jmax at leaf temper-   tosynthesis for Collatz and Farquhar using the PFT-specific
ature Tl (K), k25 (µmol m2 s−1 ) is the rate of Vcmax or Jmax     parameters in Tables 1 and 2.
at the reference temperature Tref of 25 ◦ C (298.15 K), R is
the universal gas constant (8.314 J mol−1 K−1 ), Ha and Hd        2.2.2   Medlyn model of gs and parameterisation
(J mol−1 ) are the activation and deactivation energies respec-
                                                                  In JULES, gs (m s−1 ) is represented in Eq. (7).
tively, and 1S (J mol−1 K−1 ) is an entropy term (see Table 1
for PFT-specific parameter values). Broadly, Ha describes the                     An
rate of exponential increase in the function below the op-        gs = 1.6RTl           ,                                     (7)
                                                                                ca − ci
timum temperature (Topt ), and Hd describes the rate of de-
crease above the Topt . 1S and Topt are related by Eq. (6),       where the factor 1.6 accounts for gs being the conductance
which is used to calculate the Topt of Vcmax and Jmax (Ta-        for water vapour rather than CO2 , R is the universal gas con-
ble 1):                                                           stant (J mol−1 K−1 ), Tl is the leaf surface temperature (K), ca
                Hd                                                and ci (both Pa) are the leaf surface and internal CO2 partial
Topt =            h        i.                              (6)    pressures respectively, and An is the net photosynthetic rate.
         1S − R ln HdH−aHa                                        Here, ci is unknown and is calculated in JULES using the

https://doi.org/10.5194/gmd-15-5567-2022                                             Geosci. Model Dev., 15, 5567–5592, 2022
5572                    R. J. Oliver et al.: Photosynthesis, stomatal conductance and thermal acclimation in JULES-vn5.6

Table 1. PFT-specific parameters for the required temperature dependency of Vcmax and Jmax in the Collatz and Farquhar photosynthesis
schemes. PFT codes (left column) are BET-tr – broadleaf evergreen tropical tree, BET-te – broadleaf evergreen temperate tree, BDT –
broadleaf deciduous tree, NET – needle leaf evergreen tree, NDT – needle leaf deciduous tree, C3 – C3 grass, C4 – C4 grass, ESH –
evergreen shrub, DSH – deciduous shrub.

                      Collatz                                                             Farquhar
                                                                                                                                             Hdvcmax
             Tupp    Tlow    Toptvcmax       Havcmax        Haj max          1Svcmax             1Sj max         Toptvcmax    Toptj max   or Hdj max
             (◦ C)   (◦ C)       (◦ C)    (J mol−1 )     (J mol−1 )     (J mol−1 K−1 )     (J mol−1 K−1 )            (◦ C)       (◦ C)    (J mol−1 )
  BET-tr       43     13         39.00       86 900        64 000                  631                   635          42.71     38.73      200 000
  BET-te       43     13         39.00       59 600        35 900                  634                   632          38.80     37.10      200 000
  BDT          43      5         39.00       49 300        38 800                  658                   663          26.57     23.22      200 000
  NET          37      5         33.00       63 100        36 400                  642                   643          35.28     31.96      200 000
  NDT          36     −5         34.00       49 300        38 800                  658                   663          26.57     23.22      200 000
  C3           32     10         28.00       97 200       112 000                  660                   663          28.00     28.00      199 000
  C4           45     13         41.00            –             –                    –                     –              –         –            –
  ESH          36     10         32.00       59 600        35 900                  634                   632          38.80     37.10      200 000
  DSH          36      0         32.00       49 300        38 800                  658                   663          26.57     23.22      200 000

Table 2. PFT-specific parameters for the Collatz and Farquhar photosynthesis schemes.

                             Collatz                                                               Farquhar
                  Vcmax25                 α(intrinsic)          Vcmax25               Jmax25      Jmax : Vcmax                           α(apparent)
            (µmol m2 s−1 )      (mol CO2 mol−1 PAR)       (µmol m2 s−1 )       (µmol m2 s−1 )                          (mol electrons mol−1 photon)
 BET-tr              41.16                       0.08                 39.50              63.20                 1.60                             0.30
 BET-te              61.28                       0.06                 68.95             112.59                 1.63                             0.30
 BDT                 57.25                       0.08                 55.24              98.30                 1.78                             0.30
 NET                 53.55                       0.08                 50.80              75.14                 1.48                             0.30
 NDT                 50.83                       0.10                 50.80              75.14                 1.48                             0.30
 C3                  51.09                       0.06                 43.83             108.07                 2.47                             0.30
 C4                  31.71                       0.04                     –                  –                    –                                –
 ESH                 62.41                       0.06                 68.96             112.59                 1.63                             0.30
 DSH                 50.40                       0.08                 55.24              98.30                 1.78                             0.30

Jacobs scheme as in Eq. (8) and relates the ratio of ambient
(ca ) to leaf intercellular (ci ) partial pressure of CO2 (ci /ca ),                                 !
to leaf humidity deficit:                                                                   g1
                                                                              ci = ca        p           .                                         (9)
                                                                                       g1 + d q
                          dq
ci = (ca − 0) f0 1 −              + 0,                          (8)
                         dqcrit                                               PFT-specific values of the g1 parameter were derived for
where 0 (Pa) is the CO2 photorespiration compensation                         the nine JULES PFTs from the global database of Lin et
point, dq is the specific humidity deficit at the leaf surface                al. (2015) (Table 3). The g1 parameter represents the sen-
(kg kg−1 ), and dqcrit (kg kg−1 ) and f0 are PFT-specific pa-                 sitivity of gs to the assimilation rate, i.e. plant water-use effi-
rameters representing the critical humidity deficit at the leaf               ciency, and was derived as in Lin et al. (2015), by fitting the
surface and the leaf internal-to-atmospheric CO2 ratio (ci /ca )              Medlyn et al. (2011) model to observations of gs , photosyn-
at the leaf-specific humidity deficit (Best et al., 2011). To im-             thesis and vapour pressure deficit (VPD), assuming an inter-
plement the Medlyn model, Eq. (9) is used to calculate ci ,                   cept of zero. A non-linear mixed-effect model was used to
retaining Eq. (7) to calculate gs . In Eq. (9), g1 (kPa0.5 ) is a             estimate the model slope coefficient, g1 , for each PFT, where
PFT-specific model parameter, and dq is the vapour pressure                   individual species were assumed to be the random effect to
deficit at the leaf surface expressed in kilopascals (kPa). The               account for the differences in the g1 slope among species
Medlyn scheme is based on optimisation theory and so as-                      within the same group, following Lin et al. (2015).
sumes that stomatal aperture is regulated to maximise carbon
gain while simultaneously minimising water loss:

Geosci. Model Dev., 15, 5567–5592, 2022                                                          https://doi.org/10.5194/gmd-15-5567-2022
R. J. Oliver et al.: Photosynthesis, stomatal conductance and thermal acclimation in JULES-vn5.6                              5573

Table 3. PFT-specific parameters required for the Jacobs and Med-     3     Model evaluation and application
lyn gs schemes.
                                                                      3.1    Site-level simulations
                       Jacobs      Jacobs        Medlyn
                           fo        dqcrit          g1               JULES was applied using four model configurations (Ta-
                                (kg kg−1 )      (kPa0.5 )             ble 5) with observed meteorology and evaluated against data
                                                                      from 17 eddy covariance sites (Table S1, Fig. S2). This col-
            BET-tr      0.875        0.090          5.31
                                                                      lection of eddy covariance measurements represents a range
            BET-te      0.892        0.090          3.37
            BDT         0.875        0.090          4.45
                                                                      of climates and land cover types (Table S1, Fig. S2). In
            NET         0.875        0.060          2.35              all simulations the vegetation cover was prescribed, remov-
            NDT         0.936        0.041          2.35              ing any biases that the modelled competition may introduce
            C3          0.931        0.051          5.25              through self-diagnosis of PFT extents. The prescribed leaf
            C4          0.800        0.075          1.62              area index (LAI) was used where site data were available,
            ESH         0.950        0.037          3.29              otherwise the JULES phenology scheme was switched on,
            DSH         0.950        0.030          5.47              allowing the LAI to evolve in the model. Model output was
                                                                      evaluated against fluxes of gross primary productivity (GPP)
                                                                      and evaporative fraction (EF). We used EF rather than latent
Table 4. Parameter values derived by Kattge and Knorr (2007) and      heat flux to minimise issues with incomplete closure of the
used in this study in Eq. (10) to model thermal acclimation of pho-   energy balance (that can typically range from 5 % to 30 %
tosynthesis using the AcKK scheme.                                    at some eddy covariance sites; Liu et al., 2006). For analysis
                                                                      we used daytime values only (i.e. where the shortwave radi-
                                   Acclimation                        ation was > 10 W m2 ) from days with no missing data and
                                      a            b                  compare mean seasonal diurnal cycles of modelled GPP and
                                                                      EF against the observed fluxes. The mean seasonal cycle cal-
                1Sj               659.7        −0.75
                1Sv              668.39        −1.07                  culated over the entire measurement period is used in order
                Jmax : Vcmax       2.59       −0.035                  to assess the mean model behaviour.
                                                                         We evaluate the site-level simulations with RMSE (root
                                                                      mean square error) for the seasonal diurnal cycle of simu-
                                                                      lated (daytime) fluxes (GPP and EF). For each site, the time
2.2.3   Thermal acclimation of photosynthetic capacity                period of the simulation and therefore evaluation period is
                                                                      stated in Table S1. We summarise the changes in RMSE us-
The Kattge and Knorr (2007) acclimation algorithm                     ing the relative improvement for each model configuration
(“AcKK”) is based on the parameters of the Farquhar pho-              (i) compared to the current standard JULES configuration
tosynthesis scheme; hence acclimation is implemented in the           of Collatz with Jacobs (Clz.Jac). The statistic is calculated
Farquhar model. The AcKK algorithm uses empirical rela-               so that positive values show an improvement compared to
tionships to describe the response of Vcmax , Jmax and the            Clz.Jac and therefore a better comparison to the observations:
Jmax : Vcmax ratio to changes in Tgrowth (defined in AcKK
                                                                                    RMSEClz.Jac − RMSEi
as the average temperature (day and night) of the previous            RMSEreli =                        .                      (11)
30 d), and importantly it represents combined acclimation                              RMSEClz.Jac
and adaptation processes. Kattge and Knorr (2007) found
that 1Sv , 1Sj and the Jmax : Vcmax ratio decrease linearly
with increasing Tgrowth following Eq. (10). This means ac-            3.2    Global-scale simulations
cording to these relationships, the optimum temperatures
                                                                      Four JULES simulations were performed globally for the pe-
(Topt ) of Vcmax and Jmax (Toptv and Toptj ) increase by 0.44
                                                                      riod 1979–2013 as outlined in Table 5. These global present-
and 0.33 ◦ C per degree increase in Tgrowth respectively, and
                                                                      day simulations were run at 0.5◦ × 0.5◦ spatial resolution.
the Jmax : Vcmax ratio at 25 ◦ C decreases by 0.035 ◦ C per de-
                                                                      The WFDEI meteorological dataset was used to drive the
gree increase in Tgrowth .
                                                                      model (Weedon et al., 2014). This has a 3 h temporal res-
                                                                      olution that JULES interpolated down to an hourly model
xi = ai + bi Tgrowth                                          (10)    time step. To focus on the direct effects of the model changes
                                                                      on GPP and surface energy fluxes, the land surface proper-
The x is either 1Sv , 1Sj or the Jmax : Vcmax ratio, and the          ties of the model were prescribed. We use a static map of
sub-index i refers to the parameter values (a and b shown in          land cover (in terms of different PFT extents) derived from
Table 4) for Vcmax , Jmax or the Jmax : Vcmax ratio. Tgrowth is       the European Space Agency’s Land Cover Climate Change
the growth temperature (calculated online as the mean tem-            Initiative (ESA LC_CCI) global vegetation distribution ver-
perature of the previous 30 d).                                       sion 1.6 for the 2010 epoch (Poulter et al., 2015) (Fig. S3)

https://doi.org/10.5194/gmd-15-5567-2022                                                Geosci. Model Dev., 15, 5567–5592, 2022
5574 R. J. Oliver et al.: Photosynthesis, stomatal conductance and thermal acclimation in JULES-vn5.6
Table 5. Description of the four model experiments performed both at site level and globally, with the JULES land surface model.
Model Description Photosynthesis Stomatal Temperature dependency Tgrowth
simulation scheme closure of photosynthesis
Clz.Jac The original photosynthesis and Collatz et al. Jacobs Q10 function for Kc , Ko , 0 and n/a
stomatal conductance (gs ) schemes (1991) (1994) Vcmax (PFT-specific). Topt varies
used in JULES. by PFT but is fixed spatially and
temporally.
Fq.Jac The Farquhar photosynthesis Farquhar et al. Jacobs Arrhenius function for Kc , Ko , 0, n/a
scheme is implemented with up- (1980) (1994) Vcmax and Jmax (latter two both
dated Vcmax and Jmax values and PFT-specific). Topt varies by PFT
updated parameters for the tem- but is fixed spatially and temporally.
perature response of photosynthesis
(1S and Ha for Vcmax and Jmax )
with original gs scheme used in
JULES.
Fq.Med The Medlyn stomatal closure is im- Farquhar et al. Medlyn et Arrhenius function for Kc , Ko , 0, n/a
plemented with the parameter g1 (1980) al. (2011) Vcmax and Jmax (latter two both
that varies by PFT with Farquhar PFT-specific). Topt varies by PFT
photosynthesis model implementa- but is fixed spatially and temporally.
tion.
AcKK.Med Thermal acclimation of photosyn- Farquhar et al. Medlyn et Arrhenius function for Kc , Ko and Yes
thetic capacity accounted for. Im- (1980) al. (2011) 0. Thermal acclimation of photo-
plemented within the Farquhar synthetic capacity implemented fol-
model coupled to the Medlyn gs lowing Kattge and Knorr (2007).
model. Parameters describing the temper-
ature sensitivity of photosynthesis
(1S for Vcmax and Jmax and the
Jmax : Vcmax ) allowed to acclimate
to the temperature of the growth en-
vironment (Tgrowth ). Topt adjusts to
changes in Tgrowth so varies spa-
tially and temporally.
n/a – not applicable.
following that used in Harper et al. (2016). Seasonally vary- with the same forcing (WFDEI), as is recommended by Jung
ing LAI values were derived from the Global LAnd Surface et al. (2019) to minimise deviations due to different climate
Satellite (GLASS) dataset (Xiao et al., 2016). Prescribed pa- input data. To convert LE to ET, we assume a constant la-
rameters were used for the hydraulic and thermal properties tent heat of vaporisation of 2.5 MJ mm−1 . We also use the
of the soil from a modified version of the H1 lookup table model-derived product from GLEAM-v3.3a to evaluate ET
from Zhang and Schaap (2017) that depends upon the soil and additionally use the MODIS GPP product (Zhao et al.,
textural type from SoilGrids (Hengl et al., 2014). We also 2005; Zhao and Running, 2010; Zhao et al., 2006) to evalu-
prescribe transient atmospheric CO2 concentrations based on ate simulated global GPP.
annual mean observations from Mauna Loa (Tans and Keel- Global future climate simulations were performed forced
ing, 2014). A spin-up of 80 years was performed (recycling with meteorological output (1960 to 2050) from the
through the period 1979 to 1999), which is sufficient to equi- HadGEM3-GC3.1 model atmosphere-only simulations at 3 h
librate soil temperature and soil moisture. temporal resolution and N512 spatial resolution (Roberts et
The global offline present-day simulations were compared al., 2019; Williams et al., 2018). These projections follow the
against the global evaluation products, and for both model CMIP6 HighResMIP protocol (Haarsma et al., 2016). This
output and observations, we calculate seasonal means over choice of forcing to drive JULES is to allow for comparison
the period 2002 to 2012. We used the global FluxCom prod- of the offline runs performed in this study with the equiv-
uct to evaluate modelled GPP, LE, H and ET (Jung et al., alent simulations currently being undertaken in the coupled
2020; Tramontana et al., 2016). We compare our simulations HadGEM3-GC3.1 model to explore land–atmosphere feed-
against the FluxCom ensemble product (RS + MET) driven backs arising from changes implemented in the plant physi-
Geosci. Model Dev., 15, 5567–5592, 2022 https://doi.org/10.5194/gmd-15-5567-2022R. J. Oliver et al.: Photosynthesis, stomatal conductance and thermal acclimation in JULES-vn5.6 5575
ology routines in this work. The factorial set of offline sim- variable by site and season (Figs. 1, S5 and S6), some of
ulations in this work provide a systematic sensitivity study which will be due to other site-specific characteristics that
that is less computationally expensive with which to help un- are not simulated well by the model, such as LAI for those
derstand behaviour seen in the coupled model. The output sites that rely on model-derived estimates. On the other hand,
at N512 was re-gridded to 0.5◦ × 0.5◦ using conservative in- soil properties are prescribed by parameters that describe the
terpolation, which ensures the physical conservation of each thermal and hydraulic characteristics of the soil; uncertain-
variable. Figure S4 shows the mean temperature and precip- ties in these parameterisations have consequences for the
itation change by region over the study period and the at- simulated soil moisture content at each site, for example,
mospheric CO2 concentration. Atmospheric CO2 concentra- which impacts simulated carbon and water fluxes. We first
tions were prescribed based on observations up to 2014 as de- consider results for the five tropical sites. Results are mixed
scribed in historical CMIP6 simulations (Eyring et al., 2016). for the simulated seasonal diurnal cycle of GPP at the trop-
From 2015 onwards, atmospheric CO2 concentrations were ical (EBF / BET-tr) sites; GPP is improved (reduced) with
based on a high-end emission scenario of the Shared Socioe- the new JULES model configurations at three out of the five
conomic Pathways (SSP5) with the Representative Concen- tropical sites in March–April–May (MAM; Figs. 1a, S5),
tration Pathway 8.5 (RCP8.5) (Haarsma et al., 2016). As for with thermal acclimation leading to the greatest improve-
the current-day simulations, LAI, land cover and soil proper- ments. However in June–July–August (JJA; Figs. 1b, S5),
ties were prescribed using the same datasets. A spin-up pe- this improvement is only found at two of the tropical sites.
riod of 80 years (recycling through the period 1960 to 1980) At the EBF sites, implementing the Farquhar photosynthesis
was again used to equilibrate soil temperature and soil mois- model means Vcmax is lower (BET-tr, Table 2), and this in
ture. addition to the change in temperature sensitivity (Table 1;
We analyse the future global simulations using the “differ- Fig. S1a–c) and model structural changes from Collatz to
ence of difference” approach. This method explicitly targets Farquhar results in lower simulated GPP compared to Col-
the change in the variable of interest over the study period latz. Thermal acclimation allows for further adjustments of
resulting from the change in process alone and negates dif- the Toptv , Toptj and the Jmax : Vcmax ratio which results in
ferences that may arise from different initial starting points lower simulated photosynthesis and therefore GPP compared
of each simulation (different initial conditions): to Farquhar (Fig. S5). The change from Jacobs gs model to
Medlyn has minimal impact on simulated GPP for the trop-
Effect = X2050 − X1980 − Y 2050 − Y 1980 , (12) ical tree PFT because in both schemes the modelled ci has a
similar sensitivity to humidity deficit at the leaf surface, with
where X represents the simulation with the process of inter- the exception at very low humidity deficit (Figs. S7; S5). The
est, and Y represents the simulation with the alternative rep- simulated seasonal diurnal cycle of EF is improved (reduced)
resentation, and 2050 and 1980 represent the end and start of at four out of the five tropical sites in both MAM and JJA,
the simulation analysis period respectively (calculated as the again with some of the largest improvements seen with ther-
mean over 2040 to 2050 and 1980 to 1990 respectively). For mal acclimation (Figs. 1c, d; S6).
example, to look at the impact of changing photosynthesis At the C3 grassland sites (GRA), improved simulated GPP
schemes, X = Fq.Jac and Y = Clz.Jac. In this case, both con- (higher GPP) is seen across all sites in JJA with the Med-
figurations are using the Jacobs gs scheme; only the photo- lyn gs scheme and thermal acclimation (Figs. 1b, S5). This
synthesis scheme changes from Collatz to Farquhar. The im- is matched by improvements in simulated EF (higher EF)
pact of changing gs scheme is assessed, where X = Fq.Med across all grassland sites in both seasons, with the exception
and Y = Fq.Jac. The impact of thermal acclimation is as- of US_var in JJA (Figs. 1c, d; S6). The change from Collatz
sessed where X = AcKK.Med and Y = Fq.Med; here both to Farquhar at the GRA sites means a lower Vcmax is used
simulations use the Farquhar photosynthesis scheme and the (C3 , Table 2), although the temperature sensitivity is similar
Medlyn gs scheme, but X has the addition of thermal accli- (Table 1, Fig. S1p, q); this results in lower GPP simulated
mation of photosynthesis. by Farquhar compared to Collatz, which compares worse to
the observations (GPP and EF, Figs. 1, S5). In contrast to us-
4 Results ing Farquhar with the Jacobs gs scheme, using Farquhar with
the Medlyn scheme improves simulated GPP and EF; both
4.1 Site-level evaluation are increased because for the C3 grass PFT, as the humidity
deficit at the leaf surface increases, ci simulated by Medlyn
Results from the FLUXNET sites comparing the mean sea- is less sensitive compared to Jacobs (Figs. S7; S5), leading
sonal diurnal cycles of GPP and EF against observed fluxes to higher ci , higher net canopy photosynthesis and GPP, and
are summarised in Fig. 1, where reds and yellows indicate higher transpiration and LE. These results suggest the Med-
reduced RMSE relative to the “standard” JULES configu- lyn scheme has a large impact on simulated carbon and water
ration of Collatz with Jacobs (Clz.Jac) and therefore closer fluxes for the C3 grass PFT in the JULES model. In JJA, the
agreement to site-level FLUXNET observations. Results are adjustment of the temperature sensitivity of photosynthesis
https://doi.org/10.5194/gmd-15-5567-2022 Geosci. Model Dev., 15, 5567–5592, 20225576 R. J. Oliver et al.: Photosynthesis, stomatal conductance and thermal acclimation in JULES-vn5.6 Figure 1. Relative changes in RMSE for each JULES model configuration compared to Collatz with Jacobs (Clz.Jac) for hourly daytime (a) GPP (March–April–May), (b) GPP (June–July–August), (c) EF (March–April–May) and (d) EF (June–July–August). Calculated accord- ing to Eq. (11), positive values (reds and yellows) are where RMSE is lower compared to the Clz.Jac configuration and therefore indicates an improvement compared to the Clz.Jac baseline, and the FLUXNET observations. EBF – broadleaf evergreen tropical tree, GRA – C3 grassland, BDT – broadleaf deciduous tree, NET – needle leaf evergreen tree. The fit of each model configuration to observations and the RMSE are shown in Fig. S5 (GPP) and Fig. S6 (EF). to the Tgrowth by the thermal acclimation scheme tends to in- GPP and LE, the magnitude of which depends on the local crease GPP compared to Farquhar with no acclimation, and site humidity conditions. In JJA the Medlyn gs model per- this compares better to the observations (Figs. 1, S5). forms worse at all sites for GPP (Fig. 1b), although improve- At the broadleaf deciduous tree (BDT) sites, simulated ments in simulated EF are seen in JJA, where both Medlyn GPP is improved with all JULES model configurations in and thermal acclimation improve model performance at three MAM (higher GPP) at three out of the four sites (Fig. 1a). out of four BDT sites (Figs. 1d, S6). However in JJA, improvements are mainly seen with thermal At the evergreen needleleaf (NET) sites, the most con- acclimation (lower GPP compared to Fq.Med; Fig. 1b). Med- sistent improvements to simulated GPP are seen with the lyn gs performs worse at all sites in JJA, suggesting either Farquhar model, where simulated GPP in JJA is substan- the model formulation or parameters are not suitable to cor- tially improved (GPP reduced) at three out of four sites rectly capture stomatal behaviour in this season for this PFT (Figs. 1b, S5); in this season both Medlyn and thermal accli- (Figs. 1b, S5). Compared to Collatz, the Farquhar model for mation generate larger improvements in the simulated GPP the BDT PFT uses a lower Vcmax (Table 2) and has a con- (reducing GPP further), but this is just at two out of the siderably lower Toptv (Table 1; Fig. S1h), which means that four sites. In our implementation of the Farquhar model, the at leaf temperatures below ∼ 22 ◦ C, photosynthesis is higher NET PFT has a lower Vcmax compared to Collatz (Table 2) with the Farquhar model and above this photosynthesis is and a slightly higher Toptv (Table 1, Fig. S1k). The resulting lower than Collatz (Fig. S1g). Consequently, warmer tem- shape of the temperature response curve for photosynthesis peratures in JJA lead to lower GPP simulated by Farquhar (Fig. S1j) means that at leaf temperatures below ∼ 10 ◦ C, compared to Collatz, and cooler temperatures in MAM re- Farquhar photosynthesis is higher. However, above 10 ◦ C, sult in slightly higher GPP with Farquhar compared to Col- Farquhar photosynthesis is lower compared to Collatz, re- latz (Fig. S5). Using the Medlyn model means simulated ci sulting in simulated GPP in MAM that tends to be higher is more sensitive to increasing leaf humidity deficit for the with Farquhar than Collatz, and in JJA the opposite occurs BDT PFT (Fig. S7). Medlyn simulates a lower ci as humid- (Fig. S5). In MAM and JJA, the Medlyn gs model simulates ity deficit increases compared to Jacobs, which leads to lower some large improvements in EF; ci simulated by Medlyn is Geosci. Model Dev., 15, 5567–5592, 2022 https://doi.org/10.5194/gmd-15-5567-2022
R. J. Oliver et al.: Photosynthesis, stomatal conductance and thermal acclimation in JULES-vn5.6                           5577

more sensitive to increasing leaf humidity deficit compared       from moving from the traditional JULES set-up of Collatz
to Jacobs (Fig. S7), which results in lower transpiration and     with Jacobs (Clz.Jac) to Farquhar with thermal acclimation
EF, and this compares better to the observations (Figs. 1, S6).   and Medlyn gs (AcKK.Med), and the impacts on simulated
                                                                  GPP, LE and H can clearly be seen as the trade-off between
4.2     Global evaluation                                         the dominating effects from each model configuration. For
                                                                  LE and H the response of the simulated energy fluxes is
4.2.1    Spatial differences between model configurations         dominated by the change in the representation of gs , and for
                                                                  GPP the response of simulated carbon fluxes is dominated
The impact of changes in the photosynthesis scheme, gs            by the change in the representation of photosynthesis and its
scheme, adding thermal acclimation of photosynthetic ca-          response to temperature (i.e. thermal acclimation).
pacity and the overall change on simulated GPP, LE and H ,
is shown in Fig. 2 by comparing each of the new JULES             4.2.2   Comparison to global estimates: seasonal mean
configurations to the configuration with the alternative pro-             GPP and ET
cess representation. For GPP, the biggest change is moving
from the Collatz photosynthesis scheme to the Farquhar pho-       Evaluation of simulated global mean GPP by season using
tosynthesis scheme (Fig. 2a). Most notably, this change re-       FluxCom and MOD17 global GPP products is presented
sults in decreased GPP in the tropical region in JJA of up        in Fig. 3a and using global ET from both FluxCom and
to 1.5 g C m2 d−1 (up to 10 % reduction), whilst in the high      GLEAM is shown in Fig. 3b. The seasonal means show ther-
northern latitudes, GPP is increased by up to 1.5 g C m2 d−1      mal acclimation compares best to observations (FluxCom) in
(up to 20 % increase). This is consistent with results from       JJA (AcKK.Med underestimates GPP by just 4 %, whereas
the site-level simulations where GPP was reduced with im-         Clz.Jac underestimates GPP by 6 %; Fig. 3a and Table S2)
plementation of the Farquhar model at tropical sites and in-      and MAM (AcKK.Med underestimates GPP by just 5 %,
creased in cooler months (MAM) at the evergreen needleleaf        whereas Clz.Jac underestimates GPP by 11 %; Fig. 3a and
forest sites (here increased GPP in NET-dominated areas are       Table S2) and is in reasonable agreement with FluxCom in
in the forests of the high northern latitudes, which is consis-   DJF (AcKK.Med overestimates GPP by just 2 %, whereas
tent with cooler temperatures). Impacts on LE and H result-       Clz.Jac underestimates GPP by 4 %; Fig. 3a and Table S2).
ing from the move from Collatz to Farquhar are not as ex-         All JULES model configurations have a high GPP bias in
tensive as those seen with GPP (Fig. 2b and c). The change        SON compared to FluxCom, and in all seasons GPP is over-
from Jacobs gs scheme to Medlyn impacts LE and H most,            estimated by all model configurations compared to MOD17;
resulting in a pronounced pattern of decreased LE in northern     similarly this is largest in SON. For simulated ET, seasonally
latitudes (up to 10 W m2 , equivalent to a 10 % reduction) and    the model performance is very similar between the differ-
corresponding increase in H in JJA (Fig. 2e and f). In these      ent JULES configurations but in both SON and DJF Medlyn
JULES simulations, this region is dominated by NET forest,        (Fq.Med) compares better to both FluxCom and GLEAM,
and the high-latitude changes are consistent with results from    but the differences are very small (Fig. 3b and Table S3).
the site-level simulations, where using the Medlyn gs scheme
at NET sites resulted in some of the biggest improvements in      4.2.3   Comparison to global estimates: latitudinal mean
simulated EF (lower LE and therefore lower EF). Including                 GPP and ET
thermal acclimation of photosynthesis has the most exten-
sive impacts on simulated GPP in contrast to LE and H . In        Figures 4 and 5 present comparisons of seasonal zonal-mean
the tropical forests, GPP is reduced by up to 1 g C m2 d−1        GPP and ET respectively. Firstly, Figs. 4 and 5 highlight
(between 2 % and 5 % reduction) in JJA (Fig. 2g). The im-         the differences between global products used to evaluate
pact of acclimation is spatially variable in the temperate re-    GPP and ET (see, for example, Spafford and MacDougall,
gion in JJA, with GPP decreased in Europe (between 2 %            2021). For example, FluxCom generally predicts higher GPP
and 5 %) but increased in eastern United States (up to 20 %).     in the tropics compared to MOD17, especially in DJF and
Some areas of the boreal region see increased GPP (between        MAM, and in JJA the different distribution of GPP by lati-
2 % to 5 %). This GPP response demonstrates the impact of         tude means in the tropics MOD17 GPP is higher than Flux-
thermal acclimation, which allows for the parameters of the       Com in the southern latitudes, and FluxCom GPP is higher
temperature sensitivity functions for photosynthetic capacity     in the northern tropics. Comparison of the two ET products
(Vcmax , Jmax and Jmax : Vcmax ) to move in response to the       shows that GLEAM tends to give higher ET in the tropics,
temperature of the growth environment, leading to spatially       particularly in DJF and MAM. Bearing in mind uncertain-
and temporally different values of the Topt for photosynthe-      ties in observation-based estimates of fluxes at this scale, we
sis for each C3 PFT. Thermal acclimation impacts LE and H         now consider how the different model configurations com-
to a lesser extent, but where changes are seen, acclimation       pare. Notably, all the JULES model configurations in this
increases LE with a corresponding decrease in H (Fig. 2h          study simulate comparable global carbon and water fluxes for
and i). Figure 2j, k and l show the overall change that results   the recent contemporary period and are in reasonable agree-

https://doi.org/10.5194/gmd-15-5567-2022                                            Geosci. Model Dev., 15, 5567–5592, 2022
5578 R. J. Oliver et al.: Photosynthesis, stomatal conductance and thermal acclimation in JULES-vn5.6
Figure 2. Absolute difference between JULES-modelled GPP, latent (LE) and sensible heat (H ) for the different JULES model configurations
in June–July–August (JJA) to show the impact of (a, b, c) changing photosynthesis scheme (Fq.Jac–Clz.Jac), (d, e, f) changing gs scheme
(Fq.Med–Fq.Jac), (g, h, i) accounting for thermal acclimation of photosynthesis (AcKK.Med–Fq.Med) and (j, k, l) the overall change
(AcKK.Med–Clz.Jac), under present-day meteorological conditions. For each variable, the mean over the period 2002 to 2012 is used. The
absolute mean value simulated by each model configuration (JJA) is shown in Fig. S8. DJF is shown in Fig. S9 (mean absolute values) and
Fig. S10 (absolute difference).
mates of ET are improved in the tropics (lowest RMSE) with
the Farquhar model (Fq.Jac) in DJF and JJA and with the
Medlyn model (Fq.Med) in MAM and SON, and again this
result is not dependent on the choice of observation-based
product (Fig. 5). Another notable change is the improvement
of simulated GPP in the temperate north and boreal regions in
MAM with thermal acclimation (AcKK.Med). Deficiencies
in the model stand out, but these biases are common to all
model configurations. For example, all configurations simu-
Figure 3. Seasonal mean global (a) GPP and (b) ET for each JULES late an over-prediction of GPP and ET in SON in the tem-
model configuration compared to FluxCom (closed symbols) and
perate north and boreal regions, overestimated GPP in MAM
MOD17 (GPP) or GLEAM (ET) (open symbols).
in tropical southern latitudes (0 to −20◦ S), under-predicted
GPP and ET in MAM in temperate north and boreal regions,
and an over-prediction of ET in MAM in the temperate and
ment with the global products used for evaluation. Differ- tropical south.
ences in RMSE between the different model configurations
are small for both GPP and ET. Importantly, the most consis- 4.2.4 Comparison to global estimates: spatial
tent change is the improvement (lowest RMSE) of modelled variability of mean GPP and ET
GPP in the tropics with the Farquhar model (Fq.Jac). This
improvement is evident in all seasons and holds when com- The spatial variability of simulated GPP and ET is shown in
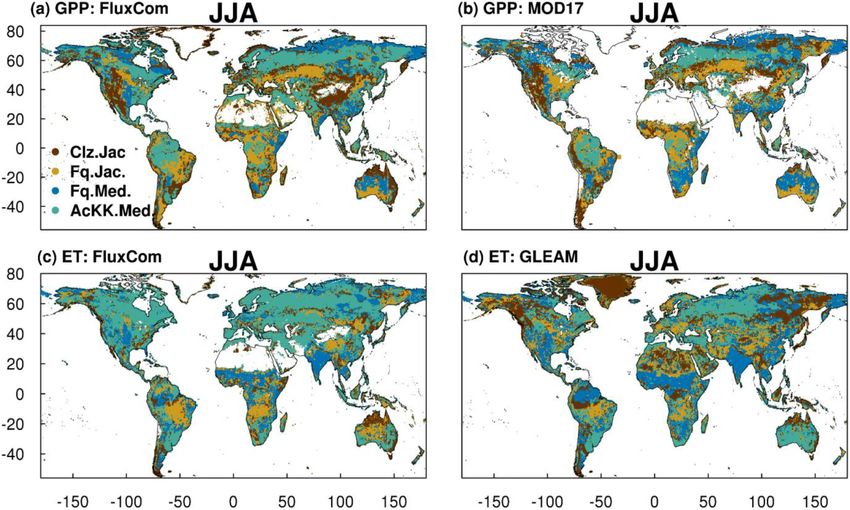
paring to both FluxCom and MOD17 (Fig. 4). Similarly, esti- Fig. 6 during JJA (Fig. S11 for DJF). We show which of the
Geosci. Model Dev., 15, 5567–5592, 2022 https://doi.org/10.5194/gmd-15-5567-2022You can also read