IN 2021 THE ECONOMIC LANDSCAPE OF U.S. AGRICULTURE - AGAMERICA'S CHIEF ECONOMIST ANALYZES THE PATH OF ECONOMIC RECOVERY FOR U.S. AGRICULTURE AND ...
←
→
Page content transcription
If your browser does not render page correctly, please read the page content below
THE ECONOMIC
LANDSCAPE OF
U.S. AGRICULTURE
IN 2021
AgAmerica’s Chief Economist analyzes the path of
economic recovery for U.S. agriculture and financial
outlook of each major sector moving forward.
EXECUTIVE SUMMARY

                                    E XE C U T I V E

                                SUMMARY
                       The whirlwind of 2020 led to extreme
                volatility that permeated through all sectors of
                American agriculture. From a global pandemic
                       to a new presidential administration,
                AgAmerica’s Chief Economist Dr. John Penson
                     has kept a close eye on the U.S. economic
                climate in relation to its impact on our nation’s
                     farmers and ranchers. In this assessment,
                we reflect on the resilience of U.S. agriculture
                    in 2020 and provide insights into how major
                     agricultural commodities will fare in 2021.
TA B L E O F

CONTENTS
The Road to Economic Recovery                         4
2020 Agricultural Recap                               4

Looking Ahead to U.S. Agriculture in 2021             6
Major Initiatives for 2021 U.S. Agricultural Policy   6

Economic Outlook on U.S. Farmland Values              20

Economic Deep Dives for Major Agriculture
Commodities                                           21
Livestock                                             21
Corn                                                  23
Soybeans                                              25
Cotton                                                27
Fruits & Vegetables                                   29
Timber                                                31

Farm Financials in 2021                               33

The Age of Agricultural Enlightenment                 35
PA R T O N E

      THE ROAD TO ECONOMIC RECOVERY
      2020 RECAP
      The abrupt shift in consumer demand caused by the COVID-19 pandemic was an unparalleled
      event in modern history. Consumers are normally at the receiving end of events impacting supply
      in farm commodity markets. The effects of surpluses or shortages of farm production are passed
      upstream through intermediaries (gold arrows) in the nation’s food supply chain to consumers in
      the form of prices and availability.

                          P R O D U C T F L OW I N U . S . F O O D S U P P LY C H A I N *

                                                                                                    SERVERS

                                                                 DISTRIBUTORS
                                                                                                    BEVER AGE
                                    PROCESSORS                                                      SER VI CES
                                                                   WAR EH OUSES
                                         FIRST                                                        FOOD
                                       HANDL E RS                                                   SER VI CES
             FA R M ERS                                            WH OLESALER S                                               CONSUMER S

                                   MANUFACTURERS                                                  R ETAI L FOOD
                                                                                                     STOR ES
                                                                     EXPORT ER S
                                                                                                      FOOD
                                                                                                      BAN KS

               *Graph represents a simplified view of the main product flows in the chain. It excludes direct sales from farmers to consumers.

      The major change in consumer demand experienced last year sent shock waves downstream
      to distributors, processors, and farmers (red arrows). The stay-at-home orders in mid-March
      increased the consumption of food at home. According to the USDA, consumers spent just
      over 28 percent less on food “away from home” in March 2020 than the year prior. In fact,
      the amount spent eating out was the lowest since 1997. Processors and distributors in the food
      supply chain attempted to pivot from these institutional buyers to focus more on demand at
      retail grocery stores. This transition was difficult for a variety of reasons, including product
      size packaging. The disruptions at the processor and distribution level were ultimately passed
      downstream to farmers and ranchers, and were particularly devastating for time-sensitive
      products like milk, meat, and fresh produce.

ECON OMI C R ECOVE RY                                                                                                                            4
COMMODITY SECTOR PERFORMANCE SNAPSHOT IN 2020
LIVESTOCK
As the virus spread to workers in meat and poultry processing plants,
some workers became ill while other workers refused to work for fear
they would also contract the virus. Labor shortages caused by the
virus prompted processing plants to shut down and reconfigure their
operations to mitigate infection. Fewer animals were processed, causing
inventories on farms to swell.
F R U I T S & V E G E TA B L E S
Cancellation of fruit and vegetable orders by institutional buyers meant
produce was left rotting in fields and subsequently plowed under. Fast
food vendors canceled orders for potatoes. Contracts for leafy green
produce and fruit were canceled by restaurants, hotels, and schools. Since
harvesting costs are almost the same as production costs, many producers
made the difficult decision to plow under a large portion of their crop.
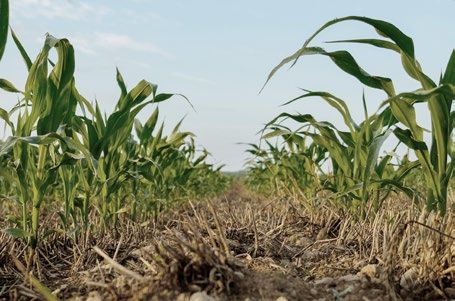
C O R N , S OY B E A N S , & C O T T O N
The combination of lower production due to adverse weather events and
the strong finish in export demand translated into low stock-to-use ratios
for commodities like corn, soybeans, and cotton. Fourth quarter prices
for these three key commodities had not been seen since the 2013/2014
marketing year which reflected the major drought in 2012.
DAIRY
In the initial phases of pandemic, the dairy farmers were forced to dump
millions of gallons of milk because processing plants that pasteurize and
package milk, faced order cancellations due to restaurant and school
closures. This pertained not only for milk but also cheese, butter, and ice
cream products.
P O U LT R Y
There were reports of chickens on farms geared toward liquid egg
production being euthanized because an upstream liquidizing plant shut
down and farmers were not equipped to switch to whole egg sales.
ECON OMI C R ECOVE RY 5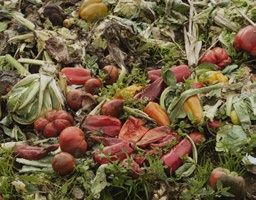
PA R T T WO

        LOOKING AHEAD TO U.S.
        AGRICULTURE IN 2021
        As several COVID-19 vaccinations have since been developed and distribution is in
        progress nationwide, there is optimism that virus spread will slow and business restrictions
        will ease. However, the abrupt disruption will likely have lasting impacts on our food supply
        chain, particularly, in the realm of digitalization–from the rise of e-commerce to increased
        use of precision ag technology. This, combined with a new presidential administration with
        their own set of policy priorities, will translate to an accelerated era of sustainable,
        climate-smart agriculture.

        A NEW ADMINISTRATION: MAJOR AGRICULTURAL
        POLICY INITIATIVES IN 2021
        Uncertainty surrounded us in 2020—from export trade to the pandemic—and will likely linger
        into 2021 with a new administration in the White House and a new set of policy agendas. Four
        major agricultural initiatives beyond COVID-19 have been pushed into the limelight that will
        likely shape ag policymaking past 2021.

                 C L I M AT E          GLOBAL             FA R M L A B O R &         FEDERAL
                 CHANGE                 TRADE              I M M I G R AT I O N        AID
                                     R E L AT I O N S          REFORM

U. S . AGR I CULTUR E I N 202 1                                                                         6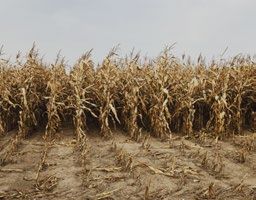
INSIGHTS & OUTLOOK

                                       2021 GENERAL U.S. ECONOMY

        Before diving into market specifics, here are several data-driven assumptions regarding the U.S.
        economic landscape at large:

               I N T E R E S T R AT E S                       D O L L A R VA L U E
               Interest rates are expected to remain          The value of the dollar against major
               relatively low throughout the year as          currencies will remain relatively weak due
               inflation pressures remain muted despite       to the large current account trade deficit and
               the substantial increase in national           other economic, financial, social, and political
               debt. While the recently-passed American       conditions in the U.S. in comparison to our
               Rescue Bill Act of 2021 has boosted            major trading partners. A weaker dollar
               economic growth trends and stalled the         makes imports more expensive to U.S. buyers,
               dwindling rate environment, rates are still    but enhances the competitiveness of U.S.
               lower than pre-COVID averages.                 goods in overseas markets.

               G D P G R OW T H R AT E                        CONSUMER DEMAND
               The nation’s GDP growth rate is expected       Consumer demand will grow as vaccination
               to be in the 6.5 percent range in 2021 after   distributions increase and consumers feel
               a 3.5 percent contraction in 2020. This will   more comfortable about venturing out to
               return real GDP to where it stood before       restaurants, shopping malls, and other venues.
               the pandemic began. Much of this growth        The personal savings rate in the fourth quarter
               is expected in the second half of the year     of 2020 was 13.4 percent compared to 7.3
               on the assumption that the vaccine rollout     percent a year earlier. This should support
               reaches most of the population by then.        greater consumer spending in 2021.

               U N E M P L OY M E N T R AT E                  E-COMMERCE
               The unemployment rate at the start of the      E-commerce has grown to account for
               year was 6.7 percent and has dropped to        more than 10 percent of total grocery
               6.2 percent as of March 2021. This is much     spending and will likely remain a
               lower than the 2020 unemployment peak of       prominent fixture of the food supply chain
               14.7 percent back in April 2020 but nearly     long after the pandemic has ended.
               twice as high as the 3.5 percent average at
               the end of 2019.

U. S . AGR I CULTUR E I N 202 1                                                                                  7
1

                                                      F I R S T I N I T I AT I V E

                                                  CLIMATE CHANGE

        U.S. agriculture is particularly vulnerable to the impacts of climate change as severe weather
        fluctuations—from West Coast wildfires to arctic temperatures in Texas—make it more difficult
        for crops to grow and increase susceptibility to pests and diseases. President Biden has taken a
        strong stance on mitigating the impacts of greenhouse gas emissions on our planet’s atmosphere
        and designated U.S. agriculture as a key player in joining the fight.

                    J U LY 1 4 , 2 0 2 0
                    Presidential Nominee Joe Biden announces his $2 trillion climate plan.

                    DECEMBER 22, 2020
                    Presidential Nominee Joe Biden introduces the members of his climate change taskforce.

                    JANUARY 20, 2021
                    President Biden releases an executive action that involves:
                       • Rejoining the Climate Accord
                       • Reestablishing the interagency processes that worked towards measuring the social cost of
                         carbon and methane.
                       • Directing the Secretary of Agriculture to collect input from farmers and ranchers on how to
                         implement federal programs that will encourage the voluntary adoption of climate-smart ag
                         practices, while generating new jobs for rural Americans.

                    MARCH 11, 2021
                    Members of the Senate Ag Committee hold their first hearing on farming and
                    climate change.

                    APRIL 22, 2021
                    President Biden plans to host a Leaders’ Summit on Earth Day to reconvene the Major
                    Economies Forum.

        The most-discussed strategy to encourage the adoption of climate-friendly farming practices is
        the use of carbon banks. The new U.S. Department of Agriculture Secretary Tom Vilsack used
        the term “ag carbon bank” during his confirmation hearing to explain the process of paying

U. S . AGR I CULTUR E I N 202 1                                                                                        8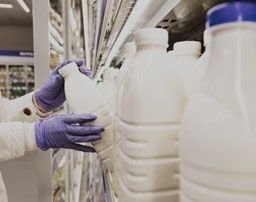
farmers who adopt certified carbon sequestration practices, such as minimal-till methods and
        cover crops. Secretary Vilsack suggested the Commodity Credit Corporation (CCC) could
        finance this effort.
        The flexibility of this USDA agency has supported farmers through the Great Depression
        and—most recently—through retaliatory trade wars and COVID-19. Implementing a carbon
        bank would be in addition to its role of distributing safety net payments under 2018 Farm Bill
        programs, such as the ARC and PLC. Expansion of the $30 billion cap will be needed to finance
        the carbon bank initiative without taking funds away from existing programs. Other concerns
        include regional inequality based on the sequestrating potential of soil and a lack of incentives for
        early adopters who are already implementing these practices on their farms.

               “I think agriculture is probably the first and best place to begin
              getting some wins in this climate area. Farmers are prepared for
                 it. Farmers are anxious to do it. If it’s voluntary, if it’s market-
                    based, if it’s incentive-based, I think you will see farmers,
                        ranchers, and producers cooperate extensively.”

                                                TOM VILSACK
                                              U S D A S E C R E TA R Y

U. S . AGR I CULTUR E I N 202 1                                                                                 9
FA C T S H E E T
CLIMATE-SMART AGRICULTURE
3 OUT OF 10 FARMERS 22% ACTIVE
Farmers who know about carbon Aware farmers who are in
capture payments. active discussion about carbon
capture payments.
51% 70% CROPLAND 53 MILLION CARS
Farmers planning to The adoption of just two regenerative Equivalent amount of cars
use more conservation practices—cover crops and no-till— removed from the road if
practices. on 70 percent of America’s cropland. adoption is made.
9.9% -4%
100%
3.8%
NEGATIVE 4%
Possible total U.S. GHG emissions
56% DEFICIT 6.1% REDUCTION and a carbon sink potential for U.S.
The fresh water Possible total U.S. greenhouse agriculture by 2035 with increased
deficit the world gas (GHG) emission from investments and partnerships
faces by 2030 if no 9.9 percent by 2025 with across the food and agriculture
water conservation widespread adoption of climate- value chain and integration of
action is taken. smart agriculture practices. promising frontier technologies.
U. S . AGR I CULTUR E I N 202 1 102
S E C O N D I N I T I AT I V E
GLOBAL TRADE RELATIONS
The Phase One trade agreement between the U.S. and China that was signed in January of last
year, called for $36.5 billion in purchases of agricultural products by China in 2020. This goal,
specified in dollars, was already ambitious given the low U.S. commodity prices early in the year
and even more difficult to obtain once COVID-19 hit.
C H I N E S E I M P O R T S O F U . S . A G R I C U LT U R A L P R O D U C T S
BILLION
$35
$30
$25
$20
$15
$10
$5
0
2000 02 04 06 08 10 12 14 16 18 20
ACTUAL INITIAL TARGET
Source: U.S. Department of Agriculture (USDA)
Chinese purchases by the end of 2020 approached two-thirds of this initial target. Even so,
total agricultural exports to China in 2020 were the highest since 2017, before the tariff war
between China and the U.S. began. U.S. exports to China are estimated to increase to $31.5
billion in 2021—a $4.5 billion jump from the November 2020 forecast.
Recent remarks by the USDA’s Chief Economist Seth Meyers indicate the USDA’s projection for
crop acreage and price forecasts is based upon China’s continued participation in the two-year
Phase 1 trade agreement signed last year. Meyers pointed to the sales already on the books for
2021 as evidence of the underlying demand for U.S. agricultural imports and that China will
follow through with those purchase commitments. Time will tell.
U. S . AGR I CULTUR E I N 202 1 11The total U.S. goods and services trade deficit increased $101.9 billion to $678.7 billion from
2019 to 2020. U.S. goods deficit increased six percent, while the U.S. services surplus decreased
by 17.5 percent. When singularly focused on agricultural goods, the U.S. narrowly achieved a
trade surplus of $2.65 billion for total agricultural trade despite historic disruption to the global
supply chain. However, the surplus was not felt universally as some ag commodities fared better
than others.
U . S . AG R I C U LTU R A L T R A D E S U R P LU S & D E F I C I T S F R O M
2 0 1 9 TO 2 0 2 0 ( I N M I L L I O N S )
2019
-10% -5% 5% 10% 15% 20% 25% 30%
S OY B E A N S $19,642 $26,921
CORN $8,620 $10,159
DAIRY & EGG
$4,961 $5,454
PRODUCTS
M E AT &
$20,502 $20,502
P O U LT R Y
W H E AT $ 6 , 41 3 $6,467
WINE & BEER $2,034 $2,164
V E G E TA B L E S $6,822 $ 7, 0 2 1
FRUITS $8,118 $8,403
NUTS $9,278 $9,844
Source: USDA Agricultural Trade Data Update
U. S . AGR I CULTUR E I N 202 1 12U . S . A G R I C U LT U R A L T R A D E F O R E C A S T I N 2 0 2 1
Moving forward, the Biden administration plans to take a tough stance on trade with China and
keep many Trump-era tariffs intact. Collaboration and engagement with historic allies will also be
an important piece to watch when monitoring the state of U.S. trade in 2021. The incoming trade
team is stacked with linchpins, such as U.S. Trade Representative Katherine Tai—the chief trade
lawyer who was involved in the outline of labor provisions in the USMCA agreement and who
has already expressed support in enforcing the existing tract pact with Canada and Mexico. We
will continue to closely observe the U.S. ag trade landscape and provide updates throughout the
year as 2021 events unfold.
According to the latest USDA trade forecast, total U.S. agriculture exports are projected at a
record $157 billion this year with a trade surplus of $19.5 billion and up 14 percent from the
$135.7 billion recorded in 2020.
THE BULL PERSPECTIVE
Trade is off to a strong start in 2021 with record purchase
of U.S. corn by China, weak dollar, and less than ideal
weather conditions for South America crop production.
THE BEAR PERSPECTIVE
While the impact won’t be immediate, China has made it
clear that they are focused on food security self-reliance,
which could mean fewer U.S. imports over time. In
addition, a strong dollar and expanded production in
South America could affect international ag trade flows
and commodity prices.
U. S . AGR I CULTUR E I N 202 1 13O U T L O O K F O R U . S . A G R I C U LT U R A L E XP O R T S B Y R E G I O N
CANADA
$21 BIL JAPAN
EUROPEAN $12.4 BIL
UNION
$11.4 BIL
CHINA
MEXICO
$31.5 BIL
$19.5 BIL
> $20 BILLION
$10-20 BILLION
$5-10 BILLION
$1-5 BILLION
< $1 BILLION
Source: USDA, Economic Research Service and USDA, Foreign Agricultural Service analysis
and forecasts using data from U.S. Department of Commerce, Bureau of Census
“As we look ahead to 2021 with the Biden administration moving
forward on another stimulus, the U.S. economy is forecasted to
grow more quickly in the second half of the year, the U.S. will
import more, and the trade deficit is likely to rise again. Slow
recovery in other countries will weaken U.S. exports.”
M A R Y L OV E LY
A S E N I O R F E L L OW AT T H E P E T E R S O N
I N S T I T U T E F O R I N T E R N AT I O N A L E C O N O M I C S
U. S . AGR I CULTUR E I N 202 1 143
T H I R D I N I T I AT I V E
FARM LABOR & IMMIGRATION REFORM
The USDA Farm Labor Survey (FLS) went on quite the journey last year as proposed policy
changes postponed the release of the Adverse Effect Wage Rate (AEWR) and caused confusion
regarding the minimum wage farmers needed to pay H-2A workers in 2021. The FLS was
reinstated in court this past December, delaying the release of the AEWR until February 2021.
2 0 2 1 A DV E R S E E F F E C T WA G E R AT E
WA NH ME
VT
MT ND MN
OR MA
WI NY
ID SD RI
MI
WY CT
PA NJ
IA
NE OH DE
NV IL IN
MD
UT WV
CO VA
KS MO KY
CA NC
TN
OK AR SC
AZ
NM
MS AL GA
LA
TX
HI
FL
$16.34 $11.81
Source: USDA Farm Labor Survey
Upon its release, annual national average gross wage rates for farmworkers are expected to
increase 4.5 percent to $14.62. On a regional basis, the state with the highest wage increase was
California at 8.7 percent to $16.05 an hour. States in the Delta and Southeast regions experienced
the lowest wage increases. Wage rates increased less than one percent in states like South
Carolina, Georgia, Alabama, Mississippi, Arkansas, and Louisiana.
U. S . AGR I CULTUR E I N 202 1 15FA C T S H E E T
U.S. FARM LABOR
NEARLY HALF THREE-QUARTERS 4% U.S. CITIZENSHIP
Crop farmworkers U.S. farm labor workforce Immigrant farmworkers who have
who lack legal status. who are immigrants. been able to obtain U.S. citizenship.
10.3%
THIRD-HIGHEST EXPENSE
100%
Labor accounts for 10.3 percent
of average input costs.
2 MIL
TWO MILLION HIRED WORKERS
The estimated amount needed
to maintain production.
LEGAL STATUS OF HIRED CROP FARMWORKERS , FISCAL 1991-2016
PERCENT
100
75
50
25
0
1991 94 97 00 03 06 09 12 15
U.S. BORN FOREIGN BORN, U.S. CITIZEN
FOREIGN BORN, AUTHORIZED FOREIGN BORN, UNAUTHORIZED
Source: USDA ERS
U. S . AGR I CULTUR E I N 202 1 16WHAT DOES ALL THIS MEAN FOR AMERICAN FARMERS AND RANCHERS?
Input costs associated with labor will likely rise in 2021 but will hopefully be offset by higher
market prices. On the other hand, lower AEWR regions could have more difficulty finding
necessary labor for crop production. Just as regions influence the gravity of impact, commodity
type will also influence the impact it will have on a farm operation. The variability of wage
increases for crop and livestock farmworkers is high, ranging from nine to 35 percent over the
last five years. Fruit and vegetable growers are historically more sensitive to changes in farm labor
policy due to their labor-intensive nature. This is discussed further in the commodity deep dive.
Considering a large majority of U.S. farm labor is comprised of immigrant workers, the industry
is sensitive to changes in immigration policy—a major initiative in the new administration.
On January 20th, 2021, President Biden signed an executive order that aimed to strengthen the
incentives and protections for essential immigrant workers and “dreamers”—undocumented
immigrant children. This legislative bill proposes a fast-tracked path to citizenship for
undocumented residents and temporary visa farmworkers. Undocumented farmworkers in the
U.S. would be able to gain legal status upon passing a criminal background check and showing
they worked at least 100 days in agriculture for four out of the last five years. In addition, it
authorizes increased funding for border security to expedite the screening process and increase
identification of narcotics and other contraband at all ports of entry.
Farmers who are impacted by these programs generally support a path to citizenship for migrant
farmworkers. Those who participate in H-2A often work alongside the same workers year after
year and consider them to be an extension of their family, while understanding how vital they are
to the success of their farm operation. In addition to a path to citizenship, many farm groups are
encouraging an expansion of the H-2A program to increase access to foreign labor. One concern
of this bill is that newly legalized workers would leave agriculture for other jobs, in turn, putting
farmers in a difficult spot to secure necessary labor.
A multilateral examination of immigration reform is necessary to develop policies that
benefit the agricultural community as a whole, without straining an already volatile yet
essential industry.
U. S . AGR I CULTUR E I N 202 1 174
F O U R T H I N I T I AT I V E
FEDERAL AID
The farm sector ended 2020 with a record high net farm income of $121 billion. However, that
number doesn’t convey the full story. While net farm income excluding farm program payments
did rise in 2020 as shown in the left-hand graph below, a significant portion of total net farm
income in 2020 were ad hoc payments. Ad hoc payments refer to one-off payments for temporary
situations—like the Market Facilitation Program (MFP) and the Coronavirus Food Assistance
Program (CFAP)—as opposed to the safety net programs, such as the Agricultural Revenue
Coverage (ARC) and Price Loss Coverage (PLC) programs.
NET FARM INCOME MINUS AD HOC PAYMENTS AS SHARE OF
GOVERNMENT PAYMENTS TOTAL GOVERNMENT PAYMENTS
BILLION PERCENT
$120 80
$100
60
$80
$60 40
$40
20
$20
0 0
2011 14 17 20 2011 14 17 20
Source: USDA ERS Data
The $900 billion COVID-19 relief package that passed at the end of 2020 includes $13 billion
in discretionary funding for agriculture, with $11.2 billion being allocated to the Secretary of
Agriculture for direct assistance to agriculture. In late January, the USDA froze $2.3 billion of
this funding to review the rules that governed its distribution. A major target of that funding
was contract poultry and livestock producers. The new administration may redirect some of this
funding to farmworkers and smaller food processors elsewhere in the food supply chain, but that
has yet to remain seen.
The $1.9 trillion COVID-19 relief legislation recently passed has roughly $16 billion in specific
funding implications for the USDA. Approximately 35 percent or $3.6 billion of this funding is for
food purchases and distribution efforts. The bill also incorporates targeted benefits to minority or
socially disadvantaged farmers, including $4 billion in debt forgiveness, $1 billion in outreach and
support, and $5 million in educational support.
U. S . AGR I CULTUR E I N 202 1 18FA C T S H E E T
FEDERAL AID
$36.1B $36.1 BILLION
Supplemental ad hoc payments in
2020 that did not require repayment.
$46.5B $46.5 BILLION
Total federal payments made to
U.S. farmers and ranchers in 2020.
$6.1B $6.1 BILLION
Total PLC and ARC payments in 2020.
$15B $15 BILLION
The estimated amount of
CFAP payments in 2021.
AGRICULTURAL PROVISIONS OF AMERICAN
RESCUE PLAN (MILLION DOLLAR)
AD HOC
Made up 77% of
total government $ 1 0 . 4 B I L L I O N T O TA L
- DEBT FORGIVENESS FOR
payments in 2020. SOCIALLY DISADVANTAGED
FARMERS, 39%
- ANIMAL SURVALLENCE, 2.9%
- FOOD PURCHASES &
DISTRIBUTION EFFORTS, - OVERTIME INSPECTION COST
PANDEMIC RESPONSE, 35% REDUCTION, 1%
- OUTREACH & SUPPORT FOR - ADMINISTRATION, 0.5%
SOCIALLY DISADVANTAGED
FARMERS, 9.5% - EDUCATION SUPPORT FOR
50% DECLINE - FOOD FOR PEACE, 7.7%
SOCIALLY DISADVANTAGED
FARMERS, 0.05%
The 2021 estimation
- RURAL HEALTH CARE - INSPECTOR GENERAL, 0.02%
of government GRANTS, 4.8%
payments. Source: American Farm Bureau Federation
U. S . AGR I CULTUR E I N 202 1 19ECONOMIC OUTLOOK ON U.S. FARMLAND VALUES
Historic federal government aid transformed what was to be a below-average year to one that
achieved a record level net farm income, enhanced debt repayment capacity, and strengthened
farmland values.
2 0 2 0 C R O P L A N D VA L U E B Y D O L L A R P E R A C R E
WA NH ME
VT
MT ND MN
OR MA
WI NY
ID SD RI
MI
WY CT
PA NJ
IA
NE OH DE
NV IL IN
MD
UT WV
CO VA
KS MO KY
CA NC
TN
OK AR SC
AZ
NM
MS AL GA
LA
TX
FL
> 8,000
5,701 - 8,000
3,601 - 5,700
2,601 - 3,600
< 2,600
NOT PUBLISHED DUE TO INSUFFICIENT REPORTS
Source: USDA NASS; August 6, 2020
On a national level, cropland values as of August 2020 were equal to values one year prior. The
stability of land values contradicts the extreme variability seen in the farm sector in 2020. Many
farmers are using the record level net farm income as an opportune time to pay down debt, build
liquidity, modernize their machinery and equipment, or expand their operations. Rural real estate
companies in the Corn Belt and Northern Plains regions of the map above reported a 35 percent
increase in farmland sales in the fourth quarter of last year, citing farmer demand and investor
interest in this stabilizing and finite asset.
As interest in rural land investment increases in 2021, expect to see 5 to 10 percent
appreciation in cropland values, particularly where corn and soybean production
are prevalent.
U. S . AGR I CULTUR E I N 202 1 20PA R T T H R E E
ECONOMIC DEEP DIVES FOR MAJOR
AGRICULTURE COMMODITIES
LIVESTOCK
As seen in media headlines earlier in 2020, processing plants were forced to shut down operations
after they became virus hotspots. Workers were able to return once processing plants restructured
operations and facilities were sanitized to ensure worker safety. The highly concentrated structure
of the meat processing industry bottlenecked supply, creating devastating consequences for
livestock farmers and ranchers.
20% INCREASE 5.98% DECREASE
Calf prices rose from 2020 summer Cattle and calves cash receipts.
lows in December 2020, and were
roughly equal to one year earlier.
5.15% DECREASE
18% INCREASE Hog cash receipts.
Fed cattle prices closed the year with
a rise from summer lows, but still 8
percent lower than one year earlier. 23.72% DECREASE
Broilers cash receipts.
$13 BILLION
Cattle industry's estimated ”AT HOME” DINING
economic impact. Turkey cash receipts finished higher
in 2020 thanks to "at home" dining
this past Thanksgiving.
$5 BILLION
Hog industry estimated loss.
COMMODI TI E S DE EP DIVE 21BEEF COW INVENTORY, JANUARY 1ST FED CATTLE MARKET TRENDS
MILLION MILLION 5-AREA
HEAD HEAD DISTRICT
34 40 $180
32 30 $135
30 20 $90
28 10 $45
26 0 0
2000 03 06 09 12 15 18 21 2000 03 06 09 12 15 18
- CATTLE SLAUGHTER - FED STEER PRICES
Source: USDA Source: USDA
While cattle ranchers continue to show remarkable tenacity and market prices are improving,
disruptions to the beef industry will likely carryover to 2021. Total beef cow inventory on January
1st was 31.2 million head—one percent below last year. Steers weighing 500 pounds and over as
of January 1st totaled 16.6 million head—up slightly from the start of 2020. The USDA WASDE
April report forecasts higher beef production this year, driven by heavier weights in the first half
of the year. Higher placements in the first half of the year will lead to greater marketings in the
second half. Higher feed cost driven by corn prices will also lead to higher feedlot ration costs as
well as supplemental feed costs for cow-calf and stocker operations which could influence market
weights at slaughter.
The USDA WASDE April report also projected higher steer prices in the second half of 2021, up
10 percent from one year earlier despite a slight decline in per capita consumption. The weekly
weighted average direct price is expected to reach $116 per hundred pounds (cwt) in the fourth
quarter as opposed to $108 one year earlier. The June 2021 futures price for live cattle is $125.28
while the August 2021 feeder cattle piece is $161.88.
2021 LIVESTOCK MARKET OUTLOOK
Livestock and poultry will experience higher feed costs in 2021. Consumer demand for food
away from home will decide the breadth of profit margins farmers and ranchers will experience
this year. The continuation of drought conditions in the Southwest and Western half of the
country could affect pasture conditions and the cost of forage for cow-calf operations.
COMMODI TI E S DE EP DIVE 22CORN
From severe weather events to record-setting exports, U.S. corn experienced historic volatility in
2020 that made it nearly impossible for farmers to plan ahead. Corn farmers have experienced
years of a weak market as the price of corn had drifted below $4.00 per bushel since 2013. The
stock-to-use ratio peaked in 2017 due mostly to overproduction in the industry. In 2020, although
ethanol demand plummeted because of COVID-19, corn export demand skyrocketed. Prices
began to rally as supply dwindled. While they have not reached the record high of $6.98 per
bushel seen in 2012, they are drifting towards the same trend of low stock and high market prices
that were seen during that year.
Recent executive orders signed by President Biden during his first week in office included
revoking the permit for the Keystone XL pipeline, pausing oil and gas leases on federal lands and
waters, promoting federal use of electric vehicles, and rejoining the Paris Climate Accord—all of
which signal a future reckoning for the fossil fuel industry. This has direct implications for the
ethanol industry and corn markets indirectly, which accounts for one-third of total corn usage.
On the other hand, the last week in January saw a series of sales to China that broke the record
on weekly sales dating back to 1991. Significant problems with dry weather in South America
delayed planting and reduced their crop forecast by one to two million metric tons, strengthening
export demand for U.S. growers.
M A R K E T Y E A R AV E R A G E P R I C E O F C O R N
PER
RATIO BUSHEL
0.200 $8
0.150 $6
0.100 $4
0.050 $2
0 0
2005 08 11 14 17 20
/2006 /09 /12 /15 /18 /21
STOCK-TO-USE RATIO PRICE OF CORN PER BUSHEL
Source: USDA
COMMODI TI E S DE EP DIVE 230.092 S/U 14 .2 BILLION BUSHELS
Current stock-to-use ratio (S/U) is the Corn trend line yield for total
lowest we have seen in six years. production this coming season.
$4.30 MY PRICE 5.86 MILLION METRIC TONS
A seven-year high projected price for A record purchases of corn by Chinese
2020/2021 Market Year (MY) by the buyers at the end of January, which
April USDA WASDE report. instantly doubled the amount purchased
in the 2019/2020 MY.
91.1 MILLION ACRES
Corn acres planted in 2021 is expected
to be near or slightly above 2020 acres.
2021 CORN MARKET FORECAST
Tight stocks and high prices are creating a bidding war between corn and soybeans. Look for
a second year of low stock-to-use ratios and higher average price if the export demand for
corn stays high. Unpredictable weather events will be a deviating factor. Adverse weather—as
seen in recent years—could lower crop yields and push market prices higher. The USDA is
forecasting a record 178 million acres planted to corn and soybeans this year, up 7 percent
from last year.
COMMODI TI E S DE EP DIVE 24SOYBEANS
Soybeans followed a similar pattern as corn, experiencing volatility as COVID-19 emerged,
ending the year with strong prices due to significant exports to China. The Phase One agreement
with China indicates even greater ag purchases in 2021. Soybeans are expected to be a significant
portion of these purchases as China strives to rebuild its hog herds. Crushed soybean meal
is in short supply around the world due to below average rainfall in South America. Strong
global demand combined with a dwindling supply bodes well for U.S. soybean farmers as prices
continue to increase. However, these higher prices will translate to higher feed costs for livestock
producers, as previously discussed.
M A R K E T AV E R A G E P R I C E O F S OY B E A N S
PER
RATIO BUSHEL
0.250 $16
0.150 $12
0.100 $8
0.050 $4
0 0
2002 05 08 11 14 17 20
/2003 /06 /09 /12 /15 /18 /21
STOCK-TO-USE RATIO FARM PRICE PER BUSHEL
Source: USDA
COMMODI TI E S DE EP DIVE 257.46% INCREASE 2.6% S/U
Soybean cash receipts in 2020. Stock-to-use ratio for the 2020/2021
MY, the lowest recorded since the
2013/2014 MY.
83.1 MILLION ACRES
Soybeans farmers planted in 2020,
yielding a total production of 4.14 $11.25
billion bushels. The WASDE report estimated price
for soybeans in the 2020/2021 MY.
30% ABOVE
Percentage above last year's market $8.57
year (MY) price of soybeans projeced Average annual price for prior
in the April WASDE report, highest market year.
since 2014.
FUTURE QUOTES
UP 4.6 MILLION ACRES
Future quote for May 2021 soybeans
Estimated 87.6 million acres of
contracts is $14.06. November 2021
soybeans planted in 2021, up from
contracts are priced at $12.68.
83 million last year.
UP $6.5 BILLION
USDA trade outlook that predicts
U.S. soybean exports to a record
$25.7 billion in 2020 MY.
2 0 2 1 S OY B E A N M A R K E T F O R E C A S T
Increasing demand and decreasing supply has led to a seven-year high for soybean prices.
Some analysts predict MYA prices will climb as high as $13 per bushel which is a stark
comparison to the initial 2020 USDA prediction of $8.20 reported back in May of last year.
Look for as much as 6 percent more acres planted to soybeans this year compared to last.
COMMODI TI E S DE EP DIVE 26COTTON
The drop in cotton production in the U.S. over the past couple of years has resulted in an increase
in market prices for farmers. This year, the global cotton production forecast declined 6.5 percent,
the lowest output in four years. U.S. cotton exports are estimated to account for 35 percent of the
global total as competition continues to increase. Comparatively, China and India are expected to
account for more than half of global cotton production.
M A R K E T Y E A R AV E R A G E P R I C E O F C O T T O N
PER
RATIO POUND
0.60 $100
0.48 $80
0.36 $60
0.24 $40
0.12 $20
0 0
2005 08 11 14 17 20
/2006 /09 /12 /15 /18 /21
STOCK-TO-USE RATIO PRICE OF COTTON LINT PER POUND
Source: USDA
COMMODI TI E S DE EP DIVE 27DOWN 7.82% 81 CENTS
Cotton cash receipts were down in Futures estimated price for July
2020, reflecting fewer acres planted 2021 cotton.
than seen in the past two years.
14% INCREASE
0.216 S/U Global cotton domestic use in
Stock-to-use ratio for cotton in the 2020/2021 MY is projected at 117.2
2020/2021 MY, a 47% drop from last million bales, up from last year.
year's ratio of 0.41.
7% DECREASE
68 CENTS PER POUND
Global cotton production in 2020/2021
The MY average price for cotton MY is forecasted at 114.1 million bales,
projected in the April WASDE report, down from last year.
14% higher than last year.
2021 COTTON MARKET FORECAST
Tighter stocks have led to a 14 percent increase in cotton prices and are predicted to
increase even further in the coming year due to global higher use relative to production.
These higher prices are expected to generate greater competition in the global market for
U.S. cotton farmers.
COMMODI TI E S DE EP DIVE 28FRUITS & VEGETABLES
Labor availability impacted a large majority of specialty crop farmers—such as strawberries,
peaches, leafy greens, and more—and continues to do so going into 2021. As discussed in the
immigration reform section earlier, seven out of 10 farmworkers are born outside of the United
States. Many of these workers travel on work visas to help American farmers with planting and
harvesting. COVID-19 made traveling more complicated and some refused to do so altogether to
avoid potential virus contraction.
As many commodities fall within the fruits and vegetables category, not all were impacted the
same. For example, retail sales of fresh potatoes experienced a record growth in the fourth
quarter, as did melons and nuts. However, price declines for cantaloupes, celery, and onions more
than offset the increases for more fortunate commodities. The perishable nature of these products
makes them highly susceptible to disruption—whether it’s sudden shifts in our food supply or
limited access to necessary farm labor.
E S T I M AT E D P R O D U C T I O N L O S S E S , B Y C O U N T Y
WA
NH
MT ND VT ME
MN
OR
ID WI NY MA
SD
WY MI RI
CT
IA PA
NE NJ
NV OH
IL IN DE
UT
CO WV MD
VA
KS MO KY
CA
NC
AZ TN
OK
NM AR SC
MS GA
AL
LA
TX
FL
> $1,000,000
$100,000 - $1,000,000
$10,000 - $100,000
$0 - $10,000
Source: USDA NASS
COMMODI TI E S DE EP DIVE 293.7% INCREASE 16.5% INCREASE
Vegetable and melon cash receipt Fruits and nuts cash receipt increase by
increase from 2019 to 2020. the end of 2020.
12% & 8.2% INCREASE $12 TO $48 MILLION
Fresh potatoes were up 12 percent in Total fruit and vegetable crop losses
dollar sales, and 8.2 percent in volume tied to labor shortages were estimated
at the end of 2020 when compared to to range from $12 million in a
the same time in 2019. conservative economic model to as
much as $48 million in the extreme
scenario.
$22 MILLION
Estimated fruit and vegetable losses
in California.
In 2021, produce packaging will become an important issue for consumers. Farmers will be
pressured to balance product quality, food safety, and sustainability. With the exception of the
federal crop insurance program, specialty crops lack support in the farm bill safety net and are
also being challenged by increasing imports from Mexico. Agriculture Secretary Tom Vilsack
has acknowledged these challenges and tossed around the idea of “food hubs”, which would
essentially allow specialty crop farmers to market directly to schools and other institution buyers
as a means of adding more flexibility to the food supply chain moving forward.
The artic blast in mid-February caused temperatures to fall in the Southern Plains over a six-day
period, in some cases breaking records dating back to 1895. Reports suggests that 100 percent of
Texas' unharvested orange crop was destroyed. It is also estimated that much of the unharvested
grapefruit crop is lost as well. The question is how much permanent damage has been done to
the trees. The preliminary estimate of the loss to Texas citrus alone is $305 million. Other fruit
trees that had emerged from dormancy are also susceptible to damage and any active buds are
likely lost. The effect on leafy green vegetables like spinach and other crops like potatoes suffered
considerable damage as well.
2 0 2 1 F R U I T S & V E G E TA B L E S M A R K E T F O R E C A S T
The outlook for 2021 will be heavily influenced by several factors, including school openings
and further easing of restrictions on the restaurant industry. The lasting impacts of recent
severe weather events also plays a role. Immigration policy reform will affect labor supply for
this sector as well. Increases in minimum farmworker wage rates will impact these farmers as
labor costs represent the majority of fruit and vegetable production costs.
COMMODI TI E S DE EP DIVE 30TIMBER
The timber industry experienced significant volatility in 2020. The hoarding of tissue paper and
towel products when stay at home orders were instituted caught the industry off guard. Home
construction declined at the onset of the virus, which led some lumber producers to cut back
their operations or cease production altogether. When mortgage interest rates fell sharply as
the Federal Reserve cut interest rates to near zero to stimulate the economy, the home building
market and home remodeling market began to pick up steam.
M A R K E T L E A D I N G S O F T WO O D 2 X4 D I M E N S I O N L U M B E R P R I C E T R E N D S
DOLLARS
$1,000
$900
$800
$700
$600
$500
$400
$300
MAY 2020 JUL 2020 SEP 2020 NOV 2020
HEM/FIR KD INLAND DOUGLAS FIR GREEN SYP KD EAST
STD&BTR 2X4 STD&BTR 2X4 #2&BTR 2X4
Source: 2020 Madison’s; Forest2Market
$847 BFM 31%
May 2021 futures prices for thousand Commercial construction contractors in
board foot (BFM) of lumber. 2020 who reported shortage of lumber,
compared to 11 percent in 2019.
$580 BFM 41%
Comparatively the fourth Contractors who say less availability
quarter average. of building products and materials is a
severe consequence of the pandemic.
COMMODI TI E S DE EP DIVE 31By early summer, there was significant shortage of lumber. The price of Southern Yellow Pine
(SYP) as well as Hem Fir and Douglas lumber reached historic highs in September, more than
double the prices seen before the pandemic began. Lumber prices fell somewhat from the
September high, but high prices and lengthy delays in availability continued to characterize the
timber industry in the fourth quarter of 2020.
2021 TIMBER MARKET FORECAST
The Southern Yellow Pine (SYP) lumber price has risen sharply in recent months and is on
track to reach the $1,000 BFM price recorded last September. The SYP lumber price for the
week ending January 22nd was $945 per BFM, 161 percent higher than the same time last
year. A strong demand for new home construction reflecting a shortage of existing homes on
the market, low mortgage interest rates, and mild weather the last quarter of 2020 leading to
increased construction activity. In turn, prices for SYP have been driven back up to the record
high levels seen last summer. This pent-up demand is expected to keep SYP prices high well
into 2021 as the pace of recovery in the general economy picks up in the second half of the year.
“The pandemic has exacerbated issues that contractors were already
facing in availability and cost of materials from tariffs and a shortage
of skilled workers. But there’s reason for optimism. More than one in
three contractors plan to hire more workers in the next six months,
and most see sufficient new business in the coming year.”
NEIL BRADLEY
U . S . C H A M B E R O F C O M M E R C E E XE C U T I V E
VICE PRESIDENT AND CHIEF POLICY OFFICER
COMMODI TI E S DE EP DIVE 32PA R T F O U R
FARM FINANCIALS IN 2021
In the face of historic disruption, farmers and ranchers ended 2020 strong, with an estimated net
farm income of $121 billion—a stark contrast to the $96.7 billion initially forecasted in February
2020. The USDA’s 2021 Farm Sector Income Forecast dropped its farm income forecast by eight
percent to $111.4 billion. Much of this decline is based on the assumption that government
payments will fall by 45 percent from 2020 historic levels.
FA R M F I N A N C I A L T R E N D S , I N B I L L I O N 1 9 7 0 D O L L A R S
REAL FARM REAL NET
EQUITY FARM INCOME
600 30
500 25
400 20
300 15
200 10
100 5
0 0
2000 01 02 03 04 05 06 07 08 09 10 11 12 13 14 15 16 17 18 19 20 21F
REAL FARM EQUITY REAL NET FARM INCOME
Source: USDA
Even so, forecasted net farm income expressed in real terms is the second highest since 2013
and fourth highest in the last two decades. The improving net farm income picture last year,
coupled with the expected net farm income in 2021, contribute to a gradual improvement in real
farm equity. Real farm equity has been remarkably resilient since 2014, despite declining net farm
incomes and low interest rates, thanks to relatively stable farmland prices. Net farm income last
year and 2021 forecast are also helping to build the liquidity positions of farmers and ranchers
after five years of decline from 2014 levels.
While some sectors are in a stronger position than others, the industry as a whole is looking
onward with optimism. In April, the Farm Capital Investment Index—a measurement of farmers'
willingness to buy equipment or upgrade their operation—stood at 88 points. This fell from the
record-high of 93 recorded earlier this year but is still a drastic difference from a year ago when
farmers' confidence in the ag economy plummeted to 54 points. Through a national lens, farm
balance sheets are strong and credit conditions are positive. While repayment rates are higher and
loan extensions are lower than a year prior for many American farm operations, true financial
conditions vary widely based on commodity and location.
FARM F I NANCI ALS 33FA C T S H E E T
FARMER SENTIMENT
63% INCREASE 60% OF FARMERS 22% INCREASE
Farmers' optimism to Listed paying down farm debts Farmers who expect
update operation compared or purchasing equipment as long-term appreciation
to March 2020. likely uses of extra income. of farmland values.
AG ECONOMY BAROMETER
INDEX
200
175
150
61% EXPECT 125
NO CHANGE 100
Respondents expect
interest rates to 75
MAR MAR MAR MAR MAR MAR
remain unchanged. 2016 17 18 19 20 21
FARMLAND PRICE EXPECTATIONS , 12 MONTHS AHEAD
RESPONDENTS
PERCENTAGE
60
40
20
34% EXPECT
GROWTH 0
JAN MAY MAY JAN JUL JAN JUL JAN
Respondents expect 2016 17 18 19 19 20 20 21
their operations to
HIGHER FARMLAND PRICES LOWER FARMLAND PRICES
grow five percent
or more in 2021. Source: American Farm Bureau Federation
FARM F I NANCI ALS 34PA R T F I V E
WELCOME TO THE AGE OF
AGRICULTURAL ENLIGHTENMENT
COVID-19 brought about a number of trials and heartaches, but it also ignited a fire of
appreciation for our domestic food supply chain system and the farmers that keep it going. These
trials accelerated technological advancements in the industry and the adoption of innovative
digital platforms to connect farmers to consumers. Local agriculture is gaining momentum
with each passing year and a new wave of omnichannel shoppers have emerged. Millennials and
Generation Z are stepping up and setting the stage for long-term consumer behavior patterns that
will become engrained into mainstream society for years to come.
As a champion for the American farmer, AgAmerica is committed to adapting to the evolving
needs of the industry. Founded with roots in agriculture, we are proud to offer a spectrum of
financing solutions that are singularly focused on agricultural land to support the long-term
success of farmers, ranchers, and rural landowners nationwide. Our flexible loan structures
empower our clients to reduce loan payments, purchase land, upgrade farm equipment, increase
working capital, and achieve their operational goals.
AG RICULTURAL E NLI GH T E N ME N T 35A B O U T A G A M E R I C A’ S C H I E F E C O N O M I S T
DR. JOHN PENSON
Dr. Penson is the Chief Economist
at AgAmerica Lending. He has held
the title of Regents Professor and
Stiles Professor in the Department
of Agricultural Economics at Texas
A&M University. He earned his PhD
in Agricultural Economics from the
University of Illinois and B.S. and
M.S. degree from Southern Illinois
University, where he received the
Outstanding Alumnus Award.
His research efforts over the years
have focused on the relationship between the general economy and
the nation’s food and fiber industries. These efforts have led to a
number of national awards from the American Agricultural Economics
Association in addition to the Distinguished Achievement Award in
Research at the university level by Association of Former Students at
Texas A&M University.
Dr. Penson has also received numerous awards for his teaching
efforts, including Distinguished Teaching Awards for both the
American Agricultural Economics Association and the Western
Agricultural Economics Association. His teaching program has also
been recognized by the Association of Former Students at Texas A&M
University with Distinguished Achievement Awards, twice at the
university level and once at the college level.
AGAM ERI CA .COM | 855 .905 .1 06 0
Copyright AgAmerica Lending LLC. All Rights Reserved.You can also read