Assessment of Haitian Coffee Value Chain - A participatory assessment of coffee chain actors in southern Haiti
←
→
Page content transcription
If your browser does not render page correctly, please read the page content below
Assessment of Haitian
Coffee Value Chain
Fernando Rodríguez,
Nora Patricia
Castañeda, Mark
Lundy

                        assessment
A participatory
assessment
of coffee
chain actors in
southern Haiti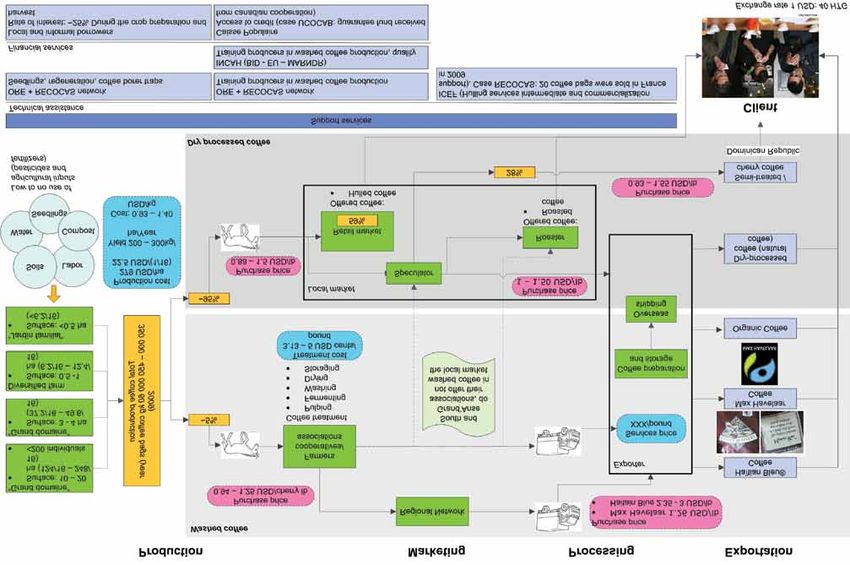
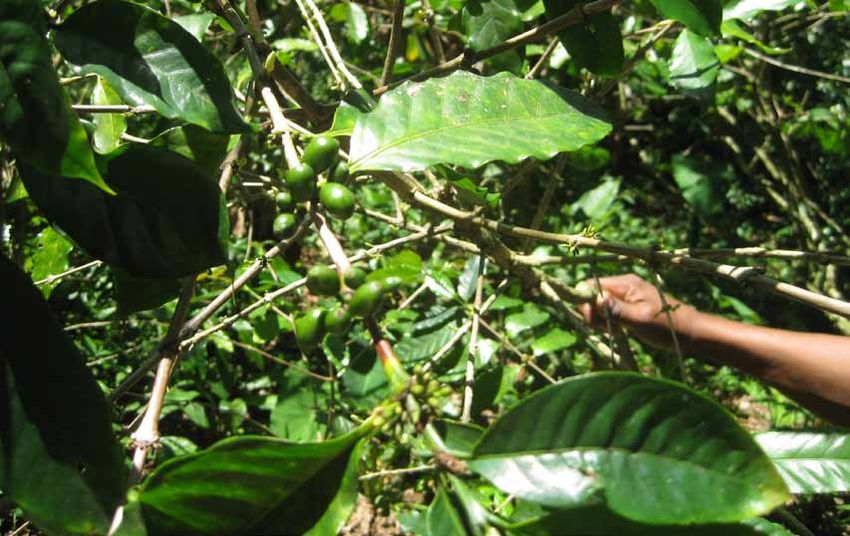
Copyright © 2011 Catholic Relief Services

Catholic Relief Services
228 West Lexington Street
Baltimore, MD 21201-3413 USA

Cover photo: Coffee plants in Haiti. CRS staff.

Download this and other CRS publications at www.crsprogramquality.org
Assessment of
Haitian Coffee
Value Chain

A participatory assessment of coffee
chain actors in southern Haiti
July 12–August 30, 2010
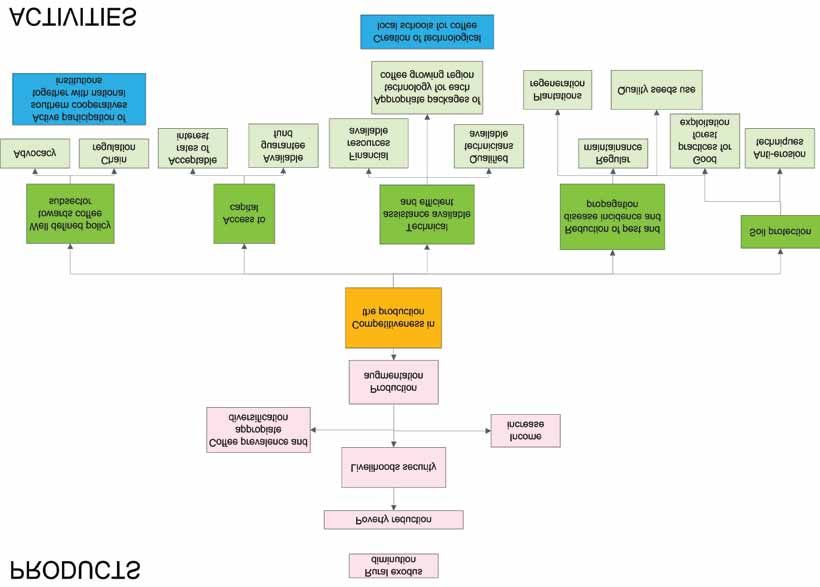
Table of contents
     Abbreviations and Acronyms. .  .  .  .  .  .  .  .  .  .  .  .  .  .  .  .  .  .  .  .  .  .  .  .  .  .  .  .  .  .  .  .  .  .  .  .  .  .  .  .  .  .  . III

            1 Executive Summary. . . . . . . . . . . . . . . . . . . . . . . . . . . . . . . . . . . . . . . . . . . . . .  IV
            2 Introduction. . . . . . . . . . . . . . . . . . . . . . . . . . . . . . . . . . . . . . . . . . . . . . . . . . . . . 1
            3 Relevance of Coffee in Haiti. . . . . . . . . . . . . . . . . . . . . . . . . . . . . . . . . . . . . . . . 1
            4 Markets . . . . . . . . . . . . . . . . . . . . . . . . . . . . . . . . . . . . . . . . . . . . . . . . . . . . . . . . 4
            5 Coffee Chain Analysis. . . . . . . . . . . . . . . . . . . . . . . . . . . . . . . . . . . . . . . . . . . . . 5
            6 Constraints Analyses. . . . . . . . . . . . . . . . . . . . . . . . . . . . . . . . . . . . . . . . . . . . . 17
            7 Recommendations . . . . . . . . . . . . . . . . . . . . . . . . . . . . . . . . . . . . . . . . . . . . . . 19

     Glossary. .  .  .  .  .  .  .  .  .  .  .  .  .  .  .  .  .  .  .  .  .  .  .  .  .  .  .  .  .  .  .  .  .  .  .  .  .  .  .  .  .  .  .  .  .  .  .  .  .  .  .  .  .  .  .  .  .  .  . 22
     References. .  .  .  .  .  .  .  .  .  .  .  .  .  .  .  .  .  .  .  .  .  .  .  .  .  .  .  .  .  .  .  .  .  .  .  .  .  .  .  .  .  .  .  .  .  .  .  .  .  .  .  .  .  .  .  .  . 24

     Annexes. .  .  .  .  .  .  .  .  .  .  .  .  .  .  .  .  .  .  .  .  .  .  .  .  .  .  .  .  .  .  .  .  .  .  .  .  .  .  .  .  .  .  .  .  .  .  .  .  .  .  .  .  .  .  .  .  .  .  . 25
     Annex 1: Problem Tree. . . . . . . . . . . . . . . . . . . . . . . . . . . . . . . . . . . . . . . . . . . . . . . . 25
     Annex 2: Production Solution Tree. . . . . . . . . . . . . . . . . . . . . . . . . . . . . . . . . . . . . . 26
     Annex 3: Postharvest Solution Tree . . . . . . . . . . . . . . . . . . . . . . . . . . . . . . . . . . . . . 27
     Annex 4: Marketing Solution Tree. . . . . . . . . . . . . . . . . . . . . . . . . . . . . . . . . . . . . . . 28
     Annex 5: Conclusions Obtained with Workshops Participants. . . . . . . . . . . . . . . . 29

     Figures
     Figure 1: Agricultural sector participation in total GDP. . . . . . . . . . . . . . . . . . . . . . .                                                                                   1
     Figure 2: Coffee production. . . . . . . . . . . . . . . . . . . . . . . . . . . . . . . . . . . . . . . . . . . . .                                                                    3
     Figure 3: Haitian coffee exports. . . . . . . . . . . . . . . . . . . . . . . . . . . . . . . . . . . . . . . . .                                                                       4
     Figure 4: Coffee chain in southern Haiti. . . . . . . . . . . . . . . . . . . . . . . . . . . . . . . . . . .                                                                           6
     Figure 5: Potential high-quality coffee municipalities in Haiti. . . . . . . . . . . . . . . . . .                                                                                      9

     Tables
     Table 1: Summary of chain constraints and strategic objectives to address them. IV
     Table 2: Principal coffee growing areas and their potential to produce
              quality coffee. . . . . . . . . . . . . . . . . . . . . . . . . . . . . . . . . . . . . . . . . . . . . . . . . 2
     Table 3: Grassroots organizations and exporting regional networks. . . . . . . . . . . . 3
     Table 4: Land distribution by plot size . . . . . . . . . . . . . . . . . . . . . . . . . . . . . . . . . . . 10
     Table 5: Coffee crop area per department in 1995 . . . . . . . . . . . . . . . . . . . . . . . . 10
     Table 6: Organizations in potential high-quality coffee municipalities. . . . . . . . . . 12
     Table 7: Current and potential washed coffee production in the region . . . . . . . . 12
     Table 8: Haitian Bleu exclusive distributors. . . . . . . . . . . . . . . . . . . . . . . . . . . . . . . 14
     Table 9: Average loan per program. . . . . . . . . . . . . . . . . . . . . . . . . . . . . . . . . . . . . . 16

II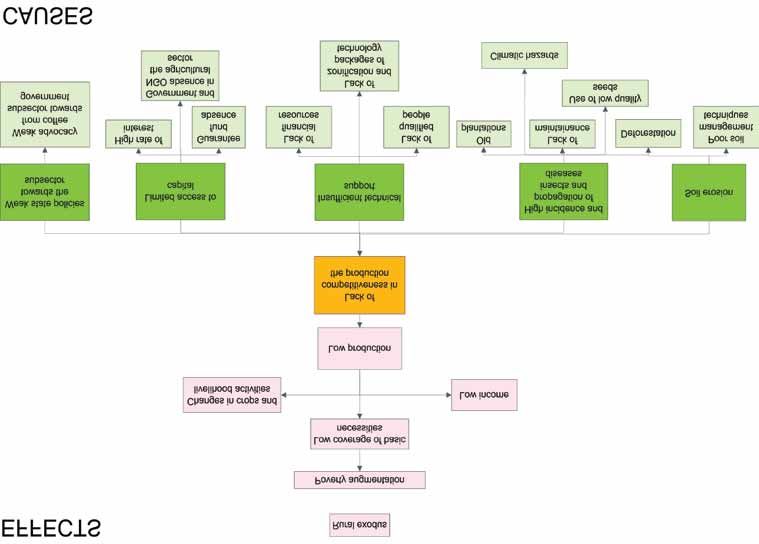
Abbreviations and Acronyms

AER: Average Equivalent Rate
AVSF: Agronomes et Vétérinaires Sans Frontières, or Agronomists and
Veterinarians Without Borders (France), http://www.avsf.org/
CACVA: Cooperative Agricole Caféière de Vachon (Haiti)
CAPOSAC: Caisse Populaire Sainte Anne de Camp—Perrin (Haiti)
CATIE: Centro Agronómico Tropical de Investigación y Enseñanza, or Tropical
Agronomic Center for Research and Teaching (Costa Rica), http://www.catieac.cr/
CIAT: Centro Internacional de Agricultura Tropical, or International Center for
Tropical Agriculture (Colombia), http://www.ciat.cgiar.org/
CICDA: Centre International de Coopération pour le Développement Agricole (now
AVSF)
CRS: Catholic Relief Services (USA), http://www.crs.org/
FACN: Fédération des Associations Caféières Natives, or Federation of Native
Coffee Associations (Haiti)
GDP: Gross Domestic Product
IADB: Inter-American Development Bank (USA), http://www.iadb.org/
ICEF: L’Institut de Consultation, d’Evaluation et de Formation pour le
Développement Agricole (Haiti)
ICO: International Coffee Organization (UK), http://www.ico.org/
INCAH: Institut National du Café d’Haïti (Haiti)
ORE: Organization for the Rehabilitation of the Environment (Haiti), http://www
.oreworld.org/
PNPCH: Plateforme Nationale des Producteurs de Café d’Haïti, or National
Platform of Coffee Growers of Haiti (Haiti), http://pnpch.wordpress.com/
RECOCARNO: Réseau des Coopératives Cafétères de la Région Nord, or Network
of Northern Coffee-Growing Cooperatives (Haiti), http://www.recocarno.com/
RECOCAS: Réseau des Coopératives Cafétères du Sud, or Network of Southern
Coffee-Growing Cooperatives (Haiti)
RFA: Rainforest Alliance certification

                                                                                  III
1 Executive Summary
This document is structured in three main parts. The first part consists of an
overview of the current coffee market at the international and national level as
well as a description of the importance of agriculture and coffee in Haiti. The next
two parts are a product of interviews and workshops with almost all actors of the
coffee chain in southern Haiti; these parts include a description of the coffee
chain for the region and its actors, constraints analysis and recommendations.
Priority was given to nine objectives that are considered strategic leverage points
for three different links in the chain. These objectives were prepared together
with chain actors during constraints and solutions identification workshops. Each
objective includes general activities that if implemented can facilitate compliance
with them. Table 1 briefly shows the constraints and objectives of the coffee
chain to the south of Haiti.
Table 1. Summary of chain constraints and strategic objectives to address them
L i n k s i n t he constraints S t r at e g i c o b j e c t i v es
c ha i n t o a d d r ess
constraints
Production No effective state policy Define state policies toward
toward coffee subsector coffee subsector
Low access to capital Improve access to capital for
coffee producers
Insufficient technical Make technical assistance
assistance available, efficient and appropriate
High incidence of pests and Reduce incidence and spread of
diseases pests and diseases
Soil erosion Foster soil protection
Transformation Scarce infrastructure and Promote basic infrastructure for
local skill available for processing washed coffee
processing washed coffee Local capacity building (focus on
maintaining quality)
Foster the development of cupping
labs in selected cooperatives
Commercialization Weak business management Strengthen regional networks
skills in grassroots level (and co-ops) in organizational and
business management skills with a
strong market orientation
IV2 Introduction
CRS is in the process of developing strategies to support the recovery of Haiti, after
the devastating earthquake of January 2010. As part of this work, CRS together
with CIAT developed an assessment of the current state of Haitian coffee and
mango chains. CIAT worked, together with CRS, partners and main chain actors
during August 2010, to gather information in the field. The present document is the
final report of the assessment of the southern Haitian coffee chain.
3 Rele va n c e o f c o f f ee i n H a i t i
Haiti is predominantly a rural country, with 53 percent of its population living in
rural areas (The World Bank, 2010). Agriculture participation in total GDP has
been decreasing steadily; nonetheless, the sector employs around 50 percent of
the total labor force of the country, compared with 12 percent employed by the
industrial sector.
Figure 1. Agricultural sector participation in total GDP
40
35
30
Percentage (%)
25
20
15
10
5
0
1994 1995 1996 1997 1998 1999 2000 2001 2002 2003
Source: The World Bank (2010).
Of the remaining forest coverage in Haiti, which corresponds to less than 2
percent of total land area, coffee farms represent about 50 percent of this
coverage. Vegetation has been lost since the colonial period, when it was cleared
to enlarge plantations (such as sugarcane and others). Since independence,
deforestation has increased because of timber exploitation, land colonization
and charcoal demand for cooking. This pattern of vegetation loss has resulted in
accelerated erosion, decreased soil natural fertility, reduced water retention and
waterways sedimentation. According to Arias, Brearly and Damais (2006), Haiti
loses 10,000 to 15,000 fertile hectares per year due to erosion.
About 150,000 to 200,000 farm families obtain an important part of their
revenues from coffee in the country. Varieties of Arabica (Typica and Borbon) are
most commonly grown. More than 90 percent of coffee produced corresponds to
natural (or dry-processed) coffee.
Due to cultivated varieties and specific microclimates, some authors suggest
potential production areas for high-quality coffee, as shown below:
1Table 2. Principal coffee growing areas and their potential to produce quality
coffee
Depa r t m e n t M u n i c i pal i t i es
High-quality coffee zones • Beaumont, Roseaux, Jérémie
• Grande Anse • Tiburon, les Anglais, Rendel
• South • Thiotte, Belle Anse, Marigot
• Southeast • Baptiste, Savanette
• Centre • Les Cahos
• Artibonite
Average-quality coffee zones • Dondon, Plaisance, Pilate, Borgne, Grande
riviére du nord, Bahon, Mermelade
• North
• Saint-Louis de Nord, Port de paix, Anse á
• Northwest
Foleur
• Northeast
• Sainte Suzanne, Valiére, Carice, Mont
• Nippes Organisé
• L’Asile, Baradères
Source: APROMA (1996) in Arias, Brearly and Damais (2006).
Current production is estimated to be between 350,000 to 450,000 bags (60
kg/bag), with yields of about 350 to 450 kilograms per hectare. Major threats
to coffee production are old coffee plantations (almost 70 percent of all planted
coffee corresponds to old stands); increasing incidence of the coffee borer
(Hypothenemus hampei), coffee rust (Hemileia vastatrix) and root rotting; and
low/null use of fertilizers.
Traditionally, coffee was marketed through the voltigeur-spéculateur-exporter
system. Regional networks were created as alternative marketing structures in
Haiti. There are five regional networks (FACN, RECOCARNO, COOPCAB, UCOCAB
and FECOCAS) and two grassroots organizations (COOPACVOD and UPAB) that
are currently exporting coffee, even though exported volumes are still low and a
large fraction of coffee is still going to the local market as it does not meet export
quality requirements.
Processing capacity in organizations/regional networks is frequently
underutilized due to low volumes of available coffee.
Before the International Coffee Agreement breakdown in 1989,1 coffee was one
of the main agricultural products exported by Haiti. After this breakdown, the
total surface under cultivation started to decrease as an effect of low and highly
volatile prices.
1 This agreement established export quotas for coffee-producing countries, allowing them to have stabilized prices.
2Table 3. Grassroots organizations and exporting regional networks
O r g a n i z at i o n Re g i o n Me m b e r s Donors Top market
p r i c e pe r
lb. (2004–5)
Réseau des North, 5,000 Oxfam-GB, EU European gourmet:
coopératives Northeast 1.26 USD
cafetières de la région
nord (RECOCARNO)
Fédération des Southeast, 40,000 USAID/IICA, Haitian Bleu: 3 USD
Associations Caféières Center, IADB, EU (Japanese market)
Natives (FACN) Artibonite,
Grand’Anse
Coopérative des Southeast 2,100 EU Haitian Bleu: 2 USD
Planteurs de Café de (Japanese market)
l’Arrondissement de
Belle-Anse (COOPCAB)
CAB Center 500 EU, International European Fair Trade:
NGOs 1.26 USD
Coopérative Agricole North 1,500 Organic: 1.39 USD
Vincent Oge De
Dondon (COOPACVOD)
Domestic café pilé 0.8–0.9 USD
Source: Frisner and IADB (2005) and INCAH (2006) in Arias, Brearly and Damais (2006).
Figure 2. Coffee production
100000 50000
90000 45000
80000 40000
70000 35000
60000 30000
Hectares
Tonnes
50000 25000
40000 20000
30000 15000
20000 10000
10000 5000
0 0
1961
1962
1963
1964
1965
1966
1967
1968
1969
1970
1971
1972
1973
1974
1975
1976
1977
1978
1979
1980
1981
1982
1983
1984
1985
1986
1987
1988
1989
1990
1991
1992
1993
1994
1995
1996
1997
1998
1999
2000
2001
2002
2003
2004
2005
2006
2007
2008
Harvested area (Ha) Yield (Hg/Ha) Production (tonnes)
Source: FAO (2010).
3As a strategy to overcome the effects of the breakdown, USAID, IADB and
other donors supported the creation of Haitian Bleu coffee brand and FACN
(Fédération des Associations Caféières Natives). The latter owns the brand.
Current coffee exports are minimal compared to those before 1989. Internal
demand has increased at a steady rate of 2 percent to 3 percent annually.
In addition, since 1995 an important flow of coffee exports to the Dominican
Republic—a flow that is currently estimated to be about 26 percent to 28
percent of total production—has emerged in the hands of informal actors whose
transactions are unregistered (LARHEDO, 2005).
Figure 3. Haitian coffee exports
35000 100000
90000
30000
80000
25000 70000
Quantity (tonnes)
Value (USD 1000)
60000
20000
50000
15000
40000
10000 30000
20000
5000
10000
0 0
1961
1962
1963
1964
1965
1966
1967
1968
1969
1970
1971
1972
1973
1974
1975
1976
1977
1978
1979
1980
1981
1982
1983
1984
1985
1986
1987
1988
1989
1990
1991
1992
1993
1994
1995
1996
1997
1998
1999
2000
2001
2002
2003
2004
2005
2006
2007
Quantity (tonnes) Value(1000 $)
Source: FAO (2010).
Less than 5 percent of total production corresponds to washed coffee. Fifty-nine
percent to 65 percent of total production is consumed locally, 10 percent to 12
percent is legally exported (whether as natural coffee or washed coffee) and 26
percent to 28 percent is exported informally to the Dominican Republic.
4 Ma r k e t s
4.1 Coffee domestic market
Domestic coffee consumption has been increasing at an annual rate of 2
percent to 3 percent based on urban population growth. This local demand
largely corresponds to milled coffee (café pile). According to Arias, Brearly and
Damais (2006), this demand for café pilé inhibits the production of higher-quality
coffees, since the high-quality coffee export channel is constrained by financing
considerations that require the sector to offer advance payments to producers
while revenues are generated only when green coffee reaches the final market.
On the other hand, the domestic market offers immediate payments upon the
sale of coffee cherries.
44.2 International coffee market
Based on the latest data from the International Coffee Organization (ICO, 2010),
total production for 2009/10 is estimated to be 123.1 million bags, which
represents a decrease of 3.9 percent compared with the last harvest (2008/9).
Decreases of about 10.3 percent and 6.3 percent are foreseen in South America
and Africa, respectively. Production in Asia is increasing, and a significant 26
percent decrease is expected in El Salvador.
Exports in January 2010, compared with those in 2009, showed a decrease of
9.3 percent.
During 2008, global consumption continued steadily at 130 million coffee
bags, compared with 128 million bags in 2007. This is largely due to internal
consumption growth in exporting countries, especially Brazil and other emerging
markets. For 2009, consumption was estimated to be 132 million bags. If the
consumption trend continues for 2010, 134,000 bags can be expected.
As of August 2010, demand exceeds supply in the global coffee chain. This
imbalance should lead to an increase in coffee prices by 35 percent in New York
and by 22 percent in London.
5 C o f f ee c ha i n a n aly s i s
5.1 Coffee chain description
Coffee producers in Haiti can be divided into two large groups according to the
size of their plantations’ cropped surface. The first group, with a surface area
of 5–20 hectares per farmer, is composed of less than 200 producers. They
are located across the country. These types of farms are frequently named
Grand domaine, or large estate. The second group, the biggest, is composed of
producers with cropped areas of fewer than 3 hectares per farmer. The common
factor for these two groups is the low to null use of agricultural inputs such as
fertilizers and pesticides. Total production was about 21,000 metric tons (MT) to
27,000 metric tons (350,000 to 450,000 60-kg bags) in 2009.
Some farmers’ cooperatives have nurseries to grow coffee plants and obtain
seedlings. Women work filling bags with soil and planting seeds on them, men
gather and transport soil to the nursery and prepare the terrain where bags will
be placed. Men and women water the new seedlings together. Men also prepare
the plot where plants will be definitely established and maintain the crop year
by year. Women, as well as men, participate in the harvest. During the harvest,
green and red coffee beans are picked, hampering the quality of the final coffee.
Low yields in Haiti (200 to 300 kg/ha/year) are caused by old trees and the
high incidence of pest and disease that result in part from poor fertilization,
inappropriate farming practices and inadequate new planting materials. Costs
of production are 186 to 420 USD per hectare, about 0.47–0.7 USD per pound,
according to INCAH (personal interview).
5Figure 4 Coffee chain in southern Haiti 6
There are two coffee processing methods in Haiti. The dry process is the most
common. (Almost 95 percent of all coffee in Haiti is processed with this method.)
Coffee beans are spread over a concrete surface or fibers (e.g., bags or sacks)
after harvest and are left to dry in the sun for a period of three to four months.
When the coffee is dry, it is milled by rudimentary means (e.g., mortar and
pestle) at a farm, thereby producing café pilé. Women are usually in charge of
this task. Alternatively, the coffee may be milled in facilities that are equipped to
produce natural coffee. Almost 95 percent of Haiti’s coffee production uses the
dry process. The wet process is used by very few farmers’ organizations in the
south. The process requires specialized equipment and a qualified workforce as
well as clients willing to recognize the quality of this type of product. The following
steps produce washed coffee:

   • Pulping. The coffee beans’ skin and part of the pulp are removed by
     mechanical means.
   • Fermentation. The pulp remainder is eliminated by immersing the
     beans in clean water for several hours. (Time varies according to
     environmental conditions.)
   • Washing. Final impurities are removed with water.

Wet processing is conducted at cooperatives’ facilities (not on individual farm
premises), but few organizations in the south own infrastructure to produce
washed coffee. (Exceptions include some organizations from Beaumont, KAPKAB
in Baradères, CACVA in Cavaillon and COCAM in Cavaillon.) Men are in charge of
pulping and fermentation. Women are in charge of drying. Men lift coffee bags
and take them to trucks that will transport coffee to Tombe Gâteau (Southeast
department) or Port-au-Prince, where the milling process occurs.

Café pilé and natural coffee reach the local market, where 59 percent of this coffee
is commercialized through the retail channel. Coffee also reaches speculators who
may sell coffee to exporters, local roasters or agents along the border with the
Dominican Republic. Twenty-eight percent of the total coffee production is exported
to the Dominican Republic as unregistered exports. (This behavior is accentuated
in coffee-growing areas along the border, such as Baptiste.)

Washed coffee is mainly commercialized through regional networks (second-
level organizations that gather grassroots organizations) as a means to collect
significant volumes of the product. In the south, washed coffee is commercialized
with FACN, RECOCAS and UCOCAB. Cooperatives in other regions in the
country sell washed coffee directly to exporters or local roasters. Before FACN’s
bankruptcy, coffee was collected by each organization, transported to Tombe
Gâteau (Southeast) where it was milled, and then taken to Port-au-Prince to
be sent abroad. However, since current FACN operations were reduced, some
cooperatives send their coffee directly to Port-au-Prince, where exporters offer
the service of milling and oversee shipping. At dry-milling stations (whether those
of FACN or exporters), coffee is hand sorted exclusively by women.

FACN classifies coffee into three categories: big beans for Haitian Bleu
(a registered brand that is commercialized through exclusive distributors

                                                                                          7
abroad, reaching prices of 3 USD/lb.), average-size beans for Max Havelaar
(which has fair trade certification for Europe) and rejected beans that stay in
the local market.
An aspect to highlight is the role of women in commercialization of coffee, which
includes selling coffee in the local market, selling natural coffee to middlemen or
associations, and usually, buying coffee at the associations.
Identified support services in this chain are technical assistance, financial
services, and agricultural suppliers. Technical assistance is provided by ORE
and RECOCAS (principally, through the MarChE project) targeting seedlings
production, plantations renewal, dissemination of coffee borer traps and training
for farmers on washed coffee production. Other service providers under this
same category are INCAH and ICEF; however, their work is more focused in the
Center, West and Southeast Departments.
Financial services are mainly offered by informal lenders. There are different
banks, microfinance institutions and credit unions in the region; however, none of
them offers an exclusive product adapted for agriculture or coffee.
Agricultural inputs suppliers based in Les Cayes (Gerly Distribution) offer coffee
seeds (Arabica) and pesticides to control coffee rust and the coffee borer, but
most farmers are not interested in perennials (like coffee). They prefer short-term
crops (legumes and vegetables).
5.2 Coffee chain actors
Coffee chain actors include agricultural input providers, coffee farmers,
cooperatives and regional networks, middlemen, local roasters, exporters and
service providers.
5.2.1 Agricultural input providers
These actors sell agricultural inputs, such as pesticides, fertilizers, seeds and
tools. Gerly Distribution (located in Les Cayes, Port-au-Prince and Port-à-Piment),
Darbouco (located in Port-au-Prince) and Agrotechnique (located in Port-au-
Prince) offer technical support to their clients. Highly specialized support for
coffee farmers is not available.
Currently, farmers dedicated to growing short-term crops (e.g., vegetables,
beans and rice) are considered by input providers to be their most interesting
market segment, due to these farmers’ consistent demand for inputs. Coffee is
widely recognized as a low to null input crop in Haiti, thus reducing the interest
of input suppliers in this sector. In interviews, Gerly Distribution mentioned
some pesticides that are in demand to control coffee borer (lambda cihalotrin,
malathion, profenofos) and coffee rust (mancozeb, benomyl).
Normally, pesticides come from the Dominican Republic as well as from
Venezuela and China, among other countries. During some periods, fertilizers are
directly imported and subsidized by the Haitian government.
85.2.2 Coffee farmers
Southwestern Haiti includes the Southern and Grand-Anse Departments. Land
tenure in the country is highly atomized, and southwestern departments are not
an exception to this trend; more than 60 percent of southwestern land plots are
smaller than 2 hectares.
Coffee-producing areas in the south are mostly concentrated in the Grand-Anse
Department. By 1995, the Grand-Anse, South and North Departments included
47 percent of the total national coffee plantations.
Six municipalities in the southwest are potential regions to produce high-quality
coffee (see Table 1): Beaumont, Roseaux, Jérémie, Tiburon, Les Anglais, Port-à-
Piment.
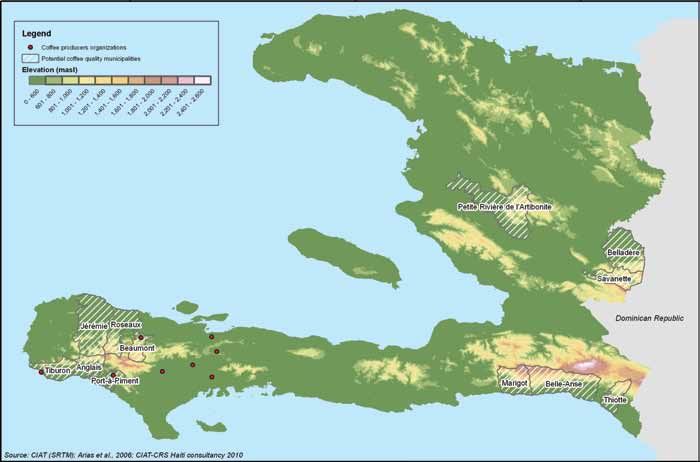
Figure 5. Potential high-quality coffee municipalities in Haiti
Red points represent populated places for each coffee organization included in the assessment. These points do not represent the actual locations of
these co-ops.
910
table 4 Land distribution by plot size
PLot ArtibonitE cEntEr grAnd- nortH nortHEASt nortHWESt WESt SoutH SoutHEASt t o tA L
SizE (%) (%) AnSE (%) (%) (%) (%) (%) (%) (%) (%)
0–0.5 ha 22.5 12.7 14.0 42.0 23.4 16.3 18.5 27.6 19.6 21.5
0.5–1 ha 32.7 25.8 27.5 28.4 33.0 26.5 31.1 28.2 25.4 28.6
1–2 ha 26.6 32.8 28.4 18.0 25.9 31.6 24.7 27.8 30.3 27.6
2–4 ha 11.2 19.7 13.1 7.6 11.7 15.9 15.7 9.8 17.3 13.7
4–7 ha 2.7 5.2 10.2 2.0 3.6 5.9 4.9 4.4 4.7 4.9
7–10 ha 1.7 2.0 3.2 1.0 2.5 2.1 2.4 1.9 1.3 2.0
10–20 ha 1.5 1.7 2.7 0.8 0.0 1.5 1.8 0.2 0.4 1.2
> 20 ha 1.0 0.2 0.9 0.3 0.0 0.2 0.9 0.2 0.9 0.6
Source: HLCS (2001) in Sullivan et al. (2010).
table 5 coffee crop area per department in 1995
d E PA r t m E n t c o f f E E S u r fAc E ( % )
Artibonite 7.4
West 10.0
Northwest 6.1
Centre 7.8
Northeast 4.3
South 12.1
North 15.2
Grande-Anse 21.2
Southeast 16.0
Source: CIRAD (1999) in Damais, Bellande and Duret (2005).Coffee crops are usually grown together with other food crops (e.g., plantain, yam,
taro, citrus, avocado) as well as tree species in random spatial arrangements.
Coffee is mostly grown in diversified farms (ferme diversifiée) ranging from 0.5
to 1 hectare and in jardins familiaux (plots occupying less than 1 ha of coffee
bushes around farmers’ houses).
Practices such as pruning and crop regeneration are not widespread among
farmers. Neither are the use of agricultural inputs nor the use of strict control
or monitoring of pests (particularly the coffee borer—Hypothenemus hampei).
Farmers located close to pulping facilities use composted coffee pulp as fertilizer
in their farms.
Coffee farmers usually obtain working capital from local informal lenders (usually
local wealthy families) to cover harvest costs. Capital required to establish
a hectare of coffee is estimated to be about 375 to 688 USD; meanwhile,
maintaining an established coffee crop requires about 279 USD. The main cost
of production is labor for cleaning and harvesting (INCAH and REBO interview,
August 2010). Recently, due to restricted access to capital, farmers in the region
have not been able to contract harvesters, resulting in failure to harvest the
entire crop. Farmers frequently offer coffee with different steps of treatment
through two distribution channels. Coffee cherries are sold to cooperatives/
associations where wet process facilities are available while natural coffee and
café pilé are sold in local markets. For transportation to cooperative and local
markets, farmers rely on donkeys and humans.
5.2.3 Cooperatives and regional networks
Cooperatives buy coffee cherries directly from farmers. Cooperatives then
process and sell dried coffee either to an exporter, or they send it abroad through
a regional network. Only a small percentage of coffee follows this path—some 5
percent of total production—while the rest is marketed as natural coffee via local
market channels.
Generally, coffee farmers deliver their produce in the cooperative, and they
receive a price close to the local market price. After the coffee is sold and
delivered abroad, they receive a price premium based on the price differential
at final sale. However, after various negative experiences, an important segment
of Haitian coffee growers no longer trust this process. For example, coffee
associations mentioned during interviews that farmers who contributed to the
2008–9 harvest, marketed through FACN, had not been paid as of the time of
our visit in August 2010.
The following cooperatives are currently operational: KATI (Tiburon), KAPKAM
(Cavaillon), CCR (Rendel), KAPKAB (Baradères), COCAM (Cavaillon), CACEM,
CACVA (Camp-Perrin), KOKAP (Plaisance), KAPKAK (Plaisance), KAPKAD (Dory),
APK2 (Beaumont), AMNMD (Beaumont), FNDPS (Beaumont), ODEB (Beaumont).
11Table 6. Organizations in potential high-quality coffee municipalities
O r g a n i z at i o n M u n i c i pal i t y Washe d - c o f f ee
fac i l i t i es
KATI Tiburon No
CCR Rendel (Port-à-Piment) No
APK2 Beaumont Not available
AMNMD Beaumont Not available
FNDPS Beaumont Not available
ODEB Beaumont Yes
CACVA Camp Perrin Yes
KAPKAB Baradères Yes
COCAM Cavaillon No
Only three co-ops in the south are currently producing washed coffee: CACVA
(Camp Perrin), KAPKAB (Baradères) and COCAM (Cavaillon). CACVA and KAPKAB
have facilities to produce washed coffee. COCAM has pulping facilities and a drying
patio, but the organization ferments and washes coffee in plastic containers.
CACVA sells coffee through FACN and UCOCAB (L’Union des coopératives
caféières de Belladère), which export coffee to Japan. CACVA also owns a
plot where they produce plantains and fruits for sale. While the cooperative
processing capacity is assessed to be 60,000 pounds, CACVA produced only a
fraction of this capacity, 1,263 pounds, during the 2008–9 coffee harvest.
Table 7. Current and potential washed coffee production in the region
C o o pe r at i v e Washe d c o f f ee P o t e n t i al
produced in production (lbs.)
2008–9 (lbs.)
KAPKAB 1,920 200,000
CCR 0 10,500
KAPKAD 0 15,000
CATI 0 40,000
KAPKAK 0 Not available
KAPKAM 0 15,000
CACVA 1,263 60,000
COCAM 0 Not available
KOKAP 0 44,000
CACEM 0 2,000
APK2 N/A N/A
AMNMD N/A N/A
FNDPS N/A N/A
ODEB N/A N/A
TOTAL 3,183 386,500
Source: Henri Sargelin, personal interview (RECOCAS).
RECOCAS (Réseau des Coopératives Caféières du Sud) is a regional network
that encompasses 10 coffee producers’ organizations in the region, for
12a total of 1,910 members. This network is a member of the Plateforme
Nationale des Producteurs de Café d’Haïti (PNCPH). RECOCAS has started
pilot marketing exercises, with support of ICEF, to directly export their coffee
like other regional networks in the country. In 2010 they sold fewer than 20
bags (60 kg/bag) in France.
5.2.4 Middlemen
In the traditional coffee chain, there are two types of intermediaries: upper-
level (speculators) and lower-level (voltigeurs, sous-marins and madam sarahs).
However, in the southwestern region these actors are changing their roles and
modes of action. In the past, and still in some areas, speculators had a network
of lower-level intermediaries that directly bought coffee from farmers; they
had a direct relationship with exporters and could give farmers credit during
nonharvest seasons. At present, voltigeurs and madam sarahs are found in
the local market. They do not offer credit anymore, and they store coffee until
reaching an acceptable volume to sell to speculators who then resell to local
roasters and private exporters or act as informal exporters by sending coffee to
the Dominican Republic.
5.2.5 Local coffee roasters
Local coffee roasters commonly buy coffee from speculators and occasionally
from farmers’ associations. Small and medium enterprises are involved in coffee
roasting and grinding.
REBO is one of the local coffee roasters, located in Port-au-Prince, that mostly
sells this type of product in the domestic market, though some sales abroad have
been made. They offer four different types of roasted coffee:
• Café deluxe: roasted natural coffee
• Café classique: roasted natural coffee (small beans)
• Café gourmet espresso: roasted wet-process coffee
• Café li pi bon: roasted coffee (smallest beans)
5.2.6 Exporters
After experiencing profound changes since the 1970s, when there were 20
private exporters, the coffee chain currently has four private exporters including
REBO and WIENER. These two exporters are the only ones marketing natural and
washed coffee abroad.
REBO offers the services of coffee dehusking and packaging to farmers’
organizations. Separately, REBO distributes imported food products in the country.
Regional networks (FACN, RECOCARNO, COOPCAB, UCOCAB and FECOCAS) and
grassroots organizations (COOPACVOD and UPAB) also export. Volumes shipped
account for about 1 percent of total coffee exports.
The Fédération des Associations Caféières Natives (FACN) brings together
1325 farmers’ organizations operating in the Southeast, North and Grand’Anse
Departments. This federation receives parchment coffee from its associates,
dehusks the coffee, sorts it, blends it and exports it directly to overseas clients
as fair trade and Haitian Bleu coffee (LARHEDO, 2005; Lenaghan, 2005). The
Haitian Bleu business model follows this plan:
• Roasters act as exclusive distributors. They set up contracts to buy directly
from FACN on a multiyear basis at fixed prices.
• The FACN does not sell Haitian Bleu to other roasters in the same
geographical area of any exclusive distributor.
• Exclusive distributors do not resell green Haitian Bleu coffee.
Table 8. Haitian Bleu exclusive distributors
C o u n t ry Distributor
United States Barnie’s Coffee & Tea Company, Orlando, Florida
Coffee Bean International, Portland, Oregon
Coffee Masters, Spring Grove, Illinois
Heritage Coffee Company, Juneau, Alaska
Denmark Coffee Masters-AQUA VELOX Aps, Skovlunde
France Cafés Malongo, Nice
Germany Kaffee-Compagnie Gourmetkaffees weltweit Rosterei, Mössingen
Japan Hamaya Company, Ltd.
Haiti Compagnie Haitienne de Café, Port-au-Prince
Source: Lenaghan (2006).
The best coffee is sold as Haitian Bleu (2 to 3 USD per pound) and second-
category coffee is sold as Max Haavelar (fair trade coffee) in Europe.
Since its creation, FACN has faced several managerial and institutional issues.
FACN’s current debt is estimated to be about 920,000 USD. Nowadays,
Haitian Bleu exports are made through other actors (such as REBO) with FACN
certification and approval.
5.2.7 Support services
5.2.7.1 Financial service providers
The main activity of these providers is to grant credit to organized producer
associations and individual farmers to enable them to produce coffee. Few
providers in the region have special lines of credit targeting the agricultural
sector. Others offer diverse services that are not financially related. The rate of
interest in the country was about 30 percent in 2010.
Lending to the agriculture sector in Haiti is commonly perceived as a high-risk
activity, due to climatic events (hurricanes, storms, floods) and, therefore,
crop failures.
14Caisse Populaire (CAPOSAC). Located in Camp-Perrin, CAPOSAC was founded in
1949 as an initiative of a Canadian priest. The organization currently has assets
worth 240 million gourdes (approximately 6 million USD) and offers services to
almost 13,000 people. Among their services are currency exchange, current and
savings accounts, money transfers, credits and check cashing.
CAPOSAC offers four lines of credit: consumption, commercial, construction and
agriculture. There are several advantages of an agricultural credit: After repaying
the whole credit, the client receives 20 percent of the total paid interests at
a differential rate. The grace period before repayment is flexible and can be
extended by a month, though the length depends on the type of crop grown,
perennial or annual. The minimum credit loan is 2,500 gourdes (about 62.50
USD) up to 750,000 gourdes (about 18,750 USD).
Fonkoze. This organization was founded in Haiti in 1994 and has 41 offices in
Haiti (including Les Cayes). It is recognized as Haiti’s Alternative Bank for the
Organized Poor and is the largest microfinance institution offering services to
the rural poor in the country. They offer small loans, saving products, currency
exchanges and direct deposits from overseas. They also offer nonfinancial
services such as basic literacy instruction and basic life skills training (including
training for business skills and sexual and reproductive health).
Fonkoze has four main credit programs:
• Chemen Lavi Miyò, an 18-month program to strengthen productive assets
and asset management skills. It targets ultrapoor people. After 18 months,
program participants are expected to move into the Small Credit program
or Solidarity credit.
• TiKredi, the Small Credit program, is a six month lending program. It offers
loans of 25 to 75 USD.
• Kredi solidè, Solidarity credit, is a type of credit for groups of 5 to 10
individuals. Loans are 75 to 1,300 USD.
• Business Development, an individual credit program. The average credit
for this program is 1,685 USD.
UNIBANK. UNIBANK does not offer an exclusive line of credit for agriculture;
instead, anyone interested in farming could use an ordinary loan with a 30
percent to 32 percent annual equivalent rate with a maximum repayment time
of 36 months. The procedure to obtain a credit involves filling out a form and
presenting the project portfolio and a letter of credit request. All decisions
regarding credits are made in Port-au-Prince by a credit committee, and this
might take about a month.
15Table 9. Average loan per program
Loan program Av e r ag e l o a n s i z e ( U S D )
in 2009
Chemen Lavi Miyò No credit
TiKredi 42
Kredi solidè 221
Business Development 1,685
Source: Fonkoze (2009).
5.2.7.2 Nonfinancial service providers
Organization for the Rehabilitation of the Environment (ORE). ORE is a nonprofit
local organization located at Camp Perrin. ORE’s team, made up of technical,
management and support staff, includes up to 30 people, depending on
the current activities and projects the team is implementing. ORE promotes
high-value fruit tree grafting as a mean to improve livelihoods and protect the
environment. ORE also has extensive experience in propagating quality-improved
seeds, soil conservation techniques and farmers’ training as well.
In the South and Grand-Anse Departments, ORE has supported coffee
associations in the implementation of coffee nurseries; given technical support
to produce washed coffee and to implement coffee borer management
techniques (such as installing traps and producing wasps for biological control);
and helped associations build capacity in management and business.
l’Institut de Consultation, d’Evaluation et de Formation pour le Développement
Agricole (ICEF). ICEF was founded in 1996. It is located in Port-au-Prince and
works with coffee producers. Currently led by a former Haitian minister of
agriculture, ICEF coaches coffee associations in topics such as production and
commercialization. ICEF has worked with RECOCAS and supported them in a
coffee exporting exercise, as mentioned previously. ICEF also offers a coffee
dehusking service (as an intermediary).
Agronomes & Vétérinaires sans frontières (AVSF). Founded in 2004 as a merging
of Vétérinaires sans frontières (VSF) and the Centre International de Coopération
pour le Développement Agricole (CICDA), AVSF manages projects related to
agricultural development around the world. They also raise funds and offer
technical assistance according to the expertise required by the project. In Haiti,
they have worked with coffee associations in Thiotte (Southeast Department) and
Baptiste (Bas Plateau Central).
Oxfam–Italy (formerly, UCODEP). Oxfam–Italy is currently starting a three-year
project on coffee in the South and Grand’Anse Departments. It will focus on the
following areas:
• Strengthening farmers’ cooperatives through legal framework, statutes,
accounting and transparency.
16• Fostering advocacy activities of the Plateforme Nationale des Producteurs
de Café d’Haïti (PNPCH).
• Renovating coffee plantations to produce about 800,000 coffee seedlings
and 100,000 tree species seedlings.
• Improving coffee quality through equipment and processing facilities
(eight in total). A dehusking facility and a quality lab are planned for Les
Cayes. Fair trade certifications are currently being explored by Oxfam as an
alternative way to add value to the coffee.
• Increasing commercialization through international market training
(quality, certifications requirements).
• Promoting diversification at the farm level as a means to achieve food security.
Beneficiaries of this project will be members and associations involved in RECOCAS.
l’Institut National du Café d’Haïti (INCAH). INCAH is a national institution established
in 2003. It is in charge of overseeing coffee production in Haiti and coordinating
projects promoting the coffee chain in the country. INCAH is partially funded by the
central government and by projects from the European Union and IADB.
INCAH’s functions include the following:
• Formulate national policy, strategies and action plans for the coffee subsector.
• Draft and upgrade coffee legislation as needed.
• Promote, regulate and coordinate actions on behalf of the coffee chain.
• Manage the National Coffee Fund (not yet operational).
• Keep records of coffee chain actors (exporters, roasters, speculators, producers).
• Provide statistical data and economic analyses of the coffee subsector.
• Provide training and disseminate technical data to chain actors.
Plateforme Nationale des Producteurs de Café d’Haïti (PNPCH). The PNPCH
is composed of six regional networks: RECOCANO, northern regional network;
RECOCARNO, northeastern regional network; APCAB and COOPCAB, southeastern
regional network; UCOCAB, center regional network; RECOCAS, southern regional
network; FACN and COHIMRU, Grand’Anse network.
PNPCH’s principal objective is to organize advocacy activities in favor of the
coffee chain, mainly for coffee producers and their organizations.
6 C o n s t r a i n t s a n aly ses
Constraints were identified and validated together with all chain actors for each
link of the chain (production, transformation and commercialization). Steps
followed were: (1) participative chain diagram construction, (2) semistructured
interviews with chain actors, (3) chain diagram validation, (4) identification
(brainstorming) of probable constraints, (5) participative constraints prioritization
per link of the chain, (6) selection of main constraints and (7) cause and effect
analysis for each main constraint using problem trees (see annexes).
176.1 Production link constraints
6.1.1 No effective state policy toward coffee subsector
Efforts made by the Haitian government to enable a more competitive
environment for coffee production remain insufficient due to the low levels of
resources (financial, infrastructural, staff) invested and lack of a clear joint
competitiveness agenda among government, NGO and farmers’ associations
and among regional networks, cooperation agencies, speculators, exporters and
other chain actors.
6.1.2 Low access to capital
Rates of interest offered for coffee production are high compared with the
low productivity of farms. Taking loans under this circumstance leads to low
profitability rates for farmers. A lack of guaranteed funds for agriculture in the
region (particularly for coffee) is reflected in the low amount of existing credit
lines. This lack of cash flow at the farm level reduces the capacity of farmers to
hire coffee pickers during harvest, thus leaving unharvested coffee beans on the
bushes and providing a clear incentive to sell coffee as soon as possible to the
highest bidder, usually within the local market, which can offer prices of 35–60
gourdes per pound. Meanwhile co-ops may immediately offer prices of 37.50–50
gourdes per pound plus a price premium that could take more than a month to
be paid.
6.1.3 Insufficient technical assistance
At present, the technical assistance offered by governmental institutions and
local NGOs does not cover all coffee producers. There have been projects from
the government and international cooperation to identify and control the coffee
borer in different coffee-producing regions; however, because of current financing
mechanisms, technical assistance strategies are not consistently transferring
knowledge to producers. Technical assistance is supported through individual
projects, and there is no orientation to create a sustainable local service.
6.1.4 High incidence of pests and diseases
A high incidence of pests such as the coffee borer (Hypothenemus hampei)
and diseases such as coffee rust (Hemileia vastatrix) and root rot have strong
negative effects on yields and coffee quality. The prevalence of these problems
is a result of an absence of crop management technology packages that are
adapted to different coffee producing areas, low technical assistance coverage,
use of low-quality seeds, and climatic hazards (such as hurricanes and floods).
6.1.5 Soil erosion
Poor soil management techniques have promoted continuous soil erosion,
reflected in depleted soil nutrition, poor development of coffee crops and
low yields.
186.2 Transformation link constraints
6.2.1 Inadequate infrastructure for processing washed coffee
Inadequate infrastructure and skills to maintain coffee quality from harvest (farm)
through processing (pulping, fermentation, washing, drying and storage), results in
coffee being sold in lower-value channels. Farmers therefore receive less revenue.
Few organizations have facilities where coffee can be wet processed (exceptions
are CACVA, KAPKAB, COCAM and associations in Beaumont).
6.2.2 Disincentives for producing washed coffee
The price for exportable washed coffee is higher than the price for natural coffee.
But organizations with facilities for wet processing do not often make punctual
payments for delivered harvests, and in some cases, they do not make any
payments at all. (The 2008–9 harvest still has not been paid for as of August
2010.) This situation has discouraged farmers from delivering their coffee to
processing associations and encouraged them to produce natural coffee for the
local market, where payment is smaller but delivered on time.
Along the border of the Dominican Republic, the offered prices for coffee cherries
or wet pulped coffee are more attractive than the regular price for washed coffee,
and payments are received more quickly than they are for dry-washed coffee.
Weak business and organizational management leads to low negotiation skills at
the moment of coffee sales and a low responsiveness to threats and opportunities.
7 Re c o m m e n dat i o n s
Plantation renewal will allow growers to introduce more productive plants and
boost coffee production in stands younger than 10 years old. Strategies that
encourage farmers to implement such renewals in jardins familiaux and diversified
farms are the promotion of associated local tree species and crops focused on
food security (e.g., beans, plantains, corn, tree fruits, legumes and vegetables),
soil conservation, charcoal production (energy forests) and multipurpose forages.
We suggest that plantation renewal should be gradual. Plots could be divided
into four areas. During the first year, one of the plots could be completely cleaned
and coffee seedlings could be planted on it together with associated crops. In the
second plot, coffee trees could be cut back. Coffee trees in the third plot could be
pruned, and trees could remain untouched in the fourth plot.
We recommend adapting and evaluating crop technology packages per region.
For the case of the coffee borer, we recommend establishing the elevation
range in which coffee is economically profitable. Lowlands usually have a high
incidence of this pest, and the cost of production, including pest management,
may exceed incomes gained from the sale of coffee. After economically profitable
regions have been identified, farmers and associations should work together
to implement practices to reduce pest and disease incidence. These practices
should include weed control and weekly removal of ripened, over-ripened and
infested coffee beans from the tree. Growers should also pick beans from soil.
19We suggest that local schools are needed in order to train qualified personnel from
the region. Curricula should include in-field training, internships and specializations.
This could be achieved through alliances between national universities and
international agricultural schools (e.g., CATIE). Field trips to successful smallholders
who produce quality coffee under similar environmental conditions (e.g.,
smallholders in the Dominican Republic) may contribute as a training activity as
well as a way to benchmark production systems at the farm level. In an enabled
environment, technical assistants can start small businesses to offer their services to
producers. It will be necessary for co-ops to determine financial contributions needed
to at least partially cover the cost of technical assistance.
Desirable objectives for production include ensuring an increase of at least 20
percent of current coffee production and a growth of at least 15 percent of the
current price. This will allow a producer with only one third of a hectare to earn an
income close to 50 percent the current per capita GDP. Associated crops (beans,
fruits, tubers) will increase food security for coffee farmers and their families,
and surplus could be exchanged or sold in the local market to also increase
livelihood security.
We recommend that CRS should select areas with the highest potential to
produce high-quality coffee (especially areas with less incidence of pests
and diseases). CRS will need to perform a thorough analysis of each of these
productive clusters to determine current available volumes, number of producers,
genera, cropped area and elevation, among other variables that are related
to quality and quantity potential. Dry coffee samples from these zones should
be taken for physical quality assessment as well as for cupping, with the aim
of obtaining coffee profiles for each geographic area. Together with the private
sector (including allied roasters abroad), CRS should identify the current quality
of plantations’ coffee and the specific aspects in the coffee production process
(e.g., production, harvest, coffee processing, drying) that should be improved to
obtain an acceptable quality for specialty markets. A step to ensure inclusion,
transparency, development of co-innovation and adoption of technologies is to
involve different chain actors (roasters, importers, certifiers, grassroots, CRS,
others) at the outset of each project.
Institutions such as Oxfam–Italy can support the implementation of quality
improvement activities in the south; by the time of our August 2010 visit, they
were identifying which organizations have potential for producing washed coffee.
ICEF is well known in Haiti for its work with coffee grassroots organizations in
providing technical assistance, in strengthening local production and processing,
and in supporting washed coffee commercialization. Developing and improving
the infrastructure for washed coffee (infrastructure for storing, depulping,
fermenting, washing and drying) and evaluating current practices for producing
natural coffee are necessary to produce interesting flavors that will add value.
Building local capacities should enable co-op personnel to maintain coffee
quality in processes such as fermentation and coffee drying. Training could
be offered by national and international experts. During this phase, process
20standardization is also necessary to allow coffee to reach its potential. This will
require the support of a cupping laboratory.
Fostering local cupping laboratories in those areas with the highest potential for
quality and quantity will enable cooperatives to control their own quality and give
feedback through technical assistance to each farmer. Cupping labs will need
to train at least four local cuppers with support from external roasters who are
involved in the process.
Certifications may have a role in training grassroots participants during the
first stages of implementation. Fair trade could play a fundamental role during
implementation, as fair trade requires associations to be strengthened in
associative, business and organizational ways that enable fair trade importers to
assist during negotiations and sales. Fair trade also fosters networking between
the participants of a negotiation. Additionally, Rainforest Alliance could promote
conservation in coffee-growing regions, thereby improving coffee quality, fostering
edible tree plants, improving soil fertility and increasing long-term biodiversity.
Fair trade certification requires hard work in organizational aspects. Organic
certification could be an immediate alternative for adding value due to farms’
current low/null use of pesticides; however, organizations must meet other
requirements such as internal audits (which might not be sustainable in the long
run, as the high effort demanded for renewing annual certifications may not
always match received price premiums).
Before implementing any certification process, a market for these products must
be targeted. This is reachable by different strategies, such as working together
with interested roasters, ensuring that clients support the total or a fraction of
the certification costs and negotiating each part through a contract of sale.
Business development and organizational strengthening should start with
farmers’ organizations. Focus should be given to leadership development, roles
definition, orientation to markets, financial skills and participatory markets.
21Gl o ssa r y
Café pile Natural coffee dehusked by rudimentary means (e.g., mortar and pestle).
Coffee borer A coffee pest (Hypothenemus hampei) that feeds and reproduces
in fruits of coffee plants. Affected fruits receive lower prices in the market due to
the direct injury to quality.
Coffee cherry Ripened coffee fruit that is ready for harvest. Colors may vary
from yellow to red, depending on the variety. Also called coffee berry, coffee
cherry is composed of (1) the bean (or endosperm), which is edible after
roasting; (2) the parchment, which protects the bean; and (3) the pulp and skin,
which are the most external layers of the fruit.
Coffee rust A coffee disease caused by a fungus (Hemileia vastatrix). It
is considered to be the most destructive disease of coffee. In 1870–80, it
destroyed all coffee crops in southeast Asia.
Dehusking (milling) The process of removing the coffee parchment from the bean.
Ferme diversifiée (diversified farm) Productive units ranging from 0.5 to 1
hectare in which coffee is grown together with other food crops (e.g., plantain,
yam, taro, citrus and avocado).
Grand domaine Large estate, with about 5 to 20 hectares.
Green coffee Dried coffee without skin or parchment.
Haitian Bleu Specialty coffee brand, developed with support of USAID and IABD
and owned by FACN.
Hulled coffee Coffee without parchment.
Jardin familial A Haitian spatial arrangement in which a few coffee bushes grow
around the farmer’s house. The bushes occupy less than 1 hectare and produce
small volumes of the bean.
Madam sarah Female retailers who sell different basic products in the local
market. They may sell café pilé as retailers and in some cases may gather large
volumes of the product and act as a wholesaler.
Natural coffee Coffee produced through the dry (or natural) method, in which
harvested cherries are directly dried under the sun for about four weeks.
Price premium The difference between the final price given and the coffee stock
price. The price premium is assigned according to the coffee quality, origin and/
or certifications.
Root rot Plant disease that largely affects coffee plantations in Haiti. Root rot
and coffee rust are the main diseases of this crop.
Sous-marin See voltigeur.
22Spéculateur An upper-level middleman who gathers significant volumes of
coffee to sell directly to local roasters or coffee sellers along the border.
Torréfacteur A local coffee roaster.
Voltigeur A low-level middleman, acting as retailer in the local market.
Washed coffee Coffee produced through the wet (or washed) method.
Wet process Coffee processing method that requires specific equipment and
clean water availability in order to remove the pulp and skin from each coffee bean.
23You can also read