Scaling up clean cooking in urban Kenya with LPG & Bio-ethanol - A market and policy analysis - Dalberg

Page created by Ethel Olson
 
CONTINUE READING
Scaling up clean cooking in urban Kenya with LPG & Bio-ethanol - A market and policy analysis - Dalberg
Scaling up clean cooking in urban Kenya with LPG & Bio-ethanol

A market and policy analysis

June 2018
Scaling up clean cooking in urban Kenya with LPG & Bio-ethanol - A market and policy analysis - Dalberg
Executive summary

     Majority of Kenyans still cook                              LPG has penetrated Nairobi                               Eliminating VAT and import
      with dirty fuels that cause                              and higher-income households;                             tariffs can make Bio-ethanol
        significant health and                                      Bio-ethanol can be an                                among the cheapest1 cooking
       environmental damage,                                    attractive clean fuel for lower                              fuel options in Kenya
       despite cleaner options                                       income households
 •     Charcoal, kerosene, and firewood                    •     While modern, clean fuels are now •                      Despite having equivalent benefits
       still dominate the Kenyan market                          more available, there are challenges                     to LPG, the cost of Bio-ethanol is
 •     These fuels are major contributors                        with consumer awareness,                                 inflated by 25% import tariffs and
       to respiratory diseases, carbon                           affordability and accessibility                          16% VAT treatment
       emissions, and deforestation                        •     LPG penetration has increased                       •    This treatment is in stark contrast
 •     The Government of Kenya (GoK)                             rapidly over the past five years,                        to LPG – which enjoys effective tax
       has stated its ambition to                                especially in Nairobi – the benefits                     rate of zero – and kerosene, at 9%
       transition Kenya to modern, clean                         are well-publicized                                      import duties and zero-rated VAT2
       fuels                                               •     While less known about, liquid Bio- •                    If GoK made (denatured technical)
 •     The urban market presents the                             ethanol is now increasingly viable as                    Bio-ethanol zero-rated for VAT and
       most immediate opportunity to                             an urban cooking solution, driven by                     eliminated tariffs, it would be
       transition Kenyans to cleaner fuels,                      innovations in technology and                            among the cheapest cooking fuel
       such as LPG and Bio-ethanol                               distribution                                             options in Kenya and could
                                                                                                                          displace charcoal and kerosene

        Unlike other clean fuels, Bio-ethanol can be produced domestically over time, which would spur
                    industrial growth while delivering positive social and economic benefits
Note: (1) This assumes a standard household consumption and is based on assumptions of stove efficiency of existing technologies and current fuel pricing       2
Sources: (2) Standard Media, “Tough Times Ahead as State Introduces on Kerosene to Fund Spending Plan”, June 9 2016
Scaling up clean cooking in urban Kenya with LPG & Bio-ethanol - A market and policy analysis - Dalberg
Table of Contents

                Section I: Introduction

                    Section II: Kenyan Cooking Fuel Market Options and Snapshot

                      Section III: Potential of Bio-ethanol for Cooking in Kenya

                      Section IV: Bio-ethanol Policy Analysis

                    Section V: Conclusions and Recommendations

                Appendices

                                                                                   3
Scaling up clean cooking in urban Kenya with LPG & Bio-ethanol - A market and policy analysis - Dalberg
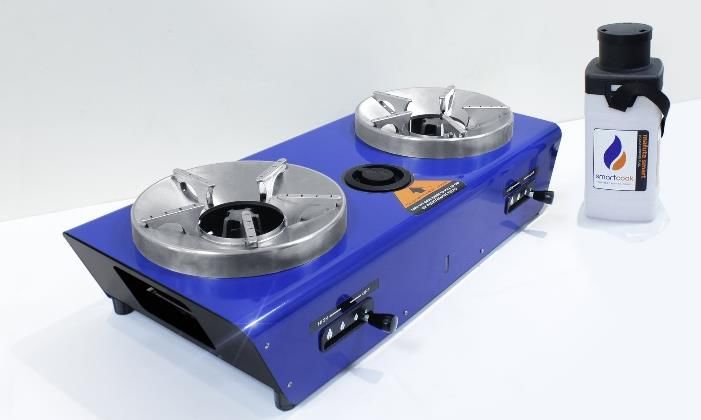
SECTION I: INTRODUCTION
                          This study was developed to:

                          1.    Position the cooking fuel market within the wider context of the Government of Kenya’s and others’ efforts to
                                improve the welfare of Kenyans across a variety of dimensions
                                o    Vision 2030 aims to transform Kenya into a newly-industrializing, middle-income country providing a high quality of life to all its citizens
                                     by 2030 in a clean and secure environment; much progress has been made (e.g., in the areas of healthcare, education, and housing)
Section I: introduction

                                o    However, despite the continued advocacy efforts of various stakeholders, additional strides are needed to ensure that all Kenyans have
                                     access to affordable clean cooking options

                          2.    Evaluate Kenya’s urban household cooking fuel sector and understand the ways in which customers are under-served
                                by traditional fuels, which continue to dominate over more modern, clean fuel alternatives
                                o    Traditional dirty fuels dominate fuel use in Kenya: ~85%1 of Kenyans rely on these for cooking
                                o    Continued dependence on these fuels has negative impacts on health, environmental, and other social outcomes

                          3.    Profile the available modern cooking fuel options based on emerging technologies and trends

                          4.    Highlight Bio-ethanol cooking fuel as a viable and scalable modern cooking fuel with the potential to be sold at prices
                                affordable to the majority of urban Kenyans currently relying on kerosene and charcoal
                                o    Bio-ethanol and LPG are the most feasible alternatives to traditional fuels, offering Kenyans a clean and efficient cooking experience
                                o    While LPG is generally well-understood and is being actively promoted by the government, Bio-ethanol requires further exploration and
                                     can be complementary to LPG as a modern cooking fuel for Kenyans

                          5.    Recommend strategies for enabling private sector-led modernization of the cooking fuel sector – with a focus on Bio-
                                ethanol – to deliver maximum social, environmental and economic benefits for the public
                                                                                                                                                                                4
                          Source: (1) Kenya Integrated Household Budget Survey (2018), National Bureau of Statistics
Scaling up clean cooking in urban Kenya with LPG & Bio-ethanol - A market and policy analysis - Dalberg
The urban Kenyan cooking fuel market is estimated at USD 600m – USD 800m
                          per annum, and remains dominated by dirty fuels
                                 In urban Kenya, the majority still use charcoal and kerosene; this                    This report focuses on the opportunity for Bio-ethanol to
                                      number is much higher when fuel ‘stacking’ is included                           serve the urban Kenyan population (market estimated at
                                                                                                                       ~$600-800mn* per annum with full fuel transition).
                                     Primary Cooking Fuel Used in Kenyan Households in 2017
                                     (% of population)
                                                2           5
                                                                                                                       The majority of Kenyans currently paying for cooking
                                         13                                        2 2
                                                                             9                                         fuels live in urban Kenya
                                          14               28                        3         Other fuels
                                                                                                                       • Most fuel used in rural areas is gathered and not
                                          15                                                   LPG
Section I: introduction

                                                           29                                                             purchased (e.g., 84% of households use firewood as
                                                                                               Kerosene
                                                                              84                                          their primary fuel)
                                                                                               Charcoal
                                           55              22                                                          • Market-driven approaches for expanding the use of
                                                                                               Firewood
                                                           16                                                             modern fuels are unlikely to take hold in these areas in
                                                                                                                          the short term
                                         Kenya            Urban              Rural
                                                                                                                       • In urban areas, on the other hand, over 80% of
                                                                                                                          households are already purchasing cooking fuel and are
                                    Kenyan urban households are now ready for rapid uptake of                             prime targets for modern fuel use
                                                      clean, modern fuels
                                                                                                                       Within modern fuel options, Bio-ethanol and LPG are the
                                     Primary Cooking Fuel Used in Kenyan Households in 2017                            most feasible today; Bio-ethanol is the least understood
                                     (households, millions)                                                   Rural
                                                                                                                       • LPG is well-understood, already promoted by the
                                                                                                              Urban       Government, and enjoys strong consumer recognition
                                          Electricity                  0.0         0.1
                                                                                                                       • Bio-ethanol is relatively unexplored and has achieved
                                                    LPG           -0.2                                       1.4
                                                                                                                          lower penetration thus far
                                          Kerosene                -0.2                                        1.5      • Electricity will become increasingly important to the
                                                                                                                          overall cooking mix; however, for now, only higher
                                           Charcoal -0.6                                             1.1
                                                                                                                          income consumers can afford the expensive but
                                          Firewood              -5.7                     0.8                              efficient electric stoves that are needed to make
                                                                                                                          electric cooking viable
                          *This market size estimate is based on current urban population size, fuel use patterns, estimated household consumption/spend (based on average
                                                                                                                                                                                     5
                          efficiencies of cookstoves/fuels in the market), and market price data for urban Kenya
                          Source: Kenya Integrated Household Budget Survey (2018), National Bureau of Statistics
Scaling up clean cooking in urban Kenya with LPG & Bio-ethanol - A market and policy analysis - Dalberg
SECTION II: KENYAN COOKING FUEL MARKET OPTIONS AND SNAPSHOT
Section II: Kenyan cooking fuel market options and snapshot

                                                              The majority of urban Kenyans rely on charcoal fuels and harmful kerosene for their cooking needs
                                                              • Charcoal (22%), kerosene (29%), and LPG (28%) are the dominant “primary” cooking fuels in urban Kenya as of 2017
                                                              • Stacking, i.e., the use of multiple fuels/stoves, is a widespread phenomenon in Kenya; charcoal and kerosene use is thus much more common
                                                                than primary cooking fuel data indicates – e.g., 2-3x urban households using charcoal vs. number that use charcoal a primary cooking fuel
                                                              • Nairobi is distinct from urban Kenya, with far higher share of households using LPG (44%) and kerosene (47%) as primary cooking fuels (2017).
                                                                Kerosene is the dominant fuel of the Nairobi poor1
                                                               Continued dependence on dirty fuels poses serious health, environmental, and socio-economic costs for Kenya
                                                              • 8-10% of early deaths are attributable to indoor air pollution from charcoal and wood cooking in Kenya; this excludes the unquantified but likely
                                                                substantial negative effects of kerosene cooking on lung function, infectious illness and cancer risks, as well as burns and poisonings
                                                              • Kenya loses 10.3 million m3 of wood from its forests every year from unsustainable charcoal and wood fuel use
                                                              • Household biomass fuel use contributes >22 million tonnes of CO2 eq each year (as high as 35 MT CO2eq including fuel production emissions),
                                                                which is equivalent to 30-40% of total Kenya GHG emissions1
                                                              Kerosene and charcoal remain dominant in urban Kenya due to the relative affordability and availability of these fuels and accompanying stoves
                                                              • Kerosene is currently the lowest cost mainstream cooking fuel in urban Kenya; charcoal bought in small amounts (i.e., tins) is the most expensive
                                                                cooking fuel, but charcoal bought in bulk by middle class consumers, i.e., in 40 kg bags, can be a fairly affordable option
                                                              • In terms of accessibility, kerosene and charcoal are currently omnipresent in urban Kenya – there are over 1,500 kerosene dispensing points in
                                                                Nairobi alone and anecdotal evidence suggests that most people in Nairobi live within a 50-150 meter walk from a charcoal seller
                                                              Clean modern cooking fuels are available in Kenya, but they have not yet overcome consumer awareness, affordability and accessibility barriers
                                                              in order to become scalable and significantly reduce use of traditional fuels
                                                              • LPG is well understood and increasingly common in urban Kenya, but despite continued investments in capacity, LPG is a solution that is unlikely
                                                                 to become the primary fuel for the majority of urban population due to high costs and limited availability outside of Nairobi. LPG also has a weak
                                                                 perception of safety as a fuel resulting from poor safety practices of the illegal grey market LPG re-fillers (estimated at 30-50% of market)
                                                              • Electricity for cooking is not viable today in Kenya and has minimal penetration (~2% in urban Kenya) due to the high costs of efficient electric
                                                                 cookstoves ($200+) of the type that could make the costs of electric cooking comparable to alternatives
                                                              • Liquid Bio-ethanol is an emerging option, but has low awareness, is only available in select geographies via early stage enterprises, and is
                                                                 relatively high cost due to unfavorable tax and tariff treatment relative to cooking fuel alternatives like charcoal, kerosene, and LPG
                                                              (1) Dalberg estimate based on bottom up build-up of Kenya cooking emissions based on fuel mix, average fuel volumes, and standard emission factors including CH4 and NO2, but
                                                              excluding BC. Note that WRI CAIT total CO2 emissions for Kenya (2013) are estimated at 60.53 MT CO2eq total, which we believe is an underestimate as the number only includes
Scaling up clean cooking in urban Kenya with LPG & Bio-ethanol - A market and policy analysis - Dalberg
Despite increased LPG use, most households still use multiple fuels and dirty
                                                              fuels – charcoal, kerosene, and wood – still dominate urban Kenya
Section II: Kenyan cooking fuel market options and snapshot

                                                                      Dirty fuels represent ~70% and ~55% of primary fuels use in                            Because most people use more than one fuel, use of dirty
                                                                                  urban Kenya and Nairobi, respectively                                       fuels is higher than primary cooking fuel data indicate
                                                                     Charcoal/kerosene are primary Nairobi cooking fuel (2016)1                            All Kenya – any use of fuel vs. primary cooking fuel2
                                                                     (% of total households (HH), N=24,000 Kenya HH self-                                  (% of total HH, N=300, Dalberg 2015 survey)
                                                                     reported primary fuel)
                                                                                                                                                                                                                      Any fuel use
                                                                                        3          5                3                                          69%
                                                                                 13                                                                                            65%                                    Main cooking fuel
                                                                                   14             28                                                                                 55%
                                                                                                                    44              Other
                                                                                   15
                                                                                                  29                                LPG                                                        35%
                                                                                                                                    Kerosene                         26%
                                                                                   55             22                47
                                                                                                                                    Charcoal                                                                   15%
                                                                                                                                                                                                     8%                 10%
                                                                                                  16                     5
                                                                                                                1                   Firewood
                                                                               All Kenya     Urban Kenya       Nairobi                                         Charcoal        Firewood        Kerosene           LPG

                                                                       Use of LPG has increased significantly since its introduction, especially in Nairobi; however, dirty fuels still dominate cooking in
                                                                       urban Kenya
                                                                       • LPG share has increased 3-4X since the early 2000s; data across this time period shows that, even in urban area, LPG use is
                                                                          concentrated amongst those earning a higher income
                                                                       • ~70% of Kenyan households in urban areas use firewood, charcoal, or kerosene as their primary fuel

                                                                       Most households use multiple fuels in any given week so, even where LPG penetration is high, households are still cooking with
                                                                       charcoal and kerosene

                                                                       Higher use of LPG among high-income Kenyans suggests that lower-income Kenyans need an alternative that can deliver similar
                                                                       benefits to LPG, while competing with charcoal and kerosene on price

                                                              Source: (1) Kenya Integrated Household Budget Survey (2018), National Bureau of Statistics; (2) Dalberg proprietary Kenya energy access survey, N=300                       7
                                                              (2015)
Scaling up clean cooking in urban Kenya with LPG & Bio-ethanol - A market and policy analysis - Dalberg
Continued dependence on these dirty fuels poses serious health, environmental,
                                                               and food insecurity risks for Kenya
Section II: Kenyan cooking fuel market options and snapshot

                                                                                                                  Impact of using biomass fuel for cooking
                                                                   Health                                          •     Indoor air pollution: 728k Disability-Adjusted Life Years (DALYs) and 16.6k deaths
                                                                                                                         annually, 8-10% of early deaths in Kenya1, likely a substantial underestimate of the
                                                                                                                         full disease burden as many negative cooking health effects have not yet been
                                                                                                                         quantified (e.g., burns, eye diseases, physical injuries from carrying firewood, etc.)
                                                                                                                   •     Lower respiratory tract disease is the third largest contributor of deaths in Kenya
                                                                                                                         while pneumonia is a major cause of death to children under the age of five, largely
                                                                                                                         due to indoor air pollution1

                                                                   Environment
                                                                                                                   • Deforestation and forest degradation: Kenya loses 10.3 million m3 of wood from its
                                                                                                                     forests every year from unsustainable charcoal and wood fuel use, a major
                                                                                                                     contributor to the 0.3% per year deforestation rate2
                                                                                                                   • GHG emissions: Household fuel use in Kenya contributes 22-35 million tonnes of
                                                                                                                     CO2 eq each year, which is equivalent to 30-40% of total Kenya GHG emissions2

                                                                   Food insecurity
                                                                                                                   • Food insecurity: deforestation, resulting from the use of dirty fuels, exacerbates
                                                                                                                     food insecurity and harms the agriculture sector. Kenya's five forest water
                                                                                                                     towers feed filtered rainwater to rivers and lakes and provide over 75 per cent
                                                                                                                     of the country's renewable surface water resources3

                                                              Note: DALY is a measure of overall disease burden, expressed as the number of years lost due to ill-health, disability or early death
                                                              Source: (1) 2016 Global Burden of Disease data; (2) Dalberg bottom up estimate triangulated with WRI CAIT (2013) Kenya GHG emissions estimates available at
                                                                                                                                                                                                                             8
                                                              https://www.climatelinks.org/sites/default/files/asset/document/2017_USAID_GHG%20Emissions%20Factsheet_Kenya.pdf; (3) UN Environment, “Deforestation costing
                                                              Kenyan economy millions of dollars each year and increasing water shortage risk”, 2016; Dalberg analysis
Scaling up clean cooking in urban Kenya with LPG & Bio-ethanol - A market and policy analysis - Dalberg
Charcoal is particularly harmful as it contributes more to household air
                                                              pollution, GHG emissions, and deforestation than other fuels
Section II: Kenyan cooking fuel market options and snapshot

                                                                 IMPACT                                Wood                                         Charcoal                                       Kerosene
                                                                 Health
                                                                 (deaths and DALYs due                       ~2k avoidable deaths                          ~3k avoidable deaths                       ~2-3k avoidable deaths
                                                                 to household air                                165k aDALYs                                  ~250k aDALYs                                ~160k aDALYs
                                                                 pollution from PM2.5)

                                                                 Environment &
                                                                                                            2.5-4.4 tonne CO2eq /                          3.6-5 tonne CO2eq /                             1 tonne CO2eq /
                                                                 climate                                      urban HH annually                             urban HH annually                             urban HH annually
                                                                 (GHG emissions)

                                                                 Social opportunity
                                                                 costs                                 0.8-1.3 avoidable hrs per day                  0.3-0.4 avoidable hrs per day
                                                                 (time opportunity costs                                                                                                              No time poverty impact
                                                                                                               per urban HH                                   per urban HH
                                                                 to fuel collection,
                                                                 cooking and cleaning)
                                                                                                                                                    • Foregone incomes for
                                                                                                                                                                                                   • Cost to economy of
                                                                                                       • Foregone incomes for                         avoidable time spent
                                                                                                                                                                                                     illicit mixing of kerosene
                                                                                                         avoidable time spent                         cooking and cleaning
                                                                                                                                                                                                     with diesel
                                                                 Household and                           cooking and cleaning                       • Avoidable spending on
                                                                                                                                                                                                   • Negative balance of
                                                                 macro- economics                      • Tax revenue loss for                         expensive fuel
                                                                                                                                                                                                     payments effects due to
                                                                                                         government given                           • Tax revenue loss for                           kerosene imports
                                                                                                         informality of market                        government given
                                                                                                                                                      informality of market

                                                              Source: Dalberg impact sizing model for rural Kenya, 2018; Household Air Pollution Intervention Tool, with customized inputs for Nairobi based respective           9
                                                              switching to LPG and ethanol consumption. Note: more qualitative detail provided in Appendix A
Scaling up clean cooking in urban Kenya with LPG & Bio-ethanol - A market and policy analysis - Dalberg
Charcoal and kerosene remain dominant in urban Kenya because of wide
                                                              availability and relative affordability…
Section II: Kenyan cooking fuel market options and snapshot

                                                                 Relatively low costs and wide availability for dirty fuels, but such fuels are increasingly expensive

                                                                    FUEL                         Affordability & availability assessment
                                                                                                 • Abundant and largely free in rural areas for collectors, though 20-30% of rural HHs buying at least
                                                                                                   some of their firewood1
                                                                                                 • Firewood is increasingly scarce and expensive in urban Kenya, particularly Nairobi (e.g., >$0.50 /
                                                                   Wood                            kg), but still fairly low cost (e.g., $0.15 / kg in Kisumu, $0.10-0.15 / kg in most rural and peri-urban
                                                                                                   Kenya)2
                                                                                                 • Traditional and moderately improved firewood stoves are free or very low cost (
… but advantage of traditional fuels vs. clean fuels is fast eroding
Section II: Kenyan cooking fuel market options and snapshot

                                                              Clean fuels face availability and affordability challenges, but both gaps are closing

                                                                 FUEL                   Affordability & availability assessment
                                                                                        • Fuel availability is fairly widespread in Nairobi (>40% use LPG as primary fuel and >60% have LPG
                                                                                          stove)1; for urban Kenya as a whole, availability is projected to increase – Kenya Pipeline Company
                                                                                          (KPC) plan to more than double LPG storage capacity by 2020
                                                                 LPG                    • LPG is largely unaffordable as a primary fuel for bottom 50-70% across urban Kenya and prices have
                                                                                          been unstable ($1.25 to 1.75 / kg over course of 2017)2
                                                                                        • High upfront stove/cylinder costs (>$100 for 2-burner)2

                                                                                        • Not widely available: residential grid provisioned for lighting only; major capex investment required
                                                                 Electricity            • Electricity costs too high for mass-market electric cooking (uptake ~5% in Nairobi, ~2% in urban Kenya)1
                                                                                        • Efficient electric stoves are priced uncompetitively (>$200) for stoves that bring costs of electric
                                                                                          cooking within realm of other fuel alternatives2

                                                                                        • Denatured Bio-ethanol* for cooking currently only available from a handful of providers that are all
                                                                                          currently at nascent or pilot scale (i.e., KOKO Networks, Leocome, Safi International), but about to scale
                                                                                          quickly – e.g., 1000 KOKO Points going live across Nairobi in late 20183
                                                                 Bio-ethanol            • Cooking with lowest cost Bio-ethanol on Kenya market is slightly more expensive than kerosene, on par
                                                                                          with LPG, and below cost of 4kg tin charcoal -- would be lowest cost option if tax and tariff regime was
                                                                                          equal to other fuels4
                                                                                        • Bio-ethanol stoves are fairly low cost ($45 for 2-burner) compared to clean alternatives like LPG4

                                                               * Bio-Ethanol cooking fuel is a clear liquid made from ~95% ethyl alcohol, 5% water, violet dye, and an industry-standard bittering agent (Bitrex) which irreversibly makes
                                                              this fuel unfit for human consumption; Excludes alcohol-based ‘gels’, which are typically higher-cost and lower-power fuels.
                                                              Note: Given combined affordability and accessibility constraints, electricity as a cooking fuel not explored in detail in this report.                                         11
                                                              Source: (1) Christian Aid (2017) survey , (2) Dalberg field research , (3) Koko Networks, (4) Dalberg analysis
Modern cooking fuels are available in Kenya, but they have not overcome
                                                              consumer awareness, affordability and accessibility adoption barriers
Section II: Kenyan cooking fuel market options and snapshot

                                                                                          LPG                                                   Bio-ethanol
                                                                 Appliances               Mix of 1-burner ‘meko’ and 2-burner stove kit         Mix of 1-burner and 2-burner Bio-ethanol stoves
                                                                                          (including hose, pressure regulator, cylinder)        from KOKO, SAFI, CleanCook

                                                                 Fuel                     • Imported                                            • Imported and domestically produced
                                                                                          • Available in cylinders of 3kg, 6kg, 13kg            • Available in 1 & 5L pre-packaged bottles
                                                                                                                                                  (or as little as 350mL in refillable 2.3L canister –
                                                                                                                                                  KOKO Networks)

                                                                 Players                  •   Total (TotalGaz)                                  •   KOKO Networks
                                                                                          •   Hashi                                             •   Leocome
                                                                                          •   Kenol Kobil (K Gas)                               •   Safi International
                                                                                          •   Kenyan Pipeline company (infrastructure)          •   Prosol Limited
                                                                                          •   Pay-as-you-go LPG pilots – (e.g., PayGo Energy,   •   IR&D Africa Limited
                                                                                              Envirofit SmartGas, KopaGas)

                                                                 Key barriers             • High upfront stove and cylinder costs               • Relatively high ongoing fuel costs due to VAT
                                                                 to scale                 • High ongoing fuel costs (especially given LPG         and tariffs vs. other fuel alternatives that do
                                                                                            not widely available in smaller quantities)           not face such duties
                                                                                          • Safety concerns by some customers                   • Very low levels of consumer and market
                                                                                          • High capital expenditures required for scaling        awareness
                                                                                            necessary infrastructure

                                                                   LPG is well-understood. Liquid Bio-ethanol is a complementary, emerging cooking fuel solution that is
                                                                                described and analyzed in more depth in the following section of this report
                                                                                                                                                                                                     12
                                                              Source: Desk research, previous Nairobi survey and focus groups.
Section III: Analysis of Bio-ethanol for cooking potential in Kenya   Bio-ethanol delivers environmental impacts comparable to LPG while requiring
                                                                      consumers to pay lower upfront costs and allowing smaller purchase sizes
                                                                              Category                                Impact of switching to Bio-ethanol                                                       Impact of switching to LPG

                                                                                                        •     Up to 30 trees saved per HH annually from                                        •     Up to 30 trees saved per HH annually from
                                                                                                              switching from charcoal1                                                               switching from charcoal1
                                                                                                        •     Slows down rate of deforestation and,                                            •     Slows down rate of deforestation and,
                                                                                                              consequently, its impact on food insecurity                                            consequently, its impact on food insecurity
                                                                                                        •     0.7-3.3 tonne reduction in GHG emissions per HH                                  •     0.5-3.1 tonne reduction in GHG emissions per
                                                                           Environmental
                                                                                                              per year from switching from kerosene and                                              HH per year from switching from kerosene and
                                                                                                              charcoal respectively2                                                                 charcoal respectively2
                                                                                                        •     ~0.25 DALYs saved per HH per three year                                          •     ~0.25 DALYs saved per HH per three year
                                                                                                              intervention period from switching from charcoal                                       intervention period from switching from
                                                                                                              and kerosene                                                                           charcoal and kerosene
                                                                                                        •     Reduction of ~50 deaths per 25,000 households                                    •     Reduction of ~50 deaths per 25,000
                                                                                 Health                       from reduced indoor air pollution3                                                     households from reduced indoor air pollution3
                                                                                                        •     Safety risks of storage, handling and use are lower
                                                                                                              for a liquid than pressurized gas

                                                                                                        •     Distributed in smaller volumes, making it more                                  •     Higher upfront costs and requires purchasing in
                                                                                                              accessible to lower-income users                                                      larger bundle sizes
                                                                                                        •     Existing domestic Bio-ethanol sector could be                                   •     20-40 mins saved per HH per day from switching
                                                                              Economic /                      expanded, creating formal, taxable jobs and                                           away from charcoal4
                                                                              opportunity                     boosting smallholder farming income
                                                                                 costs                  •     20-40 mins saved per HH per day from switching
                                                                                                              away from charcoal4
                                                                      Source: (1) Calculations based on FAO, “Logistics of Charcoal Production”, 2010; (2) bottom up build of HH emissions at point of fuel consumption and including fuel production
                                                                      w/ average emissions factors - charcoal stove used is KCJ; (3) assumes average 50 ug/m3 24hr emissions of 50 for both LPG and Ethanol based on lab data, field data ranges are    13
                                                                      15-71 ug/m3 for LPG, 30-100+ for ethanol, but field numbers not apples to apples given ambient pollution variation; (4) Koko data triangulated with Project Gaia reports for
                                                                      CleanCook in Madagascar and Tanzania; independent reports for Haiti; SafiJiko in Kenya; evidence seems to point to comparable LPG and Ethanol stove cooking times
The Government of Kenya has intervened to promote LPG; policy action is
                                                              now needed to level the playing field for Bio-ethanol
Section II: Kenyan cooking fuel market options and snapshot

                                                                                                                                    • ‘Kerosene-Free Kenya’ campaign aims to phase out the use of
                                                                                                                                      kerosene for lighting and cooking, and replace it with clean energy
                                                                                                                                      sources, including plans to increase taxes on kerosene. This would
                                                                                            Curb use of dirty
                                                                                                                                      also reduce the illicit use of kerosene to dilute diesel
                                                                                            fuels and stoves
                                                                                                                                    • Efforts to regulate the charcoal industry by providing support for
                                                                                                                                      sustainable production and community forest management are
                                                                     The government is                                                minimizing impact of charcoal use
                                                                         using a two-
                                                                      pronged strategy
                                                                      to promote clean                                              • GoK has introduced fiscal
                                                                     cooking in Kenyan                                                                                                        Policy support        LPG   Ethanol
                                                                                                                                      incentives to reduce costs of
                                                                         households                                                   clean cooking                                           Remove import duty    ✓

                                                                                                                                                                                  FUEL
                                                                                                                                    • VAT zero-rating for LPG has
                                                                                             Promote clean                            reduced prices and
                                                                                                                                                                                              VAT zero-rating       ✓
                                                                                              cooking fuels                           Mwananchi Gas Project                                   Reduce import duty    ✓

                                                                                                                                                                                  APPLIANCE
                                                                                               and stoves                             subsidizes cost of cylinders
                                                                                                                                    • Remaining duties and VAT
                                                                                                                                                                                              Remove VAT            ✓      ✓
                                                                                                                                      on Bio-ethanol stoves and                               Subsidize appliance   ✓
                                                                                                                                      fuel adds cost to customers

                                                                            To date, Bio-ethanol for cooking has not been as much a target of government intervention
                                                                             despite being a high-impact clean fuel option, mainly due to limited private sector activity

                                                              Source: Stakeholder interviews; Stockholm Environment Institute discussion brief on the Kenyan charcoal sector; Various newspaper articles; Dalberg                   14
                                                              analysis
SECTION III: POTENTIAL OF BIO-ETHANOL FOR COOKING IN KENYA
Section III: Potential of Bio-ethanol for cooking in Kenya

                                                             The health, environmental, and other social impacts of transitioning from more traditional fuels (e.g., firewood, charcoal, and kerosene) are
                                                             well documented; while LPG has enjoyed more visibility and promotion in Kenya, the potential benefits of transitioning to Bio-ethanol are
                                                             also significant at a HH level
                                                             • Switching from charcoal to either Bio-ethanol or LPG could save up to 30 trees and reduce 3-5 tonnes of GHG emissions per household
                                                             • Bio-ethanol and LPG have average PM2.5 emissions much lower than those of traditional fuels
                                                             • Transitioning all kerosene and charcoal users in Nairobi to Bio-ethanol could result in up to 2mn tonnes GHGs and 200,000 DALYs averted
                                                                annually
                                                             • This transition would also counteract deforestation and its negative effects on agricultural yields and food insecurity

                                                             Bio-ethanol can also deliver additional economic benefits
                                                             • As local demand is unlocked and the necessary investments are made, the existing local technical alcohol industry could be expanded to serve
                                                                this demand, creating jobs across the value chain
                                                             • While these will displace jobs in the charcoal value chain, they will generally be of higher-quality and better paying, and potentially taxable,
                                                                providing the government with additional resources to invest other job creation activities for displaced persons

                                                             Bio-ethanol is becoming cost-competitive and scalable as a cooking solution, given innovations that leverage localized distribution technology
                                                             and existing downstream infrastructure
                                                             • Bio-ethanol V2.0 model has shrunk logistics costs between the landed cost and final price to customer, with taxes now driving ~25% of final
                                                                price
                                                             • Bio-ethanol V2.0 can be scaled with significantly lower capital expenditures than required for scaling LPG

                                                             The partnership between Vivo Energy, a downstream fuel trading company, and KOKO Networks, a hardware and software technology
                                                             company enabling the last-mile distribution of Bio-ethanol fuel, is the leading example of V2.0 in Kenya
                                                             • Leveraging existing fuel infrastructure, sales points, and mobile and cloud technology, KOKO’s model delivers fuel closer and more cheaply to
                                                               customers
                                                             • Vivo Energy uses KOKO technologies to safely and efficiently add a new line of liquid fuel to its existing downstream infrastructure
                                                             • With this model, Bio-ethanol is sold to customers at $0.85 / L
                                                                                                                                                                                                               15
                                                             Note: statistics repeated and sourced on following pages. More detailed impact analysis contained in Appendix B
Alcohol-based cooking has a decades-long history, but only in niche markets
Section III: Potential of Bio-ethanol for cooking in Kenya

                                                                 History of Bio-ethanol
                                                                  World War II:                    Early 21st century:        2014-17: V1.0
                                                                Soldiers & farmers                 Adapted for use in     Bioethanol cooking fuel
                                                                   used alcohol                  refugee camps in East    companies launched in
                                                                produced on farms               Africa; non-commercial    many African countries

                                                                         Late 20th century:         2013: First commercial V1.0                2017: First V2.0
                                                                  Used for camping, recreational venture for Bio-ethanol cooking             ethanol cooking fuel
                                                                 vehicles; distributed by European captured 10% of Maputo HHs               solution commercially
                                                                  and North American companies     within a year of retail launch            launched in Nairobi

                                                                 Bio-ethanol production
                                                                          Sugar feedstocks                    Edible sugar       molasses
                                                                                                                                                     Bio-ethanol made from
                                                                          (e.g., sugar cane)
                                                                                                                                                     molasses byproduct or
                                                                                                                                                             syrup
                                                                          Starch feedstocks
                                                                         (e.g, maize, grains)                            Syrup                         Denatured technical
                                                                                                                                                    alcohol used for cooking is
                                                                       Cellulosic feedstocks
                                                                                                                                                          the cheapest
                                                                       (e.g., waste residues)

                                                                                                                                                                                  16
                                                             Source: Expert interviews.
A transition of all kerosene / charcoal users in Nairobi to Bio-ethanol could
                                                             result in ~2mn tonnes GHGs, 200K DALYs, and 1,500 deaths averted p.a.
Section III: Potential of Bio-ethanol for cooking in Kenya

                                                                                A full transition of kerosene and charcoal users to Bio-ethanol in Nairobi alone
                                                                                       would help towards achieving the Sustainable Development Goals

                                                                                                                                                                                    Difficult to quantify given poor
                                                                                           ~200,000 DALYs and 1,500 deaths
                                                                                                                                                                                   data, but most time savings from
                                                                                              averted3 4 over a three year
                                                                                                                                                                                   collection, cooking, and cleaning
                                                                                                  intervention period
                                                                                                                                                                                         will accrue to women

                                                                                                                                                                                 Reduction of 2mn tonnes of CO2eq
                                                                                                                                                                                            emissions1
                                                                                                    USD 60mn in annual
                                                                                                     consumer savings4                                                             This represents 2-3% of Kenya’s
                                                                                                                                                                                  annual GHG emissions and 10% of
                                                                                                                                                                                  Kenya’s 2030 GHG reduction goal2

                                                             Note: (1) Kyoto particles and black carbon CO2 equivalents;
                                                             Source: (2) Kenya’s Intended Nationally Determined Contribution, Ministry of Environment and Natural Resources, 2015. (3) HAPIT model; (4) Dalberg        17
                                                             Nairobi impact model. See Appendix B for methodology.
Recent innovations enable Bio-ethanol to undercut dirty fuels and quickly
                                                             scale
Section III: Potential of Bio-ethanol for cooking in Kenya

                                                                                                                                                                        User           Payments
                                                                                       Urban storage          Packaging        Distribution           Retail
                                                                                                                                                                     experience       and tracking

                                                                   V1.0 Centralized                                          Low-capacity        Small shops
                                                                                                                                                                                        Cash and
                                                                  Bottling Approach                                             trucks           & high fast-
                                                                                                            Expensive,                                               Pour from        clipboards;
                                                                                          Large,                             transporting           moving
                                                                                                           thick plastic                                          bottle; wipe up       stock on
                                                                                        centralized                          bottles from         consumer
                                                                                                            disposable                                                spillage;      consignment,
                                                                                      bottling facility                     central facility    goods (FMCG)
                                                                                                              bottles                                              discard bottle      leading to
                                                                                                                              and across           industry
                                                                                                                                                                                       stockouts
                                                                                                                            long distances         margins

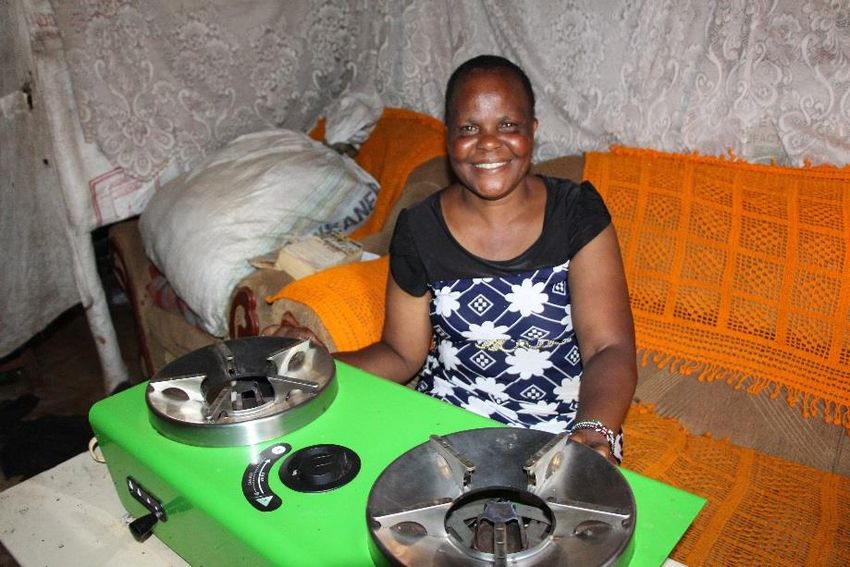
                                                                V2.0 Smart Fuel ATM                                                                                 Safely dock
                                                                 Network Approach      Distributed                                                Fuel ATMs       reusable, valve-
                                                                                                           Zero recurring         Small                                              100% digital
                                                                                        storage in                                               inside shops        controlled
                                                                                                          packaging costs    retrofitted fuel                                         payments;
                                                                                       customised                                               with low fuels-    canister with
                                                                                                               as fuel      tankers for last-                                         automated
                                                                                         tanks at                                                  industry        ATM & stove
                                                                                                           distributed in     mile, slashing                                           inventory
                                                                                      existing petrol                                             margins for
                                                                                                             bulk form        logistics costs                                        management
                                                                                         stations                                                shopkeepers      No spillage, no
                                                                                                                                                                   plastic waste

                                                                      “V2.0 Smart Fuel ATM” approach leverages technology and downstream fuels infrastructure to
                                                                    remove over 50% of supply chain costs within the traditional “V1.0 Centralized Bottling” approach

                                                                                                                                                                                                    18
                                                             Source: KOKO Networks
V2.0 approach enables Bio-ethanol to now scale competitively with other
                                                             fuels
Section III: Potential of Bio-ethanol for cooking in Kenya

                                                                                                     Charcoal            Kerosene                     LPG                Bio-ethanol V1.0                Bio-ethanol V2.0
                                                                      Fuel retail price                                                       $1.70-1.75 / kg              $0.90 - $1.10 / L                  $0.85 / L
                                                                                                                                               for 6kg, 13kg             with small volumes              sustainable at scale
                                                                                                  $0.30 - $0.45            $0.75 -               cylinders,                 of Kenyan fuel               with imported Bio-
                                                                                                      / kg1               $0.85 / L2                                        >$1.48 at large               ethanol, including
                                                                                                                                               >$3.00 / kg for           scale with imported             $0.21 / L of VAT and
                                                                                                                                                 PAYG LPG3                   Bio-ethanol4                   import tariffs4
                                                                      Annual cooking                                                                                       $234 – 297 (with
                                                                      cost for                                                                                             locally-produced
                                                                                                                                                                             Bio-ethanol)
                                                                      average Nairobi                                                                $233
                                                                                                    $207 - 249               $224                                                                              $220 - 230
                                                                      HH6                                                                                                 $385 (at scale w/
                                                                                                                                                                           imported Bio-
                                                                                                                                                                             ethanol*)
                                                                      Stove retail                                                              $40-50 for 1-
                                                                                                       $7 KCJ,
                                                                      price7                                                                 burner, $100-120                 $50 - $70 for             $45 for 2 burner and
                                                                                                      $25 - 35
                                                                                                                           $6 - $20          for 2-burner (incl.             2 burner stove               $30 for 1-burner
                                                                                                        Burn/
                                                                                                                                               hose, regulator,             (SAFI, Dometic)                    (KOKO)
                                                                                                      Envirofit
                                                                                                                                              cylinder deposit)

                                                                              “V1.0 Centralized Bottling” approach has difficulty competing at scale, once limited volumes
                                                                              of Kenyan Bio-ethanol are absorbed and imports are required
                                                                              “V2.0 Smart Fuel ATM” approach delivers cost savings that are a critical enabler of scale.

                                                             Source: (1) Business Daily Africa, “More pain for poor as charcoal price its Sh 2,500 a bag”, 2018; (2) Business Daily, “ Gas Prices Fall by Over Sh 600 in 2015”;
                                                             (3) Timetric LPG data 2018; (4) KOKO Networks pricing data 2018; (6) Based on 3,500 MJ per HH per year – this is a triangulated figure based on: World Bank
                                                             Development Research Group, “Household Cooking Fuel Choice and Adoption of Improved Cookstoves in Developing Countries”, 2014; University of Nairobi
                                                             and Plank Institute for Chemistry, “Biofuel consumption rates and patterns in Kenya”, 2002; O’Sullivan and Barnes, “Energy Policies and Multiptopic                  19
                                                             Household Surveys, 2007; Dalberg Nairobi fuel household survey 2018 (7) Stove prices from Dalberg field research
V2.0 Case Study: Vivo Energy Kenya uses KOKO technologies to safely add a
                                                             4th line of liquid fuels to its existing infrastructure and increase its reach
Section III: Potential of Bio-ethanol for cooking in Kenya

                                                                  Vivo sources and stores both domestic    Vivo MicroTankers equipped with               KOKO technologies capture data across
                                                                  Bio-ethanol and foreign imports, using   KOKO’s Smart Tanker System perform            the fuel supply chain and facilitate
                                                                  KOKO technologies to ensure visibility   last-mile delivery to KOKOpoint Fuel          payments
                                                                  of fuel flows                            ATMs located in neighbourhood shops
                                                                  ▪ Bio-ethanol is stored in dedicated     ▪ KOKOpoints are refueled via a secure        ▪   KOKO’s Network Operations Centre
                                                                      underground tanks at urban petrol        external refilling box, located on the        ensures complete visibility and
                                                                      stations                                 outside of the shop                           control across the fuel supply chain
                                                                  ▪ Stations install KOKO’s Smart Depot    ▪   A vapor recovery line ensures no          ▪   KOKOpoint sensors transmit technical
                                                                      System to control and manage fuel        escape of vapor at any point – all            health, safety, inventory and
                                                                      flows                                    vapor is safely transferred back to the       transaction information in real-time
                                                                                                               Vivo service station                      ▪   KOKO Settlement & Payments System
                                                                                                                                                             automates and de-risks payment
                                                                                                                                                             flows between Vivo and retailers

                                                                                                                                                                                                    20
                                                             Source: KOKO Networks
V2.0 Case Study: Leveraging sales points, and mobile / cloud tech, KOKO’s
                                                             model delivers fuel closer and more cheaply to customers
Section III: Potential of Bio-ethanol for cooking in Kenya

                                                                   KOKOpoints are deployed densely         At a KOKOpoint, customers order           KOKOpoint syncs to customer’s KOKO
                                                                   across the city, inside neighbourhood   stoves and use their reusable “smart-     account and allows purchases of as little
                                                                   shops and convenience stores            valve” canister to safely purchase fuel   as ~350mL
                                                                   ▪ KOKOpoints are located within a       ▪   New customer orders an Bio-ethanol    ▪ Chip inside canister instantly
                                                                       short walk of target households.        stove (1- or 2-burner) from local         recognises customer details, synching
                                                                   ▪ Shopkeepers become KOKO Agents,           KOKOpoint or via mobile                   with customer’s KOKO account
                                                                       with KOKOpoint installed in shop    ▪   Stove and canister are ready for      ▪   KOKO’s dispenser-based distribution
                                                                       under franchise agreement.              customer collection the next day          model allows customers to buy fuel
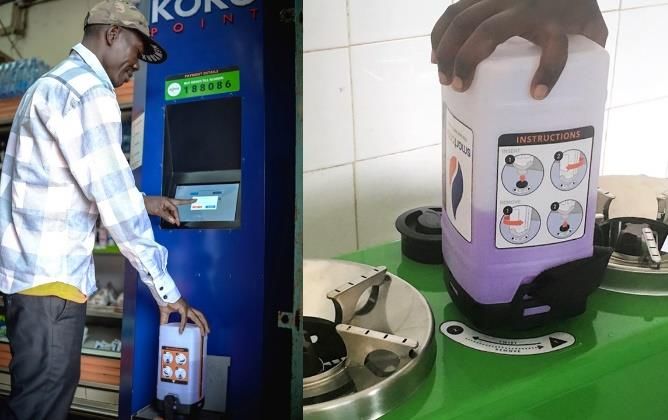
                                                                                                           ▪   Customers pre-pay and top-up KOKO         from as little as KES 30/bundle
                                                                                                               account using mobile money –              (~350ml)
                                                                                                               entire system is cashless             ▪   Customer selects fuel volume to buy;
                                                                                                           ▪   Vapor-tight “smart-valve” system          no penalty for buying smaller amount
                                                                                                               ensures that fuel can only be
                                                                                                               obtained from a KOKOpoint or
                                                                                                               added to a stove with the canister

                                                                                                                                                                                                 21
                                                             Source: KOKO Networks
V2.0 innovations mean that Bio-ethanol can be delivered at scale to the
                                                             customer at a price up to ~40% less than the V1.0 approach
Section III: Potential of Bio-ethanol for cooking in Kenya

                                                                  Supply chain margins for Bio-ethanol
                                                                  (% of total cost)

                                                                                         -43%
                                                                                1.48                                                             Bio-ethanol V2.0 costs are
                                                                                                           Taxes
                                                                                                                                                 significantly lower than those of Bio-
                                                                                0.29                       Logistics, Distribution, and Retail
                                                                                                                                                 ethanol V1.0
                                                                                                           Landed Supply Cost
                                                                                                                                                 •   Leveraging existing downstream
                                                                                                                                                     infrastructure can cut down bulk
                                                                                                                                                     storage and transport costs by
                                                                                                   0.85                                              ~90%
                                                                                0.84               0.21                                          •   Technology-enabled distribution
                                                                                                                                                     can reduce combined distribution
                                                                                                   0.29                                              and retail costs by ~45%
                                                                                                                                                 •   Aside from landed supply cost,
                                                                                                                                                     taxes drive the retail price of Bio-
                                                                                0.35               0.35                                              ethanol V2.0

                                                                              V1.0            V2.0 Smart
                                                                           Centralized        Fuel ATMs
                                                                            Bottling                                                                                                        22
                                                             Source: KOKO networks, expert interviews.
Bio-ethanol V2.0 can be scaled with significantly lower capital expenditure
                                                             than required for scaling LPG
Section III: Potential of Bio-ethanol for cooking in Kenya

                                                                         Incremental investment required to extend supply to 2 million additional HHs in urban Kenya, (USD million)

                                                                                                    Bio-ethanol1                                                                       LPG2

                                                                                                                                                                                                164      290
                                                                                                                                                                                       Trucks

                                                                                                                                                                                   Cylinders

                                                                                                                                                                                  98
                                                                                                                                                                       Tankers

                                                                                                                                                                 Depots and
                                                                                                                                                                 filling plants
                                                                                                                  16                                              27
                                                                                                            Micro-tankers        16
                                                                                 0.05            0.08        Retail points
                                                                               Terminal          Bulk     Last mile             Total                         Terminal            Bulk     Last mile     Total
                                                                                             storage and distribution                                                         storage and distribution
                                                                                              transport                                                                        transport

                                                                                             Capex requirement for scaling LPG in Kenya is 18x that of Bio-ethanol V2.0 model

                                                             Note: Terminal includes: LPG: terminal capacity increase, Bio-ethanol: fuels lines from ship to port.                                               23
                                                             Source: (1) KOKO Networks business model assumptions, expert interviews; (2) GLPG Kenya Market Assessment, 2013.
Section IV: Bio-ethanol policy analysis
                                          Bio-ethanol is a scalable clean fuel option – especially using latest technologies – but taxation is affecting customers’
                                          ability to access fuel at lowest possible cost
                                          • Given the limited local production of technical Bio-ethanol, imports will be necessary to meet the potential demand in the
Section IV: Bio-ethanol policy analysis

                                            short- to medium-term
                                          • Only 1.8m L of viable technical Bio-ethanol are produced Kenya versus a potential demand of ~120mn L in Nairobi alone
                                          • Technical Bio-ethanol faces 16% in VAT and 25% in duties compared to 0% for most other fuels, with the exception of
                                            kerosene, which faces a 9% excise duty; this inflates the cost at which Bio-ethanol cooking fuel can be sold to customers
                                          • In fact, Kenya ranks below other sub-Saharan African countries in terms of Bio-ethanol-friendly policy, with combined
                                            duties and VAT of 41% for Bio-ethanol, vs. an average of 33% for 21 sub-Saharan African countries for which data was
                                            available
                                          • These taxes and tariffs now drive ~25% of Bio-ethanol retail price

                                          In the long run, Bio-ethanol could be produced locally after first proving demand using imports
                                          • Scaling the local industry will require a phased approach as potential investors (i.e., those likely to provide the project
                                             finance to build more dedicated Bio-ethanol plants in Kenya) will want to see a track-record of demand
                                          • Once this demand is unlocked with a reliable supply of imports, domestic production will follow to serve it

                                          Tax concessions would accelerate unlocking the Bio-ethanol cooking fuel opportunity by levelling the playing field and
                                          making prices more competitive
                                          • Levelling the playing field by granting denatured technical alcohol a VAT-zero rating and eliminating related tariffs would
                                            make Bio-ethanol fuel the cheapest option, providing Kenyans with an affordable alternative to traditional fuels and
                                            delivering up to a USD60mn saving to customers annually
                                          • Plans to increase taxes on kerosene and recent spikes in local Kenyan charcoal prices due to local logging bans reinforce
                                            the need for cheaper alternatives for the lowest income users                                                               24
                                          Note: statistics repeated and sourced on following pages. More detailed impact analysis contained in Appendix B
Given the limited local production of technical Bio-ethanol, imports will be
                                          necessary to meet the potential demand in the short- to medium-term

                                                   Bio-ethanol volumes in Kenya (million liters per year)
Section IV: Bio-ethanol policy analysis

                                                                                                                                          116.6
                                                                                                                                                                        Currently, most of the Bio-
                                                                                                                                                                        ethanol produced locally is
                                                                                                                                                                        high-grade Bio-ethanol
                                                            55                                                        114.8                                             used by the beverage
                                                                                                                                                                        industry, and not for
                                                                               53.2                                                                                     cooking; at 1.8 million1
                                                                                                                                                                        liters of local technical Bio-
                                                                                                    1.8                                                                 ethanol production, only
                                                     Total ethanol High-grade                  Technical  Supply gap Addressable                                        ~1.5% of just Nairobi’s
                                                      production    ethanol                     ethanol  for producing market for                                       potential addressable
                                                                   production                 production cooking fuel     ethanol                                       market2 would be served
                                                                                                                       cooking fuel
                                                                                                                         (Nairobi)

                                                       Building up the local industry for industrial Bio-ethanol would require first unlocking
                                                          demand; tax concessions could facilitate this by allowing Kenyan customers to
                                                                 purchase Bio-ethanol at prices lower than charcoal and kerosene

                                          (1) Accounts for 3-5% of total ethanol production from the top three ethanol plants in Kenya (2) Assumes full transition away from charcoal and kerosene to
                                          Bio-ethanol as a primary cooking fuel for the top 50% households by income                                                                                     25
                                          Source: KOKO Networks; Dalberg analysis
Duty and VAT for denatured technical Bio-ethanol imports are much higher
                                          than those applied to other cooking fuels

                                                                Kenyan duty and VAT rates for cooking fuels
Section IV: Bio-ethanol policy analysis

                                                                  FUEL                                           Effective duty                               Effective VAT

                                                                  Charcoal                                                         N/A                                       N/A1

                                                                  LPG                                                              0%                                         0%

                                                                  Kerosene                                                         9%2                                        0%

                                                                  Denatured technical Bio-
                                                                                                                                  25%                                        16%
                                                                  ethanol

                                                                        Bio-ethanol is at a major disadvantage compared to the rest of the fuel
                                                                         sector; duty + VAT represents 25% of the retail price to the customer3

                                          Note: (1) Most charcoal consumed in Nairobi is supplied through informal markets hence virtually no tariff or taxes are collected (2) Based on 7.25 KES excise
                                          duty charged on a liter of kerosene (3) KOKO Networks retail analysis                                                                                            26
                                          Source: Petroleum Institute of East Africa; World Integrated Trade Solution; PwC, Overview of VAT in Africa
In fact, Kenya ranks below other Sub-Saharan African countries in terms of
                                          Bio-ethanol-friendly policy
                                               Duty and tax burden on imported denatured Bio-ethanol
                                               Subset of 21 SSA nations, reflecting duties + taxes, %
                                                                                                                                                                                            Import tariff
Section IV: Bio-ethanol policy analysis

                                                                                                 10                                                                                         VAT
                                                           Nigeria
                                                     Sierra Leone                                                          20
                                                          Zambia                                                             21
                                                              DRC                                                                         26
                                                            Benin                                                                              28
                                                     Burkina Faso                                                                              28
                                                     Cote D’Ivoire                                                                             28
                                                              Mali                                                                             28
                                                          Senegal                                                                              28
                                                           Angola                                                                                   30
                                                           Ghana                                                                                                 35
                                                     Mozambique                                                                                                       37
                                                            Congo                                                                                                          39
                                                       Cameroon                                                                                                             39
                                                      Madagascar                                                                                                             40
                                                            Kenya                                                                                                              41
                                                          Burundi                                                                                                                    43
                                                          Rwanda                                                                                                                     43
                                                         Tanzania                                                                                                                    43
                                                          Uganda                                                                                                                     43
                                                           Algeria                                                                                                                                   49
                                                                                                                                                                                                            27
                                          Source: WTO, most recent data as of April, 2018 for product 220720 - ethyl alcohol and other spirits, denatured, any strength; PwC Overview of VAT in Africa
Granting Bio-ethanol a VAT-zero rating and eliminating tariffs would make it
                                          the cheapest cooking fuel option for Kenyans

                                                      Average annual fuel expenditure by fuel type to meet 3,500 MJ fuel consumption of a typical Nairobi household1
                                                      USD / year
Section IV: Bio-ethanol policy analysis

                                                     March 2018                                                                                                          Assuming:
                                                 charcoal price spike                                                                                                            Average Stove Efficiency
                                                   of up to 0.5/kg                                                                                                               Minimum Stove Efficiency
                                                   drove up prices
                                                   even at average                                                                                                               Max Stove Efficiency
                                                   stove efficiency
                                                                                                                                                                                 Recent charcoal price spike 2
                                                                                                                      226               233
                                                                          228                  224
                                                                                                                                                                   176
                                                                                                                                                                                     Bio-ethanol after tax reduction

                                                                        Charcoal            Kerosene                Ethanol                 LPG            Ethanol after tax
                                                                                                                                                          and tariff reduction
                                                                                                                                                             / elimination
                                                    Price               $0.40/kg              $0.79/L               $0.82/L              $1.70/kg               $0.64/L3

                                          (1) 3,500 MJ is triangulated figure based on: World Bank Development Research Group, “Household Cooking Fuel Choice and Adoption of Improved
                                              Cookstoves in Developing Countries”, 2014; University of Nairobi and Plank Institute for Chemistry, “Biofuel consumption rates and patterns in Kenya”,
                                              2002; O’Sullivan and Barnes, “Energy Policies and Multiptopic Household Surveys, 2007; Dalberg Nairobi fuel household survey 2018
                                          (2) Recent price spike in charcoal price reach $0.5/kg and continue to rise; this is due to a ban on illegal logging introduced by the government in addition to
                                              the expected upswing during the wet season
                                          (3) Assumes V2.0 model and using imported Bio-ethanol                                                                                                                        28
                                          Source: Renetech 2017; TERI 2016; Kenya institute for Public Policy Research and Analysis 2010; KOKO Networks consumer research; Dalberg Analysis
This reduction in taxes and tariffs could lead to savings of up to USD 60mn
                                          per year for consumers in Nairobi, if they switch to Bio-ethanol

                                                  Aggregate household savings by income segment with 100% charcoal and kerosene households switching to
                                                  Bio-ethanol1
                                                  USD per year                                                       New Bio-ethanol price: USD 0.64/L
Section IV: Bio-ethanol policy analysis

                                                                                                          Middle income HH could
                                                                                                          save up to $50 per year
                                                                  Poorest income HH could                 by switching completely
                                                                   save up to $60 per year                     to Bio-ethanol
                                                                  by switching completely
                                                                       to Bio-ethanol                                                                                        60mn
                                                                                                                                              3mn

                                                                                                              17mn
                                                                               40mn

                                                                           Poorest 50%                    Middle 30%                      Upper 20%                          Total
                                                                        < $200 / month               $200 – 500 / month                >$500 / month
                                          Assumptions: 100% of poorest, middle and upper income charcoal and kerosene users switch to Bio-ethanol; no LPG users switch to Bio-ethanol in lower,
                                          middle or wealthiest – these estimates are therefore the upper limit to savings
                                          Source: (1) Household segmentation based on a triangulation of: Kenya Population and Housing Census 2009; Kenya National Bureau of Statistics, “FinAccess   29
                                          Household Survey” and “Kenya Integrated Household Budget Survey, 2016; Kenya Dalberg Nairobi household survey 2016; KOKO household survey 2017
Proving the strength of urban markets will unlock the conditions to grow a
                                          domestic Bio-ethanol industry over medium to long term to meet demand
Section IV: Bio-ethanol policy analysis

                                                        • Proof of domestic market         • Growth of local farmers and           • Established Kenyan Bio-
                                                          established through lowering       processing plants                       ethanol production
                                                                                                                                   • Farmers growing Bio-ethanol
                                           Activities

                                                          of trade barriers                • Government to incentivizing
                                                        • Full demand for Bio-ethanol        private sector investment in            crops and network of
                                                          satisfied through imports          smallholder farms for new Bio-          factories processing crops
                                                          (e.g. from Sudan, Mauritius,       ethanol crops, and encourage          • Government creates regional
                                                          Pakistan)                          efficient use of wasted molasses        Bio-ethanol export strategy,
                                                        • Government identifying land      • Public/private development of           after proving domestic
                                                          for domestic production            logistics networks for distribution     success and scalability

                                                        The Kenyan beverage alcohol market is a good example of how imports were used to prove latent
                                                         demand; once this was clear, local molasses producers built Bio-ethanol plants in order to serve
                                                        the beverage market. Now there are three Bio-ethanol producers in Kenya, producing 50mn liters
                                                                               annually and exporting to Uganda and Tanzania
                                                                                                                                                                    30
                                          Source: Expert interviews
Risks often associated with Bio-ethanol are overstated; in fact, the cooking
                                          Bio-ethanol industry can drive economic growth in Kenya

                                                                             Potential risks associated with Bio-ethanol                             In fact, Bio-ethanol use presents opportunities
                                                                             are often overstated and largely addressable                            to strengthen the Kenyan economy
Section IV: Bio-ethanol policy analysis

                                                  Tax revenue                Largest potential negative tax impact –                                 Domestic Bio-ethanol production will create
                                                                             revenues lost from kerosene imports – will                              formal, income tax-paying jobs
                                                                             happen regardless, since government
                                                                             advocating a Kerosene Free Kenya1

                                                Trade balance                Initial negative impact of imported Bio-                                In the future, domestically produced Bio-
                                                                             ethanol will decrease as domestic                                       ethanol could replace imported kerosene,
                                                                             production develops                                                     improving the trade balance; Kenya could one
                                                                                                                                                     day be a regional net exporter of Bio-ethanol

                                                        Jobs                 Jobs lost in the charcoal industry are low                              A domestic Bio-ethanol industry serving
                                                                             quality, low paying, and highly seasonal and                            500,000 customers could create 40-70K new
                                                                             likely to be lost anyway, given government’s                            jobs, generating USD 17-35mn in
                                                                             goals to curb charcoal production                                       incremental incomes2

                                                 Food security               Negative impact of Bio-ethanol production                               Charcoal production depletes non-renewable
                                                                             on food security has not been observed in                               forests, leading to land degradation;
                                                                             other cases; in Kenya, < 1% of arable land                              reducing charcoal use could actually
                                                                             would be required for Bio-ethanol                                       enhance food security
                                                                             production2
                                                                                                                                                                                                       31
                                          Source: (1) Lighting Africa, “Kerosene-free Kenya”, 2012; (2) Ndegwa et al, “Potential for Biofuel Feedstock in Kenya”, 2011; (3) Expert interviews and
                                          Dalberg analysis
Section V: Conclusions

                          1. Ultimately, the desired outcome underlying this report is that Kenyan consumers have
                             access to safe and clean cooking fuel options at the lowest possible cost
                          2. Today, there are viable clean cooking fuel options that can serve the Kenyan population
                             currently paying for their fuel – these users are concentrated in urban Kenya
Section V: Conclusions

                          3. Bio-ethanol and LPG are indisputably cleaner and safer options than charcoal, kerosene,
                             and firewood – better for Kenyans and better for the environment as a whole
                          4. Use of LPG has successfully expanded and it remains a key solution; now, Bio-ethanol too
                             is well-positioned to be a mass-market solution for urban Kenya
                          5. The GoK and other stakeholders have been proactive in promoting clean fuels; there
                             remain opportunities to further eliminate barriers to drive adoption of clean fuels
                          6. Bio-ethanol delivers equivalent health and environmental benefits as LPG, and it can now
                             be distributed at prices affordable to lower and middle income Kenyans
                          7. In order for the Bio-ethanol opportunity to be fully realized, there needs to be a level
                             playing field to compete with other cooking fuels; specifically, VAT and import tariffs need
                             to be eliminated to reduce the end cost to Kenyan consumers

                                                                                                                       32
Comparison of primary cooking fuel options in Urban Kenya

                                                                          Charcoal                          Kerosene                             Bio-ethanol                                  LPG
Section V: Conclusions and Recommendations

                                                                 •   Highest PM2.5 exposure       • High PM2.5 exposure                   • Low PM2.5 exposure                   • Lowest PM2.5 exposure
                                                                     and GHG emissions            • Lower GHG emissions                   • Lowest GHG emissions                 • Low GHG emissions
                                                                 •   Key driver of                  than charcoal, but still              • Domestic production and              • Negative impact on trade
                                                    Impacts

                                                                     deforestation and,             higher                                  job creation opportunity               balance
                                                                     consequently, food           • Safety concerns (fires and            • Shorter-term negative
                                                                     insecurity                     burns)                                  impact on trade balance
                                                                                                  • Negative impact on trade                given imports (until
                                                                                                    balance given imports                   domestic industry grows)

                                                                 • Cheapest per unit price        • Widely available                      • Not well-understood; low             • High consumer awareness
                                                                 • Annual cost of cooking           throughout mass-market                  consumer awareness                   • Availability constrained
                                                                   varies based on stove            neighborhoods at hyper-               • Comparable annual cost                 outside of Nairobi, but
                                                Affordability/
                                                accessibility

                                                                   efficiency; historically low     local distribution points               of cooking to charcoal;                access high in capital
                                                                   on average though now at       • Lowest annual cost of                   prices inflated by                   • Highest price and annual
                                                                   high point                       cooking                                 disproportionate taxes                 cost of cooking
                                                                 • Relatively low upfront         • Low upfront stove cost                • Relatively high upfront              • Highest upfront stove cost
                                                                   stove cost                                                               stove cost vs. baseline
                                                                                                                                            charcoal (competitive vs.
                                                                                                                                            clean fuel alternatives)

                                                                 •                                •                                       • Recent innovations have              • Highest capital
                                                 Potential
                                                 for scale

                                                                     Already available at scale       Already available at scale
                                                                                                                                            reduced capital required               expenditures required for
                                                                                                                                            to scale                               scale

                                             Note: PM2.5 exposure and GHG emissions figures depend on combination of fuel and stove used; however, conclusions hear take into consideration the
                                             range of likely combinations.                                                                                                                                     33
                                             Source: Expert interviews
Recommended policy changes for scaling up clean cooking in urban Kenya
Section V: Conclusions and Recommendations

                                               The most cost-efficient and impactful way for GoK to scale up clean cooking
                                               is to level the playing field for emerging Bio-ethanol with LPG, increasing
                                               availability and affordability of clean cooking solutions to consumers.

                                               The specific policy recommendations based on this study are:

                                               1                        2                         3

                                                                             Remove import               Establish and
                                                   Grant denatured              duties and            enforce safety and
                                                   Bio-ethanol fuel a       additional taxes on        quality standards
                                                    VAT-zero rating          Bio-ethanol fuel         through regulatory
                                                                              and appliances                bodies

                                                                                                                           34
APPENDIX
  A: Cooking Fuel Options in the Kenyan Market
  B: Potential of Bio-ethanol for Cooking in Kenya
  C: Bio-ethanol Policy Assessment
  D: Risks and Opportunities

                                                     35
Appendix

           A: Cooking Fuel Options in the Kenyan Market

           B: Potential of Bio-ethanol for Cooking in Kenya

           C: Bio-ethanol Policy Assessment
           D: Risks and Opportunities

                                                              36
Charcoal, kerosene, and LPG are the dominant cooking fuels in urban Kenya,
      while wood fuel cooking still dominates rural Kenya
A: Cooking Fuel Options in the Kenyan Market

        Kenyan household use of primary cooking fuel
        (% of households)
                                              Total                                            Urban                                             Rural
                                 1 4        3            3        2                              4         4         5                     3 1    2 3
                                               7      12       13                       11 3                                         10                  1 3       2 2
                                 15         8                                                    22                                            11     10       9
              Other fuels                              12                                                  25       28                       1      1      2         3
                                  14         19                 14
              LPG                                      17        15                     51       27        27
              Kerosene                                                                                              29
                                                                                                                                      85        83       84     84
              Charcoal            66         63                                                            28
                                                       56        55                              41                 22
              Firewood                                                                  26
                                                                                        9                  17       16
                                                                                                  6
                                 2003      2009       2014     2017                   2003      2009     2014      2017              2003      2009   2014     2017

      • Firewood is still the dominant cooking fuel overall, though its share is declining overall with low levels of use in
        urban areas. Wood use in urban Kenya (outside Nairobi) is still relatively high and may have risen in recent years
        due to high charcoal/kerosene prices
      • Increasing LPG adoption with high level of use in urban areas. LPG share has increased 3-4x since the early 2000s.
        28% of urban HH used LPG as their primary fuel in 2017, but rural LPG penetration remains low due to costs
      • Low use of “other” fuels, including Bio-ethanol and electricity which offer health, environmental and socio-
        economic outcomes comparable to LPG; likely 0.5-1.5% share in urban Kenya for electricity and
Fuel stacking is a widespread phenomenon in Kenya; use of charcoal and
      kerosene are much more common than primary cooking fuel data indicate
A: Cooking Fuel Options in the Kenyan Market

     All Kenya – any use of fuel vs. primary cooking fuel                                           Urban Kenya – any use of fuel vs. primary cooking fuel
     (% of total HH, N=300, Dalberg 2015 survey)                                                    (% of total HH, N=~100, Dalberg 2015 survey)

                                                                                                                                                            Any cooking fuel use
                                                                                                                                                            Main cooking fuel

         69%                                                                                          78%
                             65%
                                    55%

                                                                                                                                               47%
                                                 35%                                                         41%
                26%                                                                                                       32%                                      29%
                                                                                                                                  24%                                    23%
                                                                     15%
                                                         8%                 10%                                                                       10%

          Charcoal           Firewood            Kerosene                LPG                          Charcoal            Firewood             Kerosene              LPG

                                                                                                                                                                                38
     Source: Dalberg proprietary Kenya energy access survey, N=300 (2015); small sample size lead to lower confidence level for data, but insights directionally
     correct in the case of stove/fuel stacking patterns
LPG and kerosene dominate as primary cooking fuels in Nairobi
A: Cooking Fuel Options in the Kenyan Market
                                                                                                                • Kerosene and LPG are the primary cooking
        Charcoal/kerosene are primary Nairobi cooking fuel                       (2018)1                          fuel in Nairobi overall, with low primary
        (% of total HH, N=11,415 Kenya HH self-reported primary fuel)                                             usage of charcoal; use is highly dependent
                                                                                                                  on income level with top 25-30% of income
                                                                                                                  distribution using LPG almost exclusively
                      13%                                                         LPG
                                           28%                                                                    and next 20-30% using a mix of LPG with
                      15%                                      44%                Charcoal                        charcoal and kerosene; the rest only use
                      14%                  22%                                    Kerosene                        LPG at low levels due to affordability3
                                                                5%
                                                                                  Firewood                      • The lower middle of the Nairobi income
                                           29%                                    Other
                      55%                                      47%                                                distribution (30-40% of HH) primarily use
                                           16%                                                                    kerosene and mix with charcoal for the bulk
                       3%                  5%                3% 1%                                                of their day-to-day cooking needs3
                   All Kenya          Urban Kenya            Nairobi                                            • Kerosene is the dominant fuel for the
                                                                                                                  poorest (15-20%) households in Nairobi
                                                                                                                  who use kerosene almost exclusively or in
        Charcoal + Kerosene are primary cooking fuels for Nairobi poor                                            parallel with a low level of charcoal as a
        (% of HH, n=1000 in Korogocho & Viwandani slums in Nairobi, 2016)2                                        secondary cooking fuel4
                                                                       Use stove/fuel
                                                                                                                • Majority of HH engage in fuel stacking and
                    94%                                                Commonly use stove/fuel
                             72%             76%                                                                  charcoal is the most common secondary
                                                                                                                  fuel across all income levels aside from the
                                                      26%                                                         most wealthy given ubiquity across Nairobi
                                                                      18%     12%                                 and a cultural preference for charcoal
                     Kerosene                  Charcoal                   LPG
                                                                                                                  cooking for dishes (e.g., meat grilling)

  Source: (1) Kenya National Bureau of Statistics fuel survey (2018, using 2017 data); (2) Mundi et al MPDI/Toxics, APHRC (2016); (3) Dalberg and Koko Networks field research; (4) 39
  https://www.ncbi.nlm.nih.gov/pubmed/29051417 and https://www.researchgate.net/publication/279375156_A_Choice_Experiment_Study_on_Fuel_Preference_of_Kibera_Slum_Households_in_Kenya
Charcoal is particularly harmful as it contributes more to household air
      pollution, GHG emissions, and deforestation than other fuels
A: Cooking Fuel Options in the Kenyan Market
                            Wood                                              Charcoal                                             Kerosene
       Health                   •   Deaths and DALYs due to household         •   Deaths and DALYs due to household air            •   Deaths and DALYs due to household air
                                    air pollution from PM 2.5                     pollution from PM 2.5                                pollution from PM 2.5
                                •   Quality of life diminution due to other   •   Quality of life diminution due to other hard     •   Incremental unquantified kerosene health
                                    hard to quantify health effects (eye          to quantify health effects (eye irritation,          harms (e.g., cancers from polycyclic
                                    irritation, cataracts, child                  cataracts, child malnutrition)                       aromatic hydrocarbons)
                                    malnutrition)
                                                                                                                                   •   Poisonings and burns, particularly for
                                                                                                                                       women and kids (e.g., 40-60% of pediatric
                                                                                                                                       poisoning cases in Kenya due to kerosene)
                                    ~2k avoidable deaths, 165k aDALYs                ~3k avoidable deaths, ~250k aDALYs                 ~2-3k avoidable deaths, ~160k aDALYs

       Environment &            •   GHG (CO2, Black Carbon, other global      •   Very high GHG emissions per household (CO2,      •   Relatively low GHG emissions per HH but
       Climate costs                warming Kyoto Particles)                      Black Carbon, other global warming Kyoto             still 2-3x higher than for truly clean fuels
                                •   Contributor to deforestation and,             Particles from charcoal production and use)          like LPG and Bio-ethanol
                                    consequently, food insecurity             •   Substantial driver of deforestation and,
                                                                                  consequently, food insecurity
                                                                              •   Negative impacts on food security due to
                                                                                  forest loss

                                    2.5-4.4 tCO2eq / urban HH annually                3.6-5 tCO2eq / urban HH annually                      1 tCO2eq / urban HH annually

       Social                   •   Time opportunity cost (time poverty)      •   Time opportunity cost (time poverty) due to      •   No time poverty effects vs. alternatives
       opportunity                  due to fuel collection, slower cooking        slower cooking times, need to clean up           •   Property damage from urban fires due to
                                    times, need to clean up charred               charred cooking pots/pans,                           kerosene cooking
       costs                        cooking pots and pans

                                0.8-1.3 avoidable hrs per day per urban HH        0.3-0.4 avoidable hrs per day per urban HH                   No time poverty impact

       Household                •   Foregone incomes due to avoidable         •   Foregone incomes due to avoidable time           •   Negative balance of payments effects due
       economics and                time spent cooking/cleaning                   spent cooking and cleaning                           to kerosene imports
                                •   Tax revenue loss for government given     •   Avoidable spending on relative inefficient
       macro-economic               informality of market                         and high-cost cooking fuel
       effects                                                                •   Tax revenue loss for government given
                                                                                  informality of market

      Source: Dalberg impact sizing model for rural Kenya, 2018; Household Air Pollution Intervention Tool, with customized inputs for Nairobi based respective                       40
      switching to LPG and ethanol consumption.
You can also read