Indicators & Considerations for Key Sectors - Report for the Pacific Islands Regional Climate Assessment (PIRCA) - East-West Center
←
→
Page content transcription
If your browser does not render page correctly, please read the page content below
P I R C A
                                      2 0 2 0

Indicators
& Considerations
for Key Sectors

Report for the Pacific Islands
Regional Climate Assessment (PIRCA)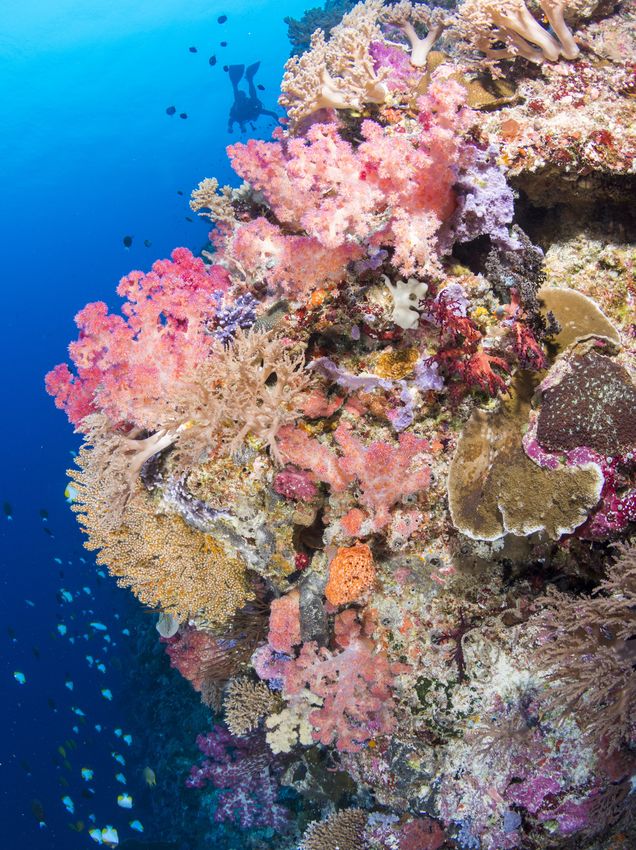
The East-West Center promotes better relations and
                         understanding among the people and nations of the United
                         States, the Pacific, and Asia through cooperative study,
                         research, and dialogue. Established by the US Congress in
                         1960, the Center serves as a resource for information and
                         analysis on critical issues of common concern, bringing
                         people together to exchange views, build expertise, and
                         develop policy options.

The Center’s 21-acre Honolulu campus, adjacent to the University of Hawai‘i at
Mānoa, is located midway between Asia and the US mainland and features research,
residential, and international conference facilities. The Center’s Washington, DC,
office focuses on preparing the United States for an era of growing Asia Pacific
prominence.

The East-West Center hosts the core office of the Pacific RISA grant, providing
administrative and research capabilities for the program. The Pacific RISA is one
of the 11 National Oceanic and Atmospheric Administration (NOAA) Regional
Integrated Sciences and Assessments (RISA) teams that conduct research that builds
the nation’s capacity to prepare for and adapt to climate variability and change.
This work is supported by funding from NOAA. The Pacific RISA provided primary
oversight of this and the 2012 PIRCA report.

EastWestCenter.org
PacificRISA.org

ISBN: 978-1-932728-95-8 (print)
ISBN: 978-1-932728-81-1 (electronic)
DOI: 10.5281/zenodo.4124259

@2020 East-West Center

Recommended Citation:
Miles, W., Z. Grecni, E. Matsutaro, P. Colin, V. Keener, Y. Golbuu, et al., 2020: Climate
Change in Palau: Indicators and Considerations for Key Sectors. Report for the
Pacific Islands Regional Climate Assessment. Honolulu, HI: East-West Center,
https://www.eastwestcenter.org/PIRCA-Palau.
About PIRCA
and this Report
Climate Change in Palau: Indicators                     Advisory Committee reviewed this report. Workshop
and Considerations for Key Sectors is                   participants and reviewers independent of the PIRCA
                                                        workshops who made contributions are recognized
a report developed by the Pacific Islands
                                                        as Technical Contributors.
Regional Climate Assessment (PIRCA).
It is one in a series of reports aimed at               The Pacific Regional Integrated Sciences and
assessing the state of knowledge about                  Assessments (Pacific RISA) program has primary
climate change indicators, impacts, and                 oversight of the 2020 PIRCA. The Pacific RISA is
adaptive capacity of the US-Affiliated                  funded by the US National Oceanic and Atmospheric
Pacific Islands (USAPI) and the Hawaiian                Administration (NOAA) and supported through the
                                                        East-West Center. Key partners and supporters
archipelago. PIRCA is a collaborative
                                                        are NOAA’s National Centers for Environmental
effort engaging federal, state, and local               Information (NCEI), the Department of the Interior’s
government agencies, non-governmen-                     Pacific Islands Climate Adaptation Science Center
tal organizations, academia, businesses,                (PI-CASC), and the US Global Change Research
and community groups to inform and                      Program (USGCRP).
prioritize their activities in the face of a
changing climate.                                       This series represents the latest assessment in a
                                                        sustained process of information exchange among
The initial phase of PIRCA activities was conducted     scientists, businesses, governments, and communities
during June-October 2019 and included meetings          in the Pacific Islands region that began with the 2012
and workshops in American Sāmoa, the Republic of        PIRCA (which produced Climate Change and Pacific
Palau, the Commonwealth of the Northern Mariana         Islands: Indicators and Impacts, Island Press). We
Islands (CNMI), and Guam. Draft PIRCA reports were      anticipate that in conjunction with other collaborative
developed and refined through engagement with the       regional assessment efforts, the PIRCA reports will
PIRCA network. The material presented in this report    provide guidance for decision-makers seeking to
is based largely on published research and insights     better understand how climate variability and change
from participants in PIRCA activities. The PIRCA        impact the Pacific Islands region and its peoples.

The PIRCA Advisory Committee

Keith Bettinger, East-West Center; Kristie Ebi, University of Washington Environmental and Occupational
Health Sciences; Yimnang Golbuu, Palau International Coral Reef Center; Jamie Gove, NOAA Fisheries;
Mari-Vaughn V. Johnson, Pacific Islands Climate Adaptation Science Center; Heather Kerkering, Pacific
Islands Climate Adaptation Science Center; William Kostka, Micronesia Conservation Trust; Darren T.
Lerner, University of Hawai‘i Sea Grant College Program; Karena Lyons, East-West Center; John J. Marra,
NOAA National Centers for Environmental Information; Dan Polhemus, US Fish and Wildlife Service

                                                                                                                  3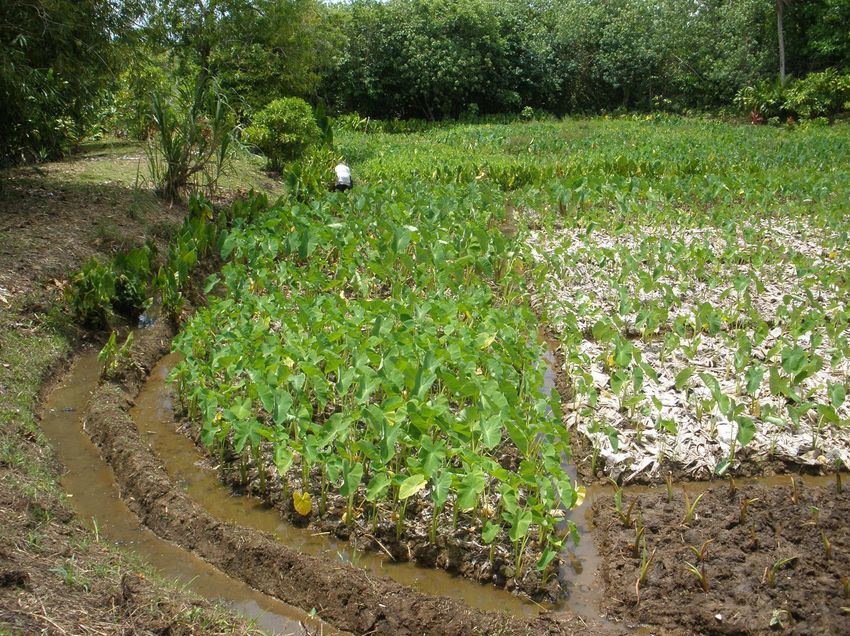
Aerial view of the Rock Islands
Southern Lagoon World Heritage Site.
          Photo: Stuart Westmorland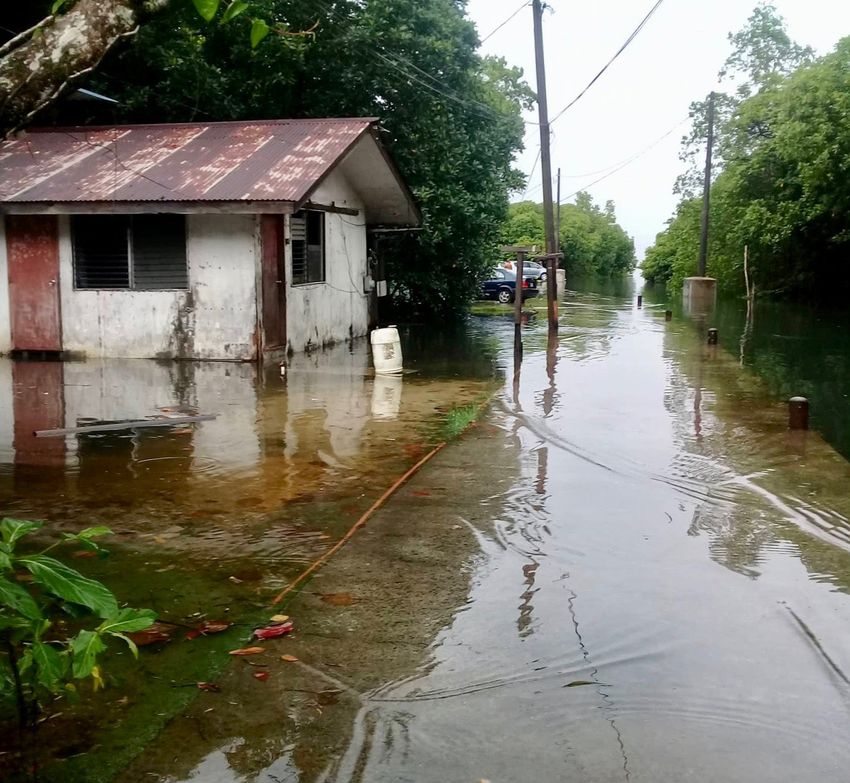
Key Issues for Managers
and Policymakers
       Increasing air temperatures – Hot                    Threats to ecosystems and biodiversity
       days have increased in Palau, while the              – Increased air and ocean temperatures,
frequency of cool nights has declined.                  changes in ocean chemistry, more intense storms,
                                                        and changing rainfall patterns are expected to
        Coral reef bleaching and loss – Oceans          impact Palau’s ecosystems.
        are warming, causing coral bleaching
events to become more common and severe.                     Community safety during and after
Widespread coral bleaching is projected to occur             storms – More powerful tropical cyclones
annually in Palau by 2040.                              are projected. Health risks increase with storms
                                                        when infrastructure and housing are damaged,
        Stronger storms and typhoons –                  and electricity, sanitation, food/water supplies,
        Tropical cyclone intensity is projected         communication, and transportation are
to increase, with a greater frequency of intense        disrupted.
(higher category) tropical cyclones. However, the
total number of cyclones is expected to decrease            Human health and warming temperatures
or remain the same.                                         – More frequent extreme heat events are
                                                        expected to increase heat-related illness and
        Sea level rise – Palau experiences large        death. People who work outdoors, children, older
        fluctuations in sea level from year to year     adults, and individuals with chronic illnesses are
due to the El Niño–Southern Oscillation and             at greater risk to heat-related illnesses.
Pacific Decadal Oscillation. Despite this natural
variability, sea level is rising in Palau and will           Threats to infrastructure – The majority
exacerbate high tide flooding, storm surge, and              of Palau’s population and infrastructure
coastal erosion.                                        are in low-lying coastal areas. Most rural
                                                        schools in Palau are built in locations identified
        Changing rainfall patterns – Average            as vulnerable to climate change. The potential
        rainfall is projected to increase, especially   vulnerability of critical infrastructure like the
in the wet season, while the frequency and              national hospital and main port need to be
duration of drought is expected to decrease in          assessed.
Palau.
                                                             Food security – Warming air and ocean
       More extreme rainfall and flooding –                  temperatures, changes in ocean chemistry
       Extreme rainfall events are projected to         and rainfall patterns, and the increased intensity
become more frequent and intense for Palau,             of storms are all expected to impact human food
increasing runoff and the risk of flooding.             systems both in Palau and globally.
       Risks to freshwater – Hotter temperatures            Equity considerations – Social, economic,
       increase the demand for water and                    and geographic factors shape people’s
decrease freshwater availability. Saltwater             exposure to climate-related impacts and how
intrusion during storms and tidal flooding and          they are able to respond. Those who are already
over-extraction from wells endanger local               vulnerable—including children, the elderly,
aquifers.                                               low-income communities, and individuals with
                                                        disabilities—are at greater risk in extreme
                                                        weather and climate events, in part because they
                                                        are often excluded from planning processes.

                                                                                                             5
Palau is home to some of the best managed
         and most pristine reefs in the world.
                        Photo: Getty Images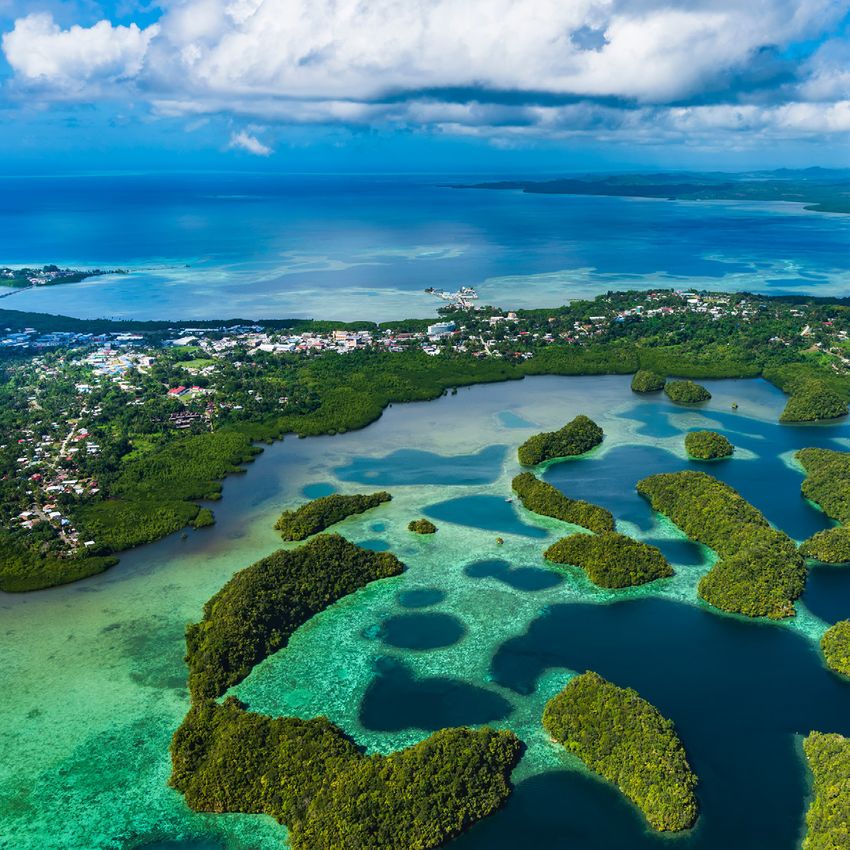
Climate Change in Palau:
Indicators and Considerations
for Key Sectors
Report for the Pacific Islands Regional
Climate Assessment (PIRCA)
Coordinating Authors: Wendy Miles, East-West Center; Zena Grecni, East-West Center; Erbai
Xavier Matsutaro, Office of Climate Change; Patrick Colin, Coral Reef Research Foundation;
Victoria Keener, East-West Center; Yimnang Golbuu, Palau International Coral Reef Center

Technical Contributors: Joseph Aitaro, Office of Climate Change; Eunice Akiwo, Bureau of
Domestic Affairs, Ministry of State; Hefflin Bai, Palau National Communications Corporation;
Umai Basilius, Palau Conservation Society; Meked Besebes, Bureau of Aging, Disability and
Gender, Ministry of Community and Cultural Affairs; Dennis Blaluk, Palau Public Lands Authority;
Laura Brewington, East-West Center; Tutii Chilton, Palau Energy Administration; Calvin
Emesiochel, Bureau of Cultural and Historical Preservation, Ministry of Community and Cultural
Affairs; Omar Faustino, Palau Protected Areas Network; Abby Frazier, East-West Center;
Skilang Harold, Airai State Government; Adelle Lukes Isechel, Ministry of Natural Resource,
Environment, and Tourism; Charlene Mersai, Palau National Environmental Protection Counsel;
Kevin Mesebeluu, Palau Ministry of Natural Resources, Environment, and Tourism; Metiek K.
Ngirchechol, Palau Environmental Quality Protection Board; Tessy Nobuo, Omekesang; Celine
Oiterong, Palau Public Lands Authority; Sharon Patris, Coral Reef Research Foundation; Victor
Tyson Philip, Airai State Government; Richard Ruluked, Palau National Communications
Corporation; Klouldil Singeo, Palau Bureau of Aging, Disability and Gender, Ministry of
Community and Cultural Affairs; Kiblas Soaladaob, United Nations Development Program Small
Grants Programme; William V. Sweet, NOAA National Ocean Service; Gerald Tulop, Palau
Energy Administration; Darlynne Takawo, Palau Automated Land and Resource Information
System (PALARIS); John Takesy, Omekesang; Eden Uchel, Division of Environmental Science,
Bureau of Public Health, Ministry of Health; Matthew Widlansky, University of Hawai‘i Sea Level
Center; Wayne Wong, Palau Red Cross Society

                                                                                                   7
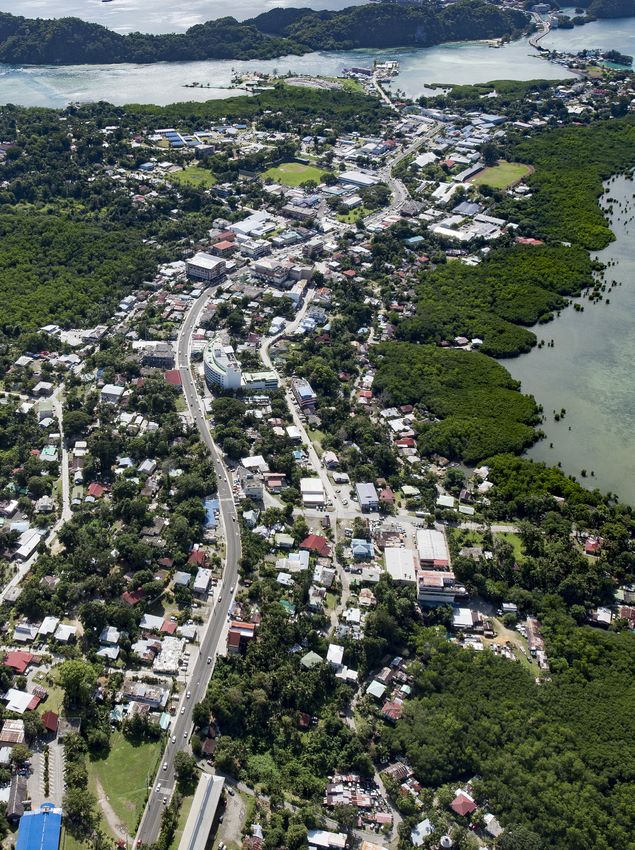
A bird's-eye view of the city of Koror.
         Photo: Norimoto (Getty Images)
8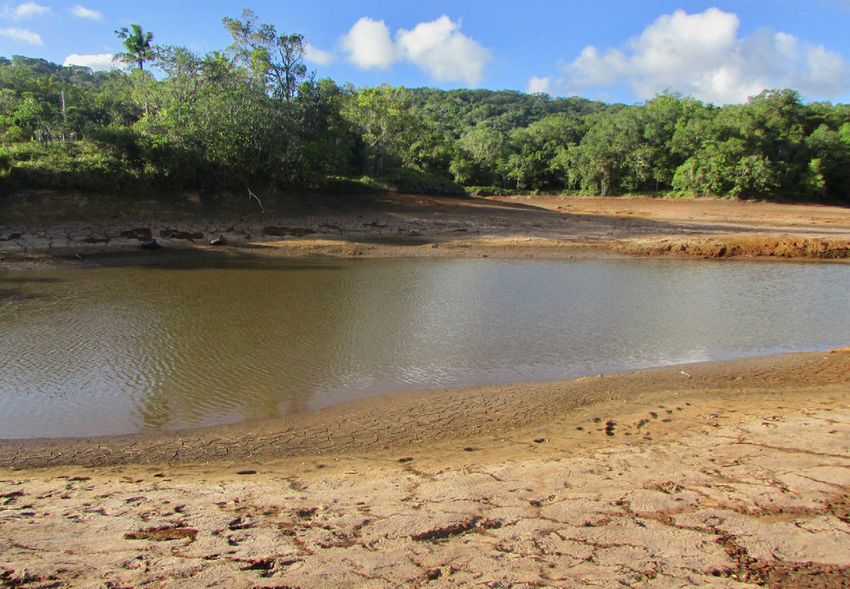
Inside this Summary

Key Issues for Managers and Policymakers                                               5
Global Climate Change: Causes and Indicators	                                         11
The causes of climate change	                                                         11
How is the climate changing?	                                                         11
Future changes	                                                                       13
Indicators of Climate Change in Palau	                                                14
Air Temperature	                                                                      14
Rainfall	                                                                             17
Typhoons and Storms	                                                                  19
Sea Level	                                                                            20
Ocean Changes	                                                                        23
Managing Climate Risks in the Face of Uncertainty	                                    26
What Do Extreme Weather and Climate Change Mean for Palau’s Families,
Households, and Vulnerable Populations?	                                              26
What Do Extreme Weather and Climate Change Mean for Palau’s Key Sectors?	             28
If you are involved in farming and agroforestry…	                                     28
If you are involved in fisheries or managing ocean resources…	                        29
If you work in public health or disaster management…	                                 30
If you manage ecosystems and biodiversity…	                                           33
If you are a cultural or historical resources steward…	                               34
If you are involved in recreation or tourism…	                                        35
If you are a coastal decision-maker…	                                                 36
If you are a water or utilities manager…	                                             37
If you are involved in finance or economic development...	                            40
If you are an educator or education decision-maker...	                                41
Needs for Research and Information	                                                   43
Sources of Climate Data and Projections	                                              46
Traceable Accounts	                                                                   46
References	                                                                           52
Appendix: Priority Risks by Sector and Impact from the Palau Climate Change Policy	   65

                                                                                            9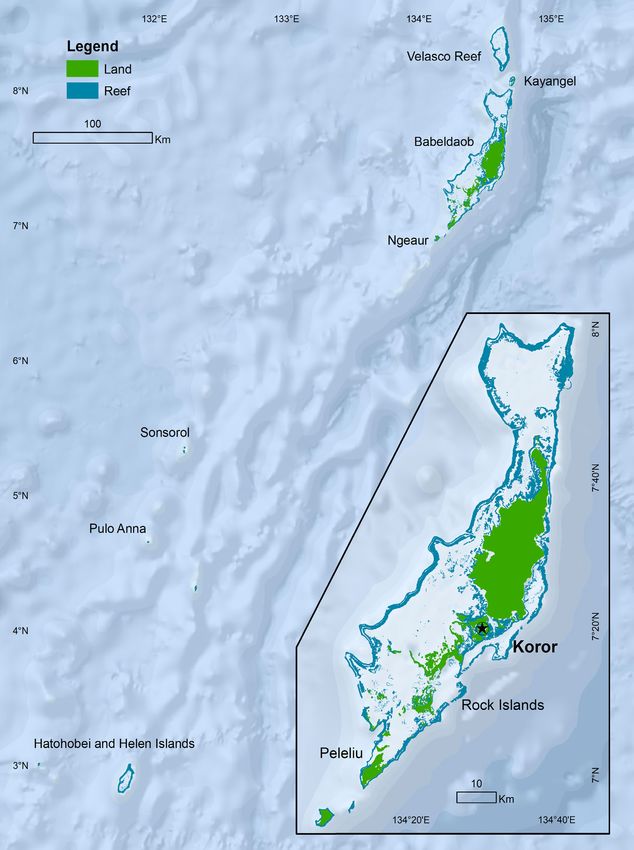
10
Original map by Laura Brewington
Global Climate Change: Causes and Indicators
Global Climate Change:
Causes and Indicators
The causes of climate change
Scientists have investigated the physical science USGCRP 2017, Ch. 2, Physical Drivers of Climate
of climate change for almost two centuries. Change; IPCC 2014, SPM.1.2).
Carbon dioxide and other greenhouse gases in
the atmosphere capture some of the heat from Although natural climate cycles and other
the Sun’s energy that radiates from Earth’s factors affect temperatures and weather patterns
surface, preventing it from escaping back into at regional scales, especially in the short term,
space (USGCRP 2018, Ch. 1, Overview). Known the long-term warming trend in global average
as the “greenhouse effect,” this process keeps temperature documented over the last century
Earth habitable for life. However, human cannot be explained by natural factors alone
activities have emitted an increasing amount of (USGCRP 2018, Ch. 2, Key Message 1). Human
greenhouse gases into the atmosphere since the activities, especially emissions of greenhouse
late 1800s through burning fossil fuels (such as gases, are the only factors that can account for
oil, gas, and coal) and, to a lesser extent, through the amount of warming observed over the past
changes in land-use and global deforestation. century (USGCRP 2018, Ch. 2, Key Message 1;
As a result, the greenhouse effect has intensi- IPCC 2014, SPM.1.2). The largest contributor
fied and driven an increase in global surface to human-caused warming has been carbon
temperatures and other widespread changes dioxide emissions. Natural factors alone would
in climate. These changes are now happening have actually had a slight cooling effect on
faster than at any point in the history of modern climate over the past 50 years (USGCRP 2018,
civilization (USGCRP 2018, Ch. 1, Overview; Ch. 2, Key Message 1).
How is climate changing?
Long-term scientific observations show the • Seas are rising, warming, and becoming
effects of increasing greenhouse gas concentra- more acidic.
tions in the atmosphere on the climate system. • Some ocean species are moving toward
The factors observed to be changing are known cooler waters.
as indicators of change. Data collected from
around the world show, for example: • Ice sheets and sea ice are decreasing, and
glaciers and snow cover are shrinking.
• Globally, the Earth has experienced a These and many other changes are well-
warming trend over the last century. documented and are clear signs of a warming
• Oceania’s five warmest years in the past world (USGCRP 2018, Ch1, Overview, Fig.
century have occurred since 2005, with the 1.2, and Ch. 2, Key Messages 3-7; IPCC 2014,
warmest year on record being 2019 (NOAA SPM.1.1; also see USGCRP Indicators and EPA
2020a). Indicators websites.)
11 Global Climate Change: Causes and Indicators
Figure 1. Observed changes in key climate indicators in the Pacific Islands, such as carbon
dioxide concentration, sea surface temperatures, and species distributions result in impacts to
multiple sectors and communities, including built infrastructure, natural ecosystems, and human
health. In the top panel, red arrows signify an indicator is increasing, while blue arrows show the
indicator is decreasing. A red and blue arrow appear together for an indicator that is changing and
the direction of change varies. Source: Keener et al. 2018.
12Global Climate Change: Causes and Indicators
As in all regions of the world, the climate of key indicators. The impacts of climate change
the Pacific Islands is changing. The top panel (lower panel) are already being felt in the
of Figure 1 summarizes the changes that have Pacific Islands, and are projected to intensify in
been observed by scientists through several the future (Keener et al. 2018).
Future changes
Greenhouse gas emissions from human activ- approximately 1.0°C of warming above
ities will continue to affect the climate over pre-industrial levels (IPCC 2018, A.1). Limiting
this century and beyond; however efforts to cut global warming to 1.5°C, while physically
emissions of certain gases could help reduce possible, would require rapid and far-reaching
the rate of global temperature increases over transitions in energy, land, cities, transportation,
the next few decades (USGCRP 2018, Ch. 1, and industrial systems (IPCC 2018, C.2).
Overview and Ch. 2, Key Message 2).
This report summarizes the long-term
The largest uncertainty in projecting future changes and future projections for key climate
climate conditions is predicting the actions that indicators in the Republic of Palau. Later
human society will take to reduce greenhouse sections describe: climate change issues facing
gas emissions in the coming years (USGCRP families and households in Palau; extreme
2018, Ch. 2, Key Message 2; IPCC 2014, weather and climate-related risks and
SMP.2.1). Climate models representing our considerations for managers and decision-
understanding of historical and current climate makers; and identified needs for information
conditions are often used to project how our and research. The findings draw from published
world will change under future conditions. To literature on climate science, climate risks
understand how different levels of greenhouse in the Pacific Islands, and risk management
gas emissions could lead to different climate approaches. A workshop held in Palau in July
outcomes, scientists use plausible future 2019, collaboratively by the Palau Office of
scenarios—known as Representative Concentra- Climate Change and Pacific RISA, gathered
tion Pathways (RCPs)—to project temperature knowledge that informed the report content
change and associated impacts (USGCRP 2018, and identified needs for information and
Guide to the Report). The “high scenario” research.
(RCP8.5) represents a future where reliance
on fossil fuels and annual greenhouse gas
emissions continue to increase throughout this
century. The “low scenario” (RCP4.5) is based
on reducing greenhouse gas emissions (to about
85% lower emissions than the high scenario by
the end of the 21st century).
Current greenhouse gas emissions far outpace
lower emissions pathways and are currently
tracking higher than the high scenario
(RCP8.5). Human activities have caused
13 Indicators of Climate Change in Palau
Indicators of Climate Change in Palau
The indicators of climate change in Palau build Change (IPCC). These indicators were derived
upon the State of Environmental Conditions in through formal and informal discussions with
Hawai‘i and the U.S. Affiliated Pacific Islands a variety of stakeholders in the public and
under a Changing Climate: 2017 (Marra and private sectors and members of the scientific
Kruk 2017), Climate Variability, Extremes and community. Criteria for indicator selection
Change in the Western Tropical Pacific: 2014 included regional and local relevance and an
(Australian BOM and CSIRO 2014), and work established relationship to climate change and
of the Intergovernmental Panel on Climate variability.
Air Temperature
Indicator How has it changed? Projected future change
Hot days
Cool nights
Average air temperature
Air temperature factors into many realms of on average since 1951 makes up much of the
decision-making, from public health to utilities increase in average air temperature (Australian
and building construction, and air temperature BOM and CSIRO 2014). Only the minimum
is also a key indicator of climate change. daily temperature warming trend in the dry
season (November–April) is statistically sig-
The number of hot days (above 90°F/32°C) in nificant at the 5% level (Australian BOM and
Koror has increased from an average of about CSIRO 2014).
46 days per year in the first decade records
were kept (1952–1961) to 100 days per year in
the last decade (2009–2018) (NOAA 2020c)
(Fig. 2).
The number of cool nights (below 74°F/23.5°C)
has decreased. Koror experienced an average of
about 40 cool nights per year in the first decade
on record (1952–1961), versus only 13 nights
per year in the last decade (2009–2018) (NOAA
2020c) (Fig. 3).
In Palau, average air temperature has
increased (Australian BOM 2020; NOAA 2020c)
(Fig. 4). At Koror, an increase in maximum
daily temperatures of 0.36°F (0.2°C) per decade
14Indicators of Climate Change in Palau
Fig.2
Koror: Number of Hot Days (90oF and over)
Figure 2. Annual count of days with maximum temperature of 90°F (approximately 32°C) or
hotter (temperatures at or above the 90th percentile). Over the period of 1952 to 2018, the
number of hot days increased at a rate of 1.81 days per year on average (black dotted line).
Original figure by Abby Frazier, using data from the NOAA GHCN-Daily database for 1952–2018
(NOAA 2020c; Menne et al. 2012).
Fig.3
Koror: Number of Cool Nights (less than 74oF)
Figure 3. Annual count of nights with minimum temperature less than the 10th percentile
(roughly 74°F or 23.5°C) for the entire record at Koror. Over the period of 1952 to 2018, the
number of cool nights decreased at a rate of 0.42 nights per year on average (black dotted line).
Original figure by Abby Frazier, using data from the NOAA GHCN-Daily database for 1952–2018
(NOAA 2020c; Menne et al. 2012).
15 Indicators of Climate Change in Palau
Fig.4
Koror: Average Annual Temperature (oF)
Figure 4. Average annual temperature in Koror, Palau (°F). During the period of 1952 to 2018,
average annual temperatures increased at a rate of 0.02°F per year (black dotted line). Original
figure by Abby Frazier, using data from the NOAA GHCN-Daily database for 1952–2018 (NOAA
2020c; Menne et al. 2012).
Surface air temperature is expected to continue to increase this century (Table 1). Compared to the
period of 1986 to 2005, under the high scenario (RCP8.5) annual average air temperature in Palau is
projected to rise 1.1–1.8°F (0.6–1.0°C) by 2030, 1.8–3.4°F (1.0–1.9°C) by 2050, and as much as 3.8–7.2°F
(2.1–4.0°C) by 2090 (Australian BOM and CSIRO 2014). Increases in average air temperatures will
result in a rise in the number of hot days and warm nights and a decrease in cooler weather.
2030 2050 2070 2090
°F °C °F °C °F °C °F °C
Low Scenario (RCP4.5) 0.9–1.8 0.5–1.0 1.3–2.5 0.7–1.4 1.6–3.2 0.9–1.8 1.8–3.8 1.0–2.1
High Scenario (RCP8.5) 1.1–1.8 0.6–1.0 1.8–3.4 1.0–1.9 2.9–5.6 1.6–3.1 3.8–7.2 2.1–4.0
Table 1. Projected increases in annual average air temperature in Palau, compared to the period
of 1986 to 2005. Source: Adapted from the Pacific-Australia Climate Change Science and
Adaptation Planning Program’s “Current and future climate of Palau” (Australian BOM and
CSIRO 2014).
16 C L I M AT E C H A N G E I N PA L AU Indicators and Considerations for Key SectorsIndicators of Climate Change in Palau
Rainfall
Indicator How has it changed? Projected future change
Average rainfall No change
Extreme rainfall frequency No change
On islands, rainfall is the primary source of year. The driest periods on record have been
all fresh water, making it essential to human correlated with strong El Niño events, occurring
communities and ecosystems. Rainfall patterns in 1982–1983, 1997–1998, and 2015–2016. During
across Palau are strongly linked to El Niño– each of these periods, Palau experienced
Southern Oscillation (ENSO) events, the location droughts and acute water shortages which
of the Intertropical Convergence Zone, and resulted in water rationing (Polhemus 2017;
seasonal monsoons (NOAA 2015). As a result, Rupic et al. 2018).
Palau’s rainfall is highly variable from year to
Fig.5
Koror: Number of Days with No Rainfall
Figure 5. Annual count of days with no rainfall (0 inches) for the entire record at Koror
(1952–2018). The black dotted line indicates the linear trendline, showing no measurable
long-term change in number of days with no rainfall. Original figure by Abby Frazier, using the
NOAA GHCN-Daily database for 1952–2018 (NOAA 2020c; Menne et al. 2012).
At Koror, average daily and annual rainfall Palau (Australian BOM and CSIRO 2014).
trends show no long-term change since record
keeping began. The number of days with no Palau will most likely experience more frequent
rainfall has varied year to year, but has not sig- and intense extreme rainfall events in the
nificantly changed since 1952 (Fig. 5). Average future with global warming. Extreme daily
rainfall is expected to increase, especially in the rainfall has changed little on average since the
wet season. This is consistent with the projected 1950s (Fig. 6). However, in the future, a 1-in-20
increase in intensity of the West Pacific Monsoon year event is anticipated to become, on average,
and the Intertropical Convergence Zone over a 1-in-8 year event under the low scenario and a
17 Indicators of Climate Change in Palau
Fig.6
Koror: Number of Extreme Rainfall Days (over 2 inches rainfall)
Figure 6. Annual count of days with rainfall greater than 2 inches (51 mm) at Koror (corresponding
approximately to the 95th percentile of daily rainfall). For comparison, about 2.7 inches (69 mm)
of rain fell in 24 hours at Koror during Typhoon Bopha on December 3, 2012. The black dotted line
indicates the linear trendline, showing little change amidst considerable annual variation. Original
figure by Abby Frazier, using the NOAA GHCN-Daily database for 1952–2018 (NOAA 2020c;
Menne et al. 2012).
Indicator How has it changed? Projected future change
Frequency of drought No change
Duration of drought No change
1-in-4 year event under the high scenario by 2090
(Australian BOM and CSIRO 2014). Increased
heavy rainfall events would result in increased
runoff and increased potential for flooding.
Palau is expected to spend less time overall in
drought under all future warming scenarios.
The frequency of drought is projected to
decrease, and the duration of moderate, severe,
and extreme droughts is projected to decrease
in the future under the high scenario. The
duration of mild drought events is projected
to remain stable in the future under the high
scenario (Australian BOM and CSIRO 2014).
18 C L I M AT E C H A N G E I N PA L AU Indicators and Considerations for Key SectorsIndicators of Climate Change in Palau
Typhoons and Storms
Indicator How has it changed? Projected future change
Tropical cyclone frequency No change ?
Tropical cyclone intensity No change
Typhoons and tropical storms can bring intense would amplify the potential for severe damage
winds, torrential rainfall, high waves, and/or (Widlansky et al. 2019).
storm surge, and can have a range of impacts on
lives and property when they strike. Globally, tropical cyclone frequency shows
a slow downward trend since the early 1970s.
Tropical cyclones (also known as tropical Fewer tropical cyclones are projected to occur
storms or typhoons depending on their by the end of this century, both globally and
strength) are not uncommon to Palau histori- around Palau. The overall decrease in tropical
cally (CRRF 2014). Past typhoons have resulted cyclones is expected because climate models
in wave-driven inundation, destruction of coral suggest that the atmosphere will become more
reefs, and extensive infrastructure damage due stable with continued greenhouse warming
to wind (Merrifield et al. 2019). The number of (Kossin et al. 2016; Zhang et al. 2016; Wang
named storms, typhoons, and major typhoons et al. 2016; USGCRP 2017; Widlansky et al.
has remained constant on average, with a 2019). The Australian Bureau of Meteorology
roughly equal number of above- and below- and CSIRO project a decrease in tropical
normal seasons of cyclone activity in the cyclone formation in the northern Pacific basin,
western Pacific since 1980 (Marra and Kruk however the confidence in the projection is low
2017; Knapp et al. 2010). since results vary across global climate models
(Australian BOM and CSIRO 2014).
The annual frequency of gale-force winds
remained relatively constant from 1981 to 2015
in the western North Pacific (Marra and Kruk
2017; Kanamitsu et al. 2002). Gale-force winds
(greater or equal to 34 knots) are an indicator of
storminess, and are responsible for moderate to
high waves which impede boating (Marra and
Kruk 2017).
There is scientific consensus that tropical
cyclone intensity is likely to increase in a
warmer climate for most regions, including
around Palau (USGCRP 2017; Marra and Kruk
2017; Knutson et al. 2015; Sobel et al. 2016;
Zhang et al. 2016; Widlansky et al. 2019).
The change in tropical cyclone intensity is
projected to affect stronger storms the most
(that is, increased maximum intensities), which
19 Indicators of Climate Change in Palau
18 Sep 2013 8 Nov 2013
Kayangel Island's village center and dock—as well as the island's primary area of taro production—
before (left) and after (right) Super Typhoon Haiyan. Photos: Patrick L. Colin, Coral Reef Research
Foundation.
Sea Level
Indicator How has it changed? Projected future change
Sea level
Tidal flood frequency
Sea level rise poses many challenges to island and Thompson 2015; UHSLC 2020). Sea level
communities and infrastructure because it in Palau varies; sometimes by as much as 1.6–2.0
brings more frequent and extreme coastal feet (0.5–0.6 m) due to El Niño and La Niña
erosion, coastal flooding, and saltwater events (CRRF 2020; UHSLC 2020). Despite
intrusion into coastal aquifers. dramatic short-term variability, mean sea level
in Palau increased on average 0.095 inches (2.42
Palau experiences large fluctuations in sea level mm) per year from 1969 to 2016 (NOAA 2020b).
over variable time periods (ranging from a few
weeks to years) under the influence of the El Increases in mean sea level will affect tidal
Niño–Southern Oscillation (ENSO), as well as flood frequency and magnitude. Palau’s natural
longer-term fluctuations via the Pacific Decadal shifts in mean sea level will be accentuated by
Oscillation (Qiu et al. 2019; Chowdhury et al. global sea level rise, causing high tide flooding
2010). While overall sea level in Palau has risen (also known as nuisance coastal flooding) to
since 1969, these changes have been non-linear become more common in the long term (Marra
and Palau actually experienced decreasing sea and Kruk 2017).
levels during the 2010s (Caldwell, Merrifield,
20 C L I M AT E C H A N G E I N PA L AU Indicators and Considerations for Key SectorsIndicators of Climate Change in Palau
Annual Number of High Water Hours
at Malakal Island, Palau
Figure 7. Number of high water hours per year at Malakal Island in Palau from 1970 to 2019. The high
water threshold (2632 mm) is defined as the Mean Higher High Water level plus one-third of the
difference between that and the Mean Lower Low Water level at the tide gauge (that is, water levels
above the daily average highest tide plus a factor of the typical tidal amplitude). Original figure by
Matthew Widlansky, using data from the University of Hawai‘i Sea Level Center Station Explorer
(https://uhslc.soest.hawaii.edu/stations/?stn=007#datums).
Sea level rise will continue in Palau. Compared Although the world’s oceans are connected, sea
to the year 2000, Global Mean Sea Level is level is not uniform across the globe. There are
projected to rise 0.3–0.6 feet (0.09–0.18 m) by variations in sea level due to winds and ocean
2030, 0.5–1.2 feet (0.15–0.38 m) by 2050, and currents, temperature changes, and changing ice
1.0–4.3 feet (0.3–1.3 m) by 2100 (USGCRP 2017; and water distribution. Palau and other tropical
Sweet et al. 2017a). Emerging climate research Pacific Islands experience amplified relative sea
indicates that by 2100, it is physically possible level rise due to several of these factors (Sweet et
for Global Mean Sea Level to rise 8 feet (2.4 m) al. 2017b). As a result, under the 2100 Intermedi-
(USGCRP 2017), although the probability of this ate-High Global Mean Sea Level Rise Scenario of
extreme outcome cannot currently be assessed 4.9 feet (1.5 m), Palau could experience another
and is considered low (Sweet et al. 2017a). 1–1.7 feet (0.3–0.5 m) of rise for a total of 5.9–6.6
There is very high confidence in the lower feet (1.8–2 m) by the end of the century (Sweet et
bounds of these projections, and it is extremely al. 2017b). This effect is accounted for in Figure
likely that global sea levels will continue to rise 8, which shows six different Global Mean Sea
after 2100 (USGCRP 2017; Sweet et al. 2017a). Level Rise scenarios applied to Koror. The prob-
ability of exceeding each of these six scenarios by
2100 is provided in Table 2.
21 Indicators of Climate Change in Palau
Fig.8
Global Mean Sea Level (GMSL) Scenarios applied to Koror
Relative Sea Level Rise (Meters)
Low (0.3 m) Scenario Intermediate-Low (0.5 m) Scenario Intermediate (1.0 m) Scenario
Intermediate-High (1.5 m) Scenario High (2.0 m) Scenario Extreme (2.5 m) Scenario
Figure 8. Six representative Global Mean Sea Level scenarios (6 colored lines) applied to Koror,
Palau. The probability of exceeding each of these GMSL rise scenarios by 2100 is shown in Table
2. Sea level rise scenarios for Palau post-2100 can be found at: https://geoport.usgs.esipfed.
org/terriaslc/. Source: USGS TerriaMap of Sea Level Change 2020 for Malakal B Tide Gauge in
Koror (7.33°N, 134.470°E) and Sweet et al. 2017b.
GMSL Rise Scenario RCP4.5 RCP8.5
Low (0.3 m) 98% 100%
Intermediate-Low (0.5 m) 73% 96%
Intermediate (1.0 m) 3% 17%
Intermediate-High (1.5 m) 0.50% 1.30%
High (2.0 m) 0.10% 0.30%
Extreme (2.5 m) 0.05% 0.10%
Table 2. Probability of exceeding Global Mean Sea Level rise scenarios in 2100. New evidence from
research on the Antarctic Ice Sheet supports higher probabilities of exceeding the Intermediate-High,
High, and Extreme scenarios than provided here (Sweet et al. 2017b). Source: Adapted from Sweet et
al. 2017b, based on Kopp et al. 2014.
22 C L I M AT E C H A N G E I N PA L AU Indicators and Considerations for Key SectorsIndicators of Climate Change in Palau
As global mean sea level continues to rise, In order for Palau’s coral reefs to ‘keep up’ with
variations in local mean sea level values related sea level rise, they will need to grow vertically
to ENSO will continue to influence the number at rates associated with sea level rise (which
of coastal floods in Palau each year. While a might not be feasible under higher sea level rise
general increase in coastal floods is expected scenarios) (van Woesik, Golbuu, and Roff 2015;
with sea level rise, the frequency and extent of van Woesik and Cacciapaglia 2018; Hongo,
extreme flooding associated with individual Kurihara, and Golbuu 2018), while also com-
tropical cyclones and storms will be closely pensating for periods of lower mean sea level
associated with the ENSO sea level state and associated with El Niño conditions which limit
timing of high/low tides. upward growth (Colin and Schramek 2020).
Ocean Changes
Indicator How has it changed? Projected future change
Ocean water temperature
Accumulated heat stress
Ocean acidification
Human-caused greenhouse gas emissions are Palau has one of the most comprehensive
resulting in changes in the chemical compo- temperature monitoring networks on any single
sition, temperature, and circulation of oceans, coral reef area in the world (Colin 2018). Ocean
which have ramifications for marine ecosystems. temperatures at different depths have been
documented for the past 20 years. Although local
Changes in sea surface and sub-surface water ocean water temperatures are variable through
temperature can dramatically alter marine time (Schönau et al. 2019), data shows that Palau
ecosystems and affect circulation patterns in the has experienced an average rise in ocean tem-
ocean. Sea surface temperature has increased perature of 0.36°F (0.2°C) per decade since 1999
globally since 1880 (NOAA 2020d). (Colin 2018; Schramek et al. 2018) (Fig. 9).
23Low (0.3m) Scenario Intermediate-Low (0.5m) Scenario Intermediate (1.0m) Scenario
Intermediate-High (1.5m) Scenario High (2.0m) Scenario Extreme (2.5m) Scenario
Indicators of Climate Change in Palau
Fig.9
Ulong Rock, western barrier reef of Palau
31
Weekly mean water temperature oC
30
29
28
27
11 m 2m
Figure 9. Water temperatures at Ulong Rock on the western barrier reef of Palau have shown a
rise of about 0.36°F (0.2°C) per decade since 1999 (green line). The shallower areas of the barrier
reef (average depth 2 m, but with high variation due to the 1–2 m tidal amplitude) are subject to
higher variation in temperature than deeper areas (11 m) without tidal influence on temperature.
A 30°C threshold for coral bleaching is indicated (red line) and temperature often exceeds that
threshold for short periods during summer. Graph courtesy of the Coral Reef Research Foundation.
In Palau, 86°F (30°C) is considered the There is very high confidence that average sea
threshold for initiation of coral bleaching (red surface water temperature will continue to
line in Fig. 9), and coral bleaching occurs if increase in the western North Pacific, but only
temperatures remain above 86°F (30°C) for medium confidence in the rate of sea surface
sustained periods of time. Prior to 1998, Palau temperature change in the region (Australian
had no records of significant bleaching events BOM and CSIRO 2014). Palau is expected
(Colin 2009). Palau’s corals were exposed to continue experiencing high interannual
to intense heat stress during the first global variability in sea surface temperature due to
bleaching event in 1998 when a strong El Niño the El Niño–Southern Oscillation (Australian
event followed by a La Niña event brought BOM and CSIRO 2014).
warmer waters to Palau. Prolonged high tem-
peratures during this period led to significant Widespread coral bleaching is projected
coral death in Palau. Bleaching was widespread to occur annually in Palau by 2040 (van
and affected both shallow and deeper corals Hooidonk et al. 2016). Unless coral species
(Bruno et al. 2001), but Palau’s reef recovered adapt to ocean warming, coral reef areas in
to levels of high coral cover and diversity in Palau are currently projected to experience
most areas impacted by the event (Colin 2009). annual severe bleaching conditions by 2048,
By comparison, Palau experienced minor coral and some areas are expected to experience
bleaching during the global bleaching events these conditions beginning in about 2035 (van
of 2010 and 2014–2017 (van Woesik et al. 2012; Hooidonk et al. 2016) (Fig. 10). A conservative
Colin 2018; Gouezo et al. 2019). model by Storlazzi et al. (2020) indicates that
the semidiurnal temperature fluctuations
24 C L I M AT E C H A N G E I N PA L AU Indicators and Considerations for Key SectorsIndicators of Climate Change in Palau
Projected Onset of Annual Severe Coral Reef Bleaching Conditions
Babeldaob, Koror,
and Peleliu
Figure 10. Projected year of onset of annual severe bleaching conditions for corals in Palau’s
waters (RCP8.5). Original figure by Laura Brewington, using data from van Hooidonk et al. 2016.
around Palau might delay the onset of annual Data show that ocean acidification has been
severe bleaching on the order of a decade under slowly increasing in the waters off of Palau
RCP4.5, but this delay becomes negligible for and throughout the Pacific (Australian BOM
RCP6.0 and RCP8.5. and CSIRO 2014; Feely et al. 2012; Kuchinke
et al. 2014). As extra carbon dioxide in the
Palau’s waters experience large temporal, hori- atmosphere reacts with sea water, the ocean
zontal, and vertical variability of temperatures, becomes slightly more acidic. Ocean chemistry
which has implications for thermal stress on will continue to change and under the high
the reef (Colin and Shaun Johnston 2020), and scenario, all coral reefs are projected to exist
might provide relief to some areas in the near in acidified conditions that will impede their
term. More localized research is needed to ability to grow by the end of the century
improve projections for coral reef bleaching and (Australian BOM and CSIRO 2014).
loss in Palau due to climate change.
25 Managing Climate Risks in the Face of Uncertainty
Managing Climate Risks in the Face of
Uncertainty
Climate change impacts are often difficult to monitor, evaluate, and adapt management
predict, leading to uncertainties in the timing, practices to changing environmental conditions,
magnitude, or type of impacts. Resource such as rising sea levels and temperatures.
managers are responding with various risk Scenarios are used to assess risks over a range
management approaches that can be used of plausible futures that include socioeconomic
to plan for uncertainty. Risk management and other trends in addition to climate. Adaptive
typically involves identifying, evaluating, management approaches can benefit from
and prioritizing current and future climate- technical analysis of hazards (CSIWG 2018),
related risks and vulnerabilities (even those with such as critical infrastructure vulnerability
uncertainties that are difficult to characterize assessments and incorporating climate change
with confidence), and assigning effort and considerations into land-use planning.
resources toward actions to reduce those risks
(USGCRP 2018, Ch. 28, Key Message 3). Future Comprehensive risk management can help to
economic and social conditions are considered avoid adaptation actions that address only one
alongside climate risks. Often risk management climate stressor, such as sea level rise, while
allows for monitoring and adjusting strategies ignoring other current or future climate impacts.
to risks and vulnerabilities as they evolve. Maladaptation arises when actions intended
Addressing equity, economics, and social to address climate risks result in increased
well-being are important parts of effective vulnerability. For example, if a city builds new
climate risk management efforts (Fatorić and infrastructure designed to address the impacts of
Seekamp 2017). increased mean sea level, but then sea level rises
more than anticipated, their infrastructure may
Two approaches to climate risk management, exacerbate flooding if stormwater and sewer
which can be used either separately or together, systems are unable to handle the additional
are: (i) scenario planning, which involves water. To avoid maladaptation, policymakers
the creation of several potential scenarios that and managers can consider a range of future
might develop in the future, based upon a set scenarios and projected impacts over the lifetime
of variables or projections; and (ii) adaptive of a project and communicate across sectors
management, in which resource managers when designing solutions.
What Do Extreme Weather and Climate
Change Mean for Palau’s Families,
Households, and Vulnerable Populations?
Climate change is anticipated to disrupt many health and well-being of families and commu-
aspects of life. More intense extreme weather nities (USGCRP 2018, Summary of Findings).
events, flooding, the transmission of disease, Additionally, climate-related risks to energy
and failing ecosystem health all threaten the and food production and to the global economy
26 C L I M AT E C H A N G E I N PA L AU Indicators and Considerations for Key SectorsEffects of Extreme Weather & Climate Change on Palau’s Families
are projected to cause large shifts in prices and • Foreigners can sometimes be at greater
availability of goods and lead to price shocks risk during natural disasters because they
and food insecurity (USGCRP 2018, Ch. 16, Key do not have the same local networks and
Message 1 and 3). resources as nationals. Palau’s agriculture
and tourism sectors are heavily comprised
Although climate change is expected to affect all of foreign workers, who made up 27% of the
people in Palau, some populations are dispro- population as of 2015 (NEPC 2019).
portionately vulnerable. Social, economic, and
geographic factors shape people’s exposure to • There is disparity between urban areas
climate-related impacts and how they are able (Koror and the suburb of Airai) and rural
to respond. Those who are already vulnerable, communities. On average, rural households
including children, the elderly, low-income have an income of $13,340 versus $16,670
communities, those facing discrimination, and for urban households (Republic of Palau
those with disabilities are at greater risk in 2014), and rural households are more likely
extreme weather and climate events, in part to depend on marine resources to meet
because they are excluded in planning processes their subsistence food needs (NEPC 2019).
(USGCRP 2018, Ch. 14, Key Message 2; Ch. 15, Such differences can influence the ability of
Key Messages 1-3; Ch. 28, Introduction). communities to adapt to extreme weather
events and decreased natural resource
Vulnerable populations are expected to be availability.
affected in the following ways, for example:
Certain populations may also be affected more
• Hot days are increasing, and children have than others by actions to address the causes
a higher rate of heat stroke and heat-related and impacts of climate change, if these actions
illness than adults (USGCRP 2016; EPA are not implemented in ways that consider
2016). existing inequalities (USGCRP 2018, Ch. 11,
• Older adults and persons with disabilities Key Message 4 and Ch. 28, Key Message 4).
are more vulnerable to extreme events, Plans that incorporate local knowledge into
such as storms, that cause power outages decision-making can lead to better outcomes
or require evacuation (USGCRP 2016; EPA for communities at risk (Corburn 2003).
2016). Furthermore, emergency response plans that
• Some of the first to be exposed to the effects include specific accommodations for more
of heat and extreme weather are people vulnerable groups can save lives (USGCRP
who work outdoors, such as tourism and 2016; EPA 2016).
construction workers, fisherpeople, Global action to significantly cut greenhouse
farmers, and other outdoor laborers gas emissions can reduce climate-related risks
(USGCRP 2016; Schulte and Chun 2009). in the long term. For example, the health-
• People who live, work, go to school, or related impacts and costs across the United
otherwise spend time in locations that States are projected to be 50% lower under a
are more directly affected by climate risks lower warming scenario (RCP4.5) than a higher
(such as coastal and other flood-prone warming scenario (RCP8.5) (USGCRP 2018).
areas) are more likely to experience higher
risks to health and safety (USGCRP 2016).
27 Effects of Extreme Weather & Climate Change on Palau’s Key Sectors
What Do Extreme Weather and Climate
Change Mean for Palau’s Key Sectors?
The ad hoc Climate Change Committee of the Government of Palau identified “priority risks” in
ten sectors based on the probability, frequency, and severity of impacts associated with climate
change and disaster events (Republic of Palau 2015a). A table from the Palau Climate Change Policy
lists the top three priority risks for the assessed sectors and appears here as an appendix. The
Pacific Islands Regional Climate Assessment suggests the following considerations for managers
working in these ten sectors and adds detail to the priority risks based on a comprehensive review
of published literature on climate science, climate-related risks in the Pacific Islands, and risk
management approaches.
If you are involved in farming and agroforestry…
• Expect climate change to negatively • Plan for warmer weather. Rising tem-
impact agriculture and agroforestry peratures will increase evapotranspiration,
production. In Palau the value of locally affecting the amount of water crops require.
grown agricultural goods accounts for $9.3 Warmer temperatures will enable some
million annually, or 3.2% of GDP and 3.8% crops to be cultivated in locations currently
of the nation’s work force (World Bank unsuitable for them; however, warming
2019). Subsistence crop production is the temperatures can increase the incidence
predominant agricultural activity in Palau and spread of disease, as higher nighttime
(FAO 2019), and Palau’s Bureau of Agri- temperature does for taro leaf blight. Rising
culture promotes agroforestry. Farms and temperatures can also increase the demand
agroforests are already exposed to impacts on available freshwater resources, which in
from soil erosion, flooding, drought, winds, turn can lead to water shortages, impacting
diseases and pests, and clearing for devel- the local economy and food security.
opment. Climate change will exacerbate
these impacts for some crops and locations. • Monitor research and development of
Changing rainfall and higher temperatures, farming methods that improve food
for example, are expected to increase pest security and ecosystem resilience. Tradi-
and disease problems in staple crops such tional farming systems enhance resilience
as bananas (Taylor et al. 2016). The planting to external shocks and help to bolster
and harvesting times for traditional food food security (McGregor et al. 2009). For
crops depend on factors such as rainfall, example, cultivated wetland taro in Palau
temperature, and the seasons, and may need has been shown to control erosion, improve
to be adjusted due to climatic shifts (Iese soil health and reduce the impact of
et al. 2018). Saltwater intrusion will put sediment pollution on nearshore coral reefs
low-lying agriculture and taro patches at (Koshiba et al. 2014). Low-lying taro fields
risk. Resilience to climate change is expected are at increasing risk of saltwater intrusion,
to require changes in farming methods and making research into salt-tolerant taro
cultivars (Bell and Taylor 2015). varieties important. The Agriculture
Division at Palau Community College’s
28 C L I M AT E C H A N G E I N PA L AU Indicators and Considerations for Key SectorsEffects of Extreme Weather & Climate Change on Palau’s Key Sectors
Cooperative Research and Extension Department conducts wide-ranging research on Palau’s
staple root crops, including taro (Del Rosario et al. 2015).
A taro field in Palau slows runoff from rainfall events and reduces erosion by trapping sediment.
Photo: Faustina K. Rehuher-Marugg.
If you are involved in fisheries or managing ocean resources…
• Expect declining coral reef health. 2007; van Woesik et al. 2012). However,
Watershed conservation measures can these nearshore reefs are threatened by
help protect refugia for coral populations. local impacts such as pollution and soil
In the next few decades, more frequent erosion from land-use change (Golbuu et
coral bleaching events and ocean acidifi- al. 2011), and overexploitation of fish stocks
cation will combine with other stressors (Muller-Karanassos et al. 2020). Ridge to
such as erosion and sedimentation to reef management approaches emphasize
threaten coral reefs and the livelihoods the linkages between terrestrial and marine
they support. Widespread coral bleaching ecosystems, and can help to address the
is projected to occur annually in Palau by negative impacts of land-based activities on
2040 (van Hooidonk et al. 2016). Nearshore coral reef health.
reefs in Palau’s bays have demonstrated
more resistance to heat stress than patch • Expect reduced available catch for sub-
and outer reefs, and could be refugia for sistence and commercial fishing. Fish
corals from climate change (Golbuu et al. is important for food security in Palau,
29 Effects of Extreme Weather & Climate Change on Palau’s Key Sectors
with an estimated 80% of the population cucumber, coral, and ornamental marine
consuming wild foods (FAO 2019), and aquarium fish (NEPC 2019; Pickering et al.
wild reef fish comprising a major part of 2011). Palau’s focus on native species for
local diets (Dacks et al. 2020). Reef fish aquaculture has helped minimize the intro-
are primarily caught and consumed by duction of transboundary aquatic animal
local residents, while offshore fisheries are diseases that can accompany imported
dominated by foreign-owned vessels and species, threatening both aquaculture and
the majority of catch is exported (Oleson et wild stocks (FAO 2018). Research on the
al. 2019). Climate change and ocean acidifi- impacts of climate change on aquaculture
cation could result in 20% declines in coral identify the potential for increased aquatic
reef fish by 2050 (Bell et al. 2013). Rapidly animal diseases and harmful algal blooms,
changing conditions also affect open infrastructural damage from floods and
ocean fisheries. Under a business-as-usual storms, and decreasing availability of
scenario for 2100, maximum potential catch freshwater and wild seed (Barange et al.
is projected to decline by more than 50% 2018; Bell et al. 2013).
for most islands in the central and western
Pacific including Palau (Asch et al. 2018). • Be alert to potential health risks on hot
days. With warming temperatures, fishers
• Monitor research and development of will be at increased risk of heat illnesses and
aquaculture methods, while keeping heat stroke while at sea. Precautions include
biosecurity risks of imported species in bringing extra drinking water, consuming
mind. Palau’s current aquaculture species sufficient fluids and electrolytes, finding
include giant clam, milkfish, shrimp, reef ways to stay cool while at sea, and avoiding
fish, mangrove crab, grouper, rabbitfish, sea exposure to extreme heat conditions.
If you work in public health or disaster management…
• Account for the consequences of climate are observed to result in illness and death.
change at multiple levels across the health People working outside on hot days are at
sector. Climate change and extreme events greater risk to heat stress, including fishers,
are anticipated to affect individuals and farmers, and construction workers. Some
communities, and also affect healthcare groups have a higher risk of becoming ill
facilities and public infrastructure. or dying due to extreme heat, including
Adaptation actions at multiple scales are people with chronic illnesses, older adults,
needed to prepare for and manage health and children (Sarofim et al. 2016). To assess
risks in a changing climate (USGCRP 2018, the risks of rising air temperatures and
Ch. 14, Key Message 3). other climatic changes on local health, the
United States Center for Disease Control
• Prepare for more frequent extreme heat and Prevention developed the “Building
events that are expected to increase Resilience Against Climate Effects”
heat-related illness and death. Even small (BRACE) framework (CDC 2019; Marinucci
increases in seasonal average temperatures et al. 2014), which could be used to inform
can increase extremes, and in some places local climate and health strategies in Palau.
30 C L I M AT E C H A N G E I N PA L AU Indicators and Considerations for Key SectorsEffects of Extreme Weather & Climate Change on Palau’s Key Sectors
Sechemus Hamlet is regularly flooded during king tides. Photo: O. Obechad.
• Expect stronger typhoons and storms. • Prepare for disaster response and recovery
Although they might occur less frequently from stronger storms. Injuries, fatalities,
in the future, the tropical cyclones that and mental health impacts are associated
do affect Palau are expected to bring with strong storms, especially in coastal
stronger winds, storm surge, and greater populations vulnerable to storm surge.
precipitation amounts. Coral reefs protect Health risks increase after a storm when
the shoreline by weakening wave energy. infrastructure and housing is damaged,
Projected sea level rise and a decline in and electricity, sanitation, safe food and
coral cover would reduce Palau’s protection water supplies, communication, and trans-
from storms. portation are disrupted. Communication
systems are important for quick response
31 Effects of Extreme Weather & Climate Change on Palau’s Key Sectors
leading up to, during, and after natural climate change will drive up the prices of
disasters. Government and non-govern- imported foods (USGCRP 2018). Palau’s
mental organizations can increase adaptive narrow economic base also increases its
capacity, for example by providing early vulnerability to economic shocks, which if
warning systems, evacuation assistance, severe enough could impact food security.
and disaster relief (McIver et al. 2016; Bell
et al. 2016). They can also build resilience • Prepare for increasing frequency of tidal
through ecosystem-based adaptation, for flooding events. The public health and
example by revegetating coastal areas disaster management sector will be faced
with mangroves to reduce flooding and with the combined impacts of sea level
erosion, thereby helping to protect coastal rise, storm surge inundation, and king tide
communities from storm surge and high flooding. During flood events, travel along
winds (Förster et al. 2019). Pre-planning for the coast and access to medical services
disaster recovery can help communities to may be jeopardized. The Belau National
seize opportunities and funds to improve Hospital, Palau’s only secondary care
resilience to future disasters during the facility, is located on the coast. Further
recovery and rebuilding phase (FEMA research is needed to assess if the hospital
2017). and/or access routes to it are vulnerable to
extreme weather and climate change.
• Prepare for climate change to disrupt
“lifeline” infrastructure. Storms can • Monitor emerging research on climate and
disrupt sewage and water lines. Both vector-borne diseases. Palau experienced
storms and heatwaves can impact electrical a sharp rise in cases of dengue in 2016
supply. Extended disruptions to these and a dengue outbreak was announced in
services carry human health and safety December 2018. Mosquito-borne pathogens
risks (Mora et al. 2018). like dengue have increased as global health
threats in recent years (Beard et al. 2016).
• Prepare for more food insecurity in Palau’s Researchers are concerned that future
households. Palau’s Climate Change Policy warming and precipitation changes will
identified disruption of food supply and increase the suitable habitat for pathogens
food production systems as a key risk and vectors, thereby increasing the
in the health sector (Republic of Palau instances of dengue fever, malaria, diarrhea,
2015a). In Palau, an estimated 81–84% of salmonellosis, and other diseases (Mora et
food consumed is imported (McGregor et al. 2018). Community-level adaptation and
al. 2012). Recent data suggests that local public health measures can reduce human
agricultural production is beginning to vulnerability to water-borne and vec-
increase (NEPC 2019). A heavy dependence tor-borne disease (Beard et al. 2016; Radke
on imported foods can increase Palau’s et al. 2012; Reiter et al. 2003).
vulnerability, since it is highly likely that
32 C L I M AT E C H A N G E I N PA L AU Indicators and Considerations for Key SectorsYou can also read