Industrial defect detection by comparison with reference 3D CAD model
←
→
Page content transcription
If your browser does not render page correctly, please read the page content below
https://doi.org/10.2352/ISSN.2470-1173.2021.8.IMAWM-281
                                                                                          © 2021, Society for Imaging Science and Technology

Industrial defect detection by comparison with reference 3D
CAD model
Deangeli G. Neves; Eldorado Research Institute; Campinas, SP, Brazil
Guilherme A. S. Megeto; Eldorado Research Institute; Campinas, SP, Brazil
Augusto C. Valente; Eldorado Research Institute; Campinas, SP, Brazil
Qian Lin; HP Inc; Palo Alto, California, USA

Abstract                                                               defects, such as shape, size and other.
       In this work, we propose a method that detects and segments           There are some public datasets available for defect detection.
manufacturing defects in objects using only RGB images. The            The majority of them [5, 6] only contain 2D images (greyscale,
method can be divided into three different integrated modules:         RGB, depth) with a limited number of views for each type of ma-
object detection, pose estimation and defect segmentation. The         terial. We are assuming that this type of restriction is undesirable
first two modules are deep learning-based approaches and were          for an automated defect detection system because it must perform
trained exclusively with synthetic data generated with a 3D ren-       the detection robustly, regardless of the orientation of the object or
dering engine. The first module, object detector, is based on the      camera. Also, create or expand a dataset is time-consuming and
Mask R-CNN method and provides the classification and segmen-          might be impractical in some scenarios. Our method proposes
tation of the object of interest as the output. The second module,     a solution that uses only synthetic data which is generated from
pose estimator, uses the category of the object and the coordi-        3D meshes avoiding human effort. To achieve that, we divide the
nates of the detection as input to estimate the pose with 6 degrees-   defect inspection problem into three different steps: object de-
of-freedom with an autoencoder-based approach. Thereafter it is        tection, pose estimation and defect segmentation. The first two
possible to render the reference 3D CAD model with the estimated       are deep learning-based approaches while the last one uses im-
pose over the detected object and compare the real object with its     age processing techniques. To train the deep learning models we
virtual model. The third and last step uses only image processing      used synthetic data generated from 3D CAD models. Thus, our
techniques, such as morphology operations and dense alignment,         method can be fully extended to detect manufacturing defects in
to compare the segmentation of the detected object from the first      any manufacturing part. The results indicate that our method can
step, and the mask of the rendered object of the second step. The      perform manufacturing defect segmentation in near real-time with
output is an image with the shape defects highlighted. We evaluate     promising results.
our method on a custom test set with the intersection over union
metric, and our results indicate the method is robust to small im-     Related work
precision from each module.                                                  Classical systems for defect inspection require a complex
                                                                       setup to work properly. This setup may be composed, for ex-
Introduction                                                           ample, of depth sensors, lighting systems, X-ray, high-resolution
      Vision-based automatic manufacturing defect inspection is        RGB cameras, among others. To reach satisfactory results in these
a task that remains a challenge nowadays due to the complex-           systems it is required a contrasting background or a careful cal-
ity of detecting many defect types on a variety of materials and       ibration process that demands a significant amount of time and
shapes. We can frame the defect detection in different categories      effort. For example, [7] created a stand-alone system which en-
of problems: classification, detection, and segmentation. For the      closure the object of interest in ”black box” with controlled light-
first one, we input an image (RGB, greyscale, depth map) and           ing condition. In the black box, there is a mechanism used to
then a classification model can be employed to assign a label (one     detect the object inside the box and then an RGB image is taken
for each defect) for the image. There is also the possibility of       by a high-resolution camera. Next, features are extracted from
creating a pure imaging processing approach that computes fea-         this image and a reference image (for the same object of inter-
tures from the image and then checks if some of these features are     est) and after that, these features are matched to align the images.
correlated with manufacturing-defect. However, the defect loca-        Since the images are aligned, the RGB images are binarized and
tion is important information that may be used as a clue to find       then morphological operations are applied to segment the contour
problems during the manufacturing process, that is why the ma-         defect. However, the proposed method is not robust to the object
jority of approaches focus on detection and/or segmentation of the     6-DoF (Degrees of Freedom) pose, since depends on a reference
defect [1, 2, 3, 4]. Defect detection is an improvement over the       image to compute a linear transformation to align the input image
classification-only approach because it provides both: defect label    to the reference one.
and defect bounding-box location. In addition, it can detect mul-            Other approaches employ a deep learning model to detect
tiple defects in the same image since a label is assigned for each     or segment defects from RGB images [1] or x-ray images [2].
bounding box. The target of a segmentation approach is to assign       However, those approaches require the creation of a training set
a label for each defect pixel. Hence we can delimiter more pre-        that demands time, especially if it is desired to detect defects in
cisely the defect and extract more detailed information regarding      many types of manufacturing parts. Our method is fully trained

IS&T International Symposium on Electronic Imaging 2021
Imaging and Multimedia Analytics in a Web and Mobile World 2021                                                                           281-1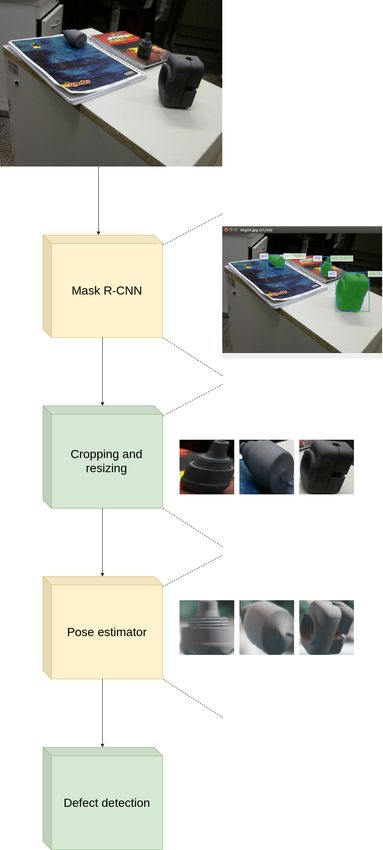
with synthetic data that is generated from 3D meshes files for each   made manually while the entire process of acquisition of the RGB
object of interest.                                                   and label (mask) images was fully automated.
     In [8], the authors trained an autoencoder that given an RGB          Once a 3D environment is selected, the training data is
image of the object of interest, with or without defects, the model   generated as follows:
reconstructs the input with no defects. The authors were able to
highlight defects in the input image (if they exist) analyzing the      1. Read list of objects of interest on 3D environment
differences between the original one and its reconstruction. How-          (ob jsinterest )
ever, the proposed solution depends on the quality of reconstruc-       2. Read the list of surfaces (may be a table, chair, desktop,
tion and a poor autoencoder reconstruction can result in many              etc) where the objects from ob jsinterest will be spawn on it
false positives. Thus, the solution may not generalize well in a           (sur f acesspawn )
scenario where many types of materials or when the input data           3. Define a pose set (poseset )
mismatch a bit from the distribution of the training data. Our          4. Move all objects in ob jinterest outside of sigh from camera’s
method can be extended for many scenarios since we use robust              point of view
object detection to detect the object of interest and then we com-      5. For each ob j in ob jsinterest do
pute its 6-DoF.
                                                                             (a) Move ob j to the 3D environment
                                                                             (b) For each ob j pose in poseset
Our method
     As mentioned before, our method is separated into three                          i. Select a random surface from sur f acesspawn
modules: the first one is an object detector, the second one is a                    ii. Spawn the object with the pose ob ject pose on the
6-DoF object pose estimator, and the last one is an image process-                       selected surface
ing technique to detect discrepancies between two binary images.                   iii. Generated a random displacement (dx, dy, dz)
The dataset used to validate our method was the T-LESS [9]. We                           between the camera and the object (dis-
decided to select this dataset because of the following aspects:                         placement) and update the camera position
                                                                                         (camera pos ) from object position (ob ject pos ).
   • It contains textureless manufacturing parts                                         camera pos = ob ject pos + displacement
   • High similarity among the manufacturing parts                                  iv. Compute the camera rotation components to
   • High degree of symmetry                                                             guarantee the camera points out to the ob ject pos
                                                                                     v. Apply the camera translation and rotation com-
      Most of these aspects make this dataset particularly tough                         ponents computed in (iii) and (iv) respectively
to train a deep learning model, that is why this dataset has not                   vi. Save the RGB image and mask (labeled image)
become so popular [10]. The following subsections explain our                            from current camera visualization
method. Firstly, we discuss about the synthetic data generation              (c) Move ob j ”far away” from 3D environment
and how we trained the object detection/segmentation model us-
                                                                           In our approach we generated only one object per image,
ing generated data; after that, we detail how we estimated the 6-
                                                                      but we can change the algorithm to spawn multiple objects on
DoF object pose from the detection output; then we discuss how
                                                                      the same surface. This way, we can train a model that is more
using image processing to detect manufacturing defect in the in-
                                                                      robust to clutter and occlusion. In our training dataset we gener-
put image; finally, we describe how to combine the three modules
                                                                      ated almost 31k pairs of images and masks. The Figure 1 shows
to perform the defect detection.
                                                                      some images from our synthetic dataset used to train a detec-
                                                                      tion/segmentation model. We selected the Mask R-CNN model
Synthetic data generation and object detector
                                                                      as the detector model. To train this DNN (Deep Neural Network)
      In order to mitigate the domain shift [11] between the syn-
                                                                      model, we used an open-source framework from Facebook Re-
thetic data and the real one, we must generate synthetic samples
                                                                      search [15].
as realistic as possible. This means the synthetic data generation
must take into account key aspects for satisfactory realism:
                                                                      Object 6-dof pose estimation
   • high-quality textured objects                                          We used a method called “Augmented Autoencoder” (AAE)
   • variety of 3D environments (to generate a variety of back-       [16] to estimate the pose. This method consists of training an au-
     grounds)                                                         toencoder to reconstruct only the object of interest from the input
   • photorealism                                                     image. This autoencoder shall be robust to translation, rotation,
   • physics (collision, gravity, etc)                                occlusion, noise and other augmentations that can be applied on
                                                                      data.
     We tested both OpenGL and VTK [12] rendering library;                  After training the autoencoder model, we generate a set of
however, using Unreal Engine 4 (UE4) [13] we were able to             predefined views for the object. To generate these predefined
achieve the necessary level of realism. Also, UnrealCV [14] was       views we used the same approach described in the original pa-
employed to automate the process of moving the camera and the         per which consists of centering the object and moving the camera
objects of interest through the 3D environment. Two 3D environ-       across a spherical surface (Figure 2). We then compute the cam-
ments were created, an office environment and a room, and for         era rotation to guarantee the camera is pointing to the object and
each one of them, sets of textures were created for all 3D objects    take the screenshot.
in the environment. The transition between 3D environments was              Finally, it is required to generate the codebook which embeds

                                                                                    IS&T International Symposium on Electronic Imaging 2021
281-2                                                                    Imaging and Multimedia Analytics in a Web and Mobile World 2021
of interest.

Figure 1.   Training images generated from 3D rendering. Best viewed in
color. All 3D scenes was rendered using Unreal Engine 4 [13]

                                                                           Figure 3. Diagram of the pipeline for defect detection module

Figure 2.   Generating the predefined views for a given object. Each dot        One input of this module is the mask of the segmented object
represents a possible camera location. source                              from the detection module. The other input is the mask of the
                                                                           rendered object from the pose estimation module. Both masks are
                                                                           binary images of the same size. To highlight the differences, the
a triplet for each view: a latent code (encoder output), a rotation        main idea is to take the absolute difference between the masks.
matrix and the original object bounding box (bounding box before           The expected result should highlight shape defects (missing parts
the crop and resize). To estimate the pose for a new entry, we first       or additive material); however, misalignment between the masks
compute the cosine distance between it and the other entries in            (e.g. imprecision from the pose estimation) and imperfections
the codebook. The pose from the closest entry in the codebook is           from the segmentation (mainly in finer details) also may appear
assigned to the new entry.                                                 as possible defects.
      To estimate the translation components, we used the same                  It is expected that the estimated pose should be very close to
procedure described in [16]. It consists of first estimating depth         the correct one. However, to deal with some imprecision and im-
from the scale ratio between the detected bounding box and the             perfections from the previous modules, we applied dense align-
codebook scale and then using the bounding box center to esti-             ment to the masks of the objects. We used the ECC-based iter-
mate the translation in X and Y.                                           ative image alignment algorithm [17] implemented in OpenCV
                                                                           [18] with a predefined low number of iterations (e.g. 10) to keep
Detecting shape defect on manufacturing parts                              near real-time results. Note that this works as a refinement step,
      In this work, we focus only on shape defect detection be-            and it is not necessary if we are able to guarantee a nearly perfect
cause, in our judgment, it is more crucial to industrial parts to          pose estimate, which is usually not the case.
have the correct shape when compared to surface defects such as                 After computing the alignment, we compute the absolute dif-
scratches. The main idea of the method is to compare the silhou-           ference between masks and apply the mathematical morphology
ettes (masks) of the detection and the rendered object to highlight        opening operation over the resulting binary image. It is possible
the differences that are possible defects (see Figure 3). The masks        to specify one or more sizes (in pixels) for the structuring element
are binary images, with black pixels that represent the background         (a square) to remove noise and small systematic imperfections
and white pixels to represent all pixels that compound the object          keeping only the most significant differences that are considered

IS&T International Symposium on Electronic Imaging 2021
Imaging and Multimedia Analytics in a Web and Mobile World 2021                                                                             281-3
possible defects. When more than one size of the structuring el-
ement is specified, the result from the morphology opening for
each size is accumulated like a heatmap. The maximum value in
the heatmap is the total number of sizes for the structuring ele-
ments. A threshold is specified to create a binary solution, keep-
ing only the greater differences and discarding the small ones. In
our experiments, we empirically set the threshold as 70% of the
maximum value of the heatmap.
Evaluation of the shape defect detection is not trivial because
the results depend on the outputs of the previous modules. The
following example (Fig. 4) was taken when the estimated pose
was near to the correct pose of the object, and, after that, the de-
fect (additive material) was annotated manually. The evaluation
was based on one of the most used metrics for segmentation, the
Jaccard index also called intersection over union (IoU).
(a) Original image (b) Annotated defect
Figure 4. Original image and defect annotation. Best viewed in color.
The results in Figure 6 considered the structuring elements
of sizes 3, 5, 7, 9, 11, 13 and 15, and a threshold of 70% of the
maximum value from the heatmap to create a binary solution for
defect/no-defect.
Combining the modules
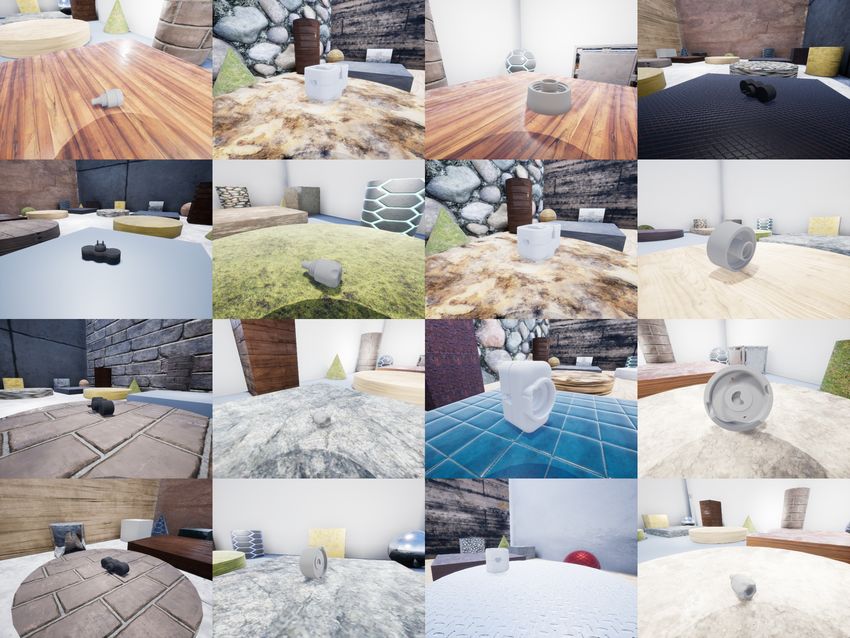
The full pipeline of the method can be summarized in the
following steps: Figure 5. An overview of the proposed method to detect shape defects.
Best viewed in color.
1. The trained object detector detects all objects of interest
given an input image.
2. Each detected object is cropped and resized to a 128 × 128
RGB image. The chosen backbone for the network was a ResNeXt-101
3. For each crop, select the suitable codebook (a codebook per [19] with Feature Pyramid Networks [20]. The generated train-
object of interest) to be used on pose estimator. ing set contains 40 380 images (1 346 per object), and each image
4. Given the estimated pose, render the 3D mesh at that pose; contains only one object. The batch size was set as 2 and the
and then generate the binary mask from it. maximum number of iterations was 720 000. We used Stochastic
5. Take the segmentation mask from the detector (step 1) and Gradient Descent with base learning rate as 1.25e−3 and weight
the mask from the rendered object (step 4) and use them to decay of 1e−4. After all iterations, the best model was selected
compute the manufacturing defect. based on validation set performance.
The validation and test sets contain images of objects in the
The Figure 5 illustrates the combination of all modules. real world (i.e. no synthetic data). The test set contains 67 images
with more than 100 annotated object instances, so there are im-
Evaluation ages with more than one object per image in this set. The model
In our proposed pipeline, the quality of the defect detection achieved a score of 81% mean average precision for bounding box
depends on the first two modules, object detection and pose es- detection and instance segmentation.
timation. For this reason, we decided to evaluate each module
separately. Pose estimation
For the Augmented Autoencoder approach, we trained one
Object detection pose estimation model per object. The metric used to evaluate
We trained a Mask R-CNN model using only synthetic data the models was the ADI (Average Distance for Indistinguishable
generated by the Unreal Engine 4 [13] 3D rendering engine. views) [21].
IS&T International Symposium on Electronic Imaging 2021
281-4 Imaging and Multimedia Analytics in a Web and Mobile World 2021
   eADI (R, T, R̂, T̂ , M) = avg min (Rx1 + T ) − R̂x2 + T̂       (1)
                           x1 ∈M x2 ∈M

      where x1 , x2 are views from a set of indistinguishable views
M. The matrices R and T are the expected rotation matrix and
translation vector respectively, while R̂ and T̂ are the predicted
ones. In summary, the equation 1 computes the difference be-
tween the closest 3D points from the expected transformation
(R, T ) and predicted one (R̂, T̂ ). Thus low values of eADI indicate
that the pose prediction is close to the expected one. As meshes
can be quite distinct from each other, the scores were normalized
by mesh diameter (distance between the two farthest points on
mesh). The test set contains 1 265 annotated images with a sim-
ilar process used to annotate the training set for T-LESS dataset.
The test set contains 23 out of 30 from T-LESS meshes. The av-
erage score computed for the test set was 0.0737, which means
the misalignment between two points is, in average, 7% of the
object diameter. A score below 10% is usually considered a suc-
cessful alignment [22]. The misalignment score for each object
varies from 3% to 13%, which means the pose estimator did not
perform satisfactorily for some objects.

Shape defect detection
      We prepared a small test set with 12 images with ground           Figure 6. Intersection over union for different sizes of structuring element of
truth to evaluate the shape defect detection module. We selected        morphology operations and with and without the dense alignment for object
7 images to show more representative results, but the results were      of Fig. 4. Best viewed in color.
similar for the entire test set. The images were annotated as in Fig.
4. Two aspects of this module were evaluated: i) the size of the
structuring element, in pixels, of the morphology operations, and       structuring element size, which can suppress some misalignment
ii) the presence or not of dense alignment. The intersection over       noise and keep only possible defects. Furthermore, the proposed
union (IoU) was the selected metric to evaluate the shape defect        technique involving cumulative results and heatmap thresholding
detection module.                                                       could smooth the output and provide good results for more diverse
      For the sample in Fig. 4, the results in Fig. 6 considered the    situations.
structuring elements of sizes 3, 9, 15, and the cumulative results
for the series 3, 5, 7, 9, 11, 13, 15 with a threshold of 70% of the    Conclusion
maximum value from the heatmap to create a binary solution for               This work presented a method to automatically detect and
defect/no-defect.                                                       segment shape defects on objects from an industrial context. The
      The Fig. 7 shows the best result for each sample. The Table 1     system is composed of three different modules: object detection,
shows the average results for the selected seven images, samples        pose estimation and shape defect detection. Deep learning mod-
of Fig. 6 and Fig. 7. The best result is with alignment and the         els were used in the object detection and pose estimation modules,
structuring element of size 9.                                          and all of them were trained using only synthetic data generated
                                                                        by a 3D graphics engine. Our results indicate that the object de-
Average of intersection over union considering seven exam-              tector successfully identifies the objects of interest in RGB im-
ples from Figures 4 and 7                                               ages. The pose estimator, however, did not perform well enough
                                                                        for some objects, which indicates some improvements are re-
                         with alignment           no alignment          quired to better handle the symmetrical and texture-less objects.
 size 3                  0.359                    0.189                 The shape defect detection module compares the binary masks
 size 5                  0.408                    0.245                 from the segmented object and the reference 3D mesh to esti-
 size 7                  0.214                    0.244                 mate the possible regions with defects. Our results indicate the
 size 3-15               0.378                    0.271                 method is robust enough to detect shape defects in manufacturing
                                                                        parts. Possible future work include extending the defect detec-
                                                                        tion module to handle other types of imperfections such as surface
     The results show that the dense alignment is crucial to have       scratches, tearing, and wrinkling.
good results in most situations. As expected, as the size of the
structuring element increases, finer details of the difference masks
are lost, and this could result in failure to detect small defects.
On the other hand, greater structuring element sizes could ig-
nore all the differences. Therefore, a good trade-off is a medium

IS&T International Symposium on Electronic Imaging 2021
Imaging and Multimedia Analytics in a Web and Mobile World 2021                                                                                     281-5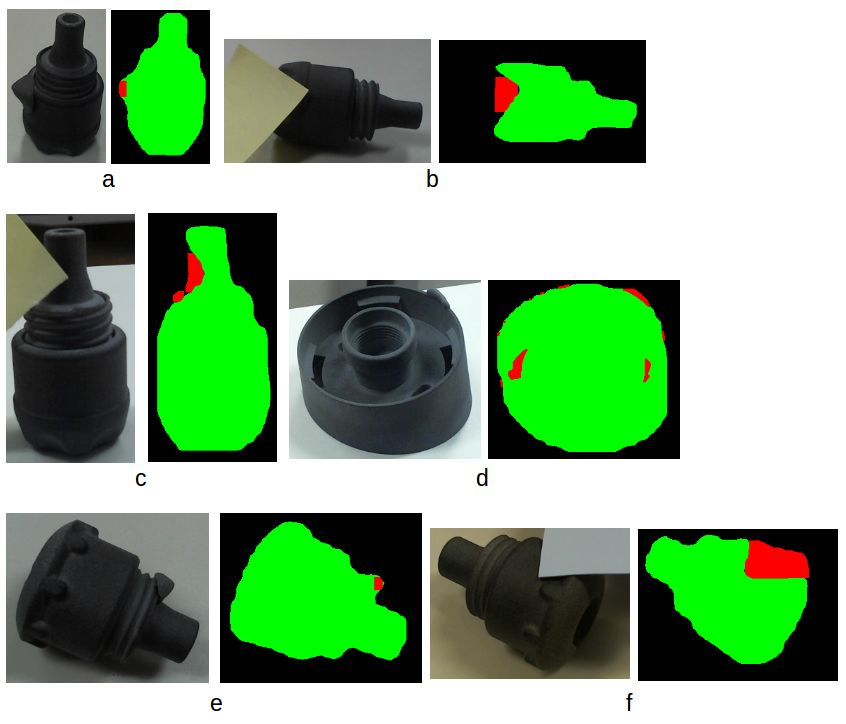
brewedDB: RGB-D dataset for 6D pose estimation of 3D
                                                                                     objects,” in ICCVW, April 2019.
                                                                              [11]   Y. Luo, L. Zheng, T. Guan, J. Yu, and Y. Yang, “Taking
                                                                                     A closer look at domain shift: Category-level adversaries
                                                                                     for semantics consistent domain adaptation,” CoRR, vol.
                                                                                     abs/1809.09478, 2018.
                                                                              [12]   W. Schroeder, K. Martin, and B. Lorensen, The Visualiza-
                                                                                     tion Toolkit, 4th ed. Kitware, 2006.
                                                                              [13]   Epic Games, “Unreal engine.” [Online]. Available:
                                                                                     https://www.unrealengine.com
                                                                              [14]   W. Qiu, F. Zhong, Y. Zhang, S. Qiao, Z. Xiao, T. S. Kim, and
                                                                                     A. Y. Yizhou Wang, “Unrealcv: Virtual worlds for computer
                                                                                     vision,” ACM Multimedia Open Source Software Competi-
                                                                                     tion, 2017.
                                                                              [15]   F. Massa and R. Girshick, “maskrcnn-benchmark: Fast,
                                                                                     modular reference implementation of Instance Segmen-
                                                                                     tation and Object Detection algorithms in PyTorch,”
                                                                                     https://github.com/facebookresearch/maskrcnn-benchmark,
                                                                                     2018, accessed: 2019-12-17.
Figure 7.   Best results of IoU for some examples. a) With alignment, sizes   [16]   M. Sundermeyer, Z.-C. Marton, M. Durner, M. Brucker, and
3–15, IoU=0.378. b) No alignment, size 15, IoU=0.553. c) With alignment,             R. Triebel, “Implicit 3d orientation learning for 6d object
size 9, IoU=0.590. d) With alignment, sizes 3–15, IoU=0.308. e) No align-            detection from rgb images,” in ECCV, September 2018.
ment, size 15, IoU=0.825. f) With alignment, size 3, IoU=0.203. Best viewed   [17]   G. D. Evangelidis and E. Z. Psarakis, “Parametric image
in color.                                                                            alignment using enhanced correlation coefficient maximiza-
                                                                                     tion,” IEEE Transactions on Pattern Analysis and Machine
                                                                                     Intelligence, vol. 30, no. 10, pp. 1858–1865, 2008.
References                                                                    [18]   G. Bradski, “The OpenCV Library,” Dr. Dobb’s Journal of
 [1] O. Essid, C. Samir, and L. Hamid, “Automatic detection                          Software Tools, 2000.
     and classification of manufacturing defects in metal boxes,”             [19]   S. Xie, R. Girshick, P. Dollár, Z. Tu, and K. He, “Aggre-
     PLOS ONE, vol. 13, October 2018.                                                gated residual transformations for deep neural networks,” in
 [2] M. Ferguson, R. ak, Y.-T. Lee, and K. Law, “Detection and                       CVPR, July 2017, pp. 5987–5995.
     segmentation of manufacturing defects with convolutional                 [20]   T. Lin, P. Dollár, R. Girshick, K. He, B. Hariharan, and
     neural networks and transfer learning,” Smart and Sustain-                      S. Belongie, “Feature pyramid networks for object detec-
     able Manufacturing Systems, vol. 2, pp. 137–164, 09 2018.                       tion,” in CVPR, July 2017, pp. 936–944.
 [3] D. Yapi, M. Mejri, M. S. Allili, and N. Baaziz, “A learning-             [21]   T. Hodaň, J. Matas, and Š. Obdržálek, “On evaluation of 6d
     based approach for automatic defect detection in textile im-                    object pose estimation,” in ECCVW, 2016, pp. 606–619.
     ages,” 15th IFAC Symposium on Information Control Prob-                  [22]   S. Hinterstoisser, V. Lepetit, S. Ilic, S. Holzer, G. Bradski,
     lems in Manufacturing, vol. 48, no. 3, pp. 2423 – 2428,                         K. Konolige, and N. Navab, “Model based training, detec-
     2015.                                                                           tion and pose estimation of texture-less 3d objects in heavily
 [4] F. Zhou, G. Liu, F. Xu, and H. Deng, “A generic automated                       cluttered scenes,” in ACCV, October 2012.
     surface defect detection based on a bilinear model,” Applied
     Sciences, vol. 9, p. 3159, August 2019.
 [5] P. Bergmann, M. Fauser, D. Sattlegger, and C. Steger,
     “MVTec AD - A comprehensive real-world dataset for un-
     supervised anomaly detection,” in CVPR, June 2019.
 [6] “DAGM          2007       datasets,”       https://hci.iwr.uni-
     heidelberg.de/node/3616, accessed: 2019-12-17.
 [7] H. Chen, Y. Cui, R. Qiu, P. Chen, W. Liu, and K. Liu,
     “Image-Alignment Based Matching for Irregular Contour
     Defects Detection,” IEEE Access, vol. 6, pp. 68 749–68 759,
     2018.
 [8] P. Bergmann, S. Löwe, M. Fauser, D. Sattlegger, and C. Ste-
     ger, “Improving unsupervised defect segmentation by ap-
     plying structural similarity to autoencoders,” VISIGRAPP,
     vol. 5, pp. 372–380, 2019.
 [9] T. Hodaň, P. Haluza, Š. Obdržálek, J. Matas, M. Lourakis,
     and X. Zabulis, “T-LESS: An RGB-D dataset for 6D pose
     estimation of texture-less objects,” in WACV, 2017.
[10] R. Kaskman, S. Zakharov, I. Shugurov, and S. Ilic, “Home-

                                                                                            IS&T International Symposium on Electronic Imaging 2021
281-6                                                                            Imaging and Multimedia Analytics in a Web and Mobile World 2021
JOIN US AT THE NEXT EI!

 IS&T International Symposium on

 Electronic Imaging
 SCIENCE AND TECHNOLOGY

Imaging across applications . . . Where industry and academia meet!

• SHORT COURSES • EXHIBITS • DEMONSTRATION SESSION • PLENARY TALKS •
• INTERACTIVE PAPER SESSION • SPECIAL EVENTS • TECHNICAL SESSIONS •

                  www.electronicimaging.org
                                                             imaging.org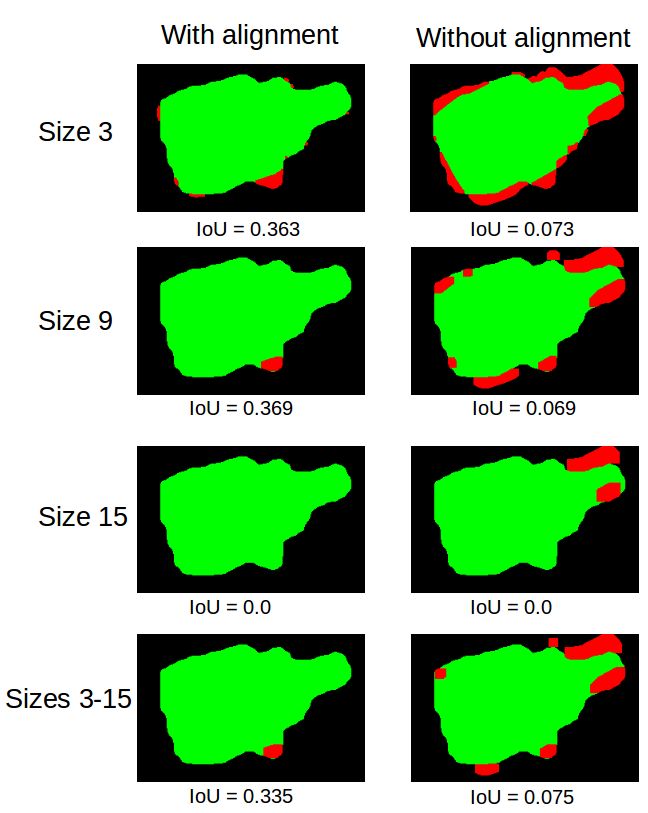
You can also read