Inflation on the Upswing - Just a Hiccup or the Trend Reversal After All?
←
→
Page content transcription
If your browser does not render page correctly, please read the page content below
IN-DEPTH ANALYSIS
Requested by the ECON committee
Monetary Dialogue Papers, September 2021

 Inflation on the
 Upswing - Just a
 Hiccup or the Trend
 Reversal After All?

 Policy Department for Economic, Scientific and Quality of Life Policies
 Directorate-General for Internal Policies
 Authors: Kerstin BERNOTH, Gökhan IDER EN
 PE 695.450 - September 2021
Inflation on the
 Upswing - Just a
 Hiccup or a Trend
 Reversal After All?
 Monetary Dialogue Papers
 September 2021
Abstract
Although energy price volatility has recently been the largest
contributor to movements in the headline inflation rate, there are
other factors indicating that inflation in the euro area will remain
elevated in the months ahead. However, most of them have only
a temporary effect. A major risk to the further development of
inflation is a rise in inflation expectations, which should be
monitored critically.
This paper was provided by the Policy Department for Economic,
Scientific and Quality of Life Policies at the request of the
committee on Economic and Monetary Affairs (ECON) ahead of
the Monetary Dialogue with the ECB President on 27 September
2021.
This document was requested by the European Parliament's committee on Economic and Monetary
Affairs (ECON).

AUTHORS
Kerstin BERNOTH, DIW Berlin
Gökhan IDER, DIW Berlin

ADMINISTRATOR RESPONSIBLE
Drazen RAKIC

EDITORIAL ASSISTANT
Roberto BIANCHINI

LINGUISTIC VERSIONS
Original: EN

ABOUT THE EDITOR
Policy departments provide in-house and external expertise to support European Parliament
committees and other parliamentary bodies in shaping legislation and exercising democratic scrutiny
over EU internal policies.

Policy Department for Economic, Scientific and Quality of Life Policies
European Parliament
L-2929 - Luxembourg
Email: Poldep-Economy-Science@ep.europa.eu

Manuscript completed: September 2021
Date of publication: September 2021
© European Union, 2021

This document was prepared as part of a series on "Inflation on the upswing - Just a hiccup or the
trend reversal after all?", available on the internet at:
https://www.europarl.europa.eu/committees/en/econ/econ-policies/monetary-dialogue

 Follow the Monetary Expert Panel on Twitter: @EP_Monetary

DISCLAIMER AND COPYRIGHT
The opinions expressed in this document are the sole responsibility of the authors and do not
necessarily represent the official position of the European Parliament.
Reproduction and translation for non-commercial purposes are authorised, provided the source is
acknowledged and the European Parliament is given prior notice and sent a copy.
For citation purposes, the publication should be referenced as: Bernoth, K. and Ider, G., Inflation on the
Upswing – Just a Hiccup or a Trend Reversal After All?, Publication for the committee on Economic and
Monetary Affairs, Policy Department for Economic, Scientific and Quality of Life Policies, European
Parliament, Luxembourg, 2021.
Inflation on the Upswing - Just a Hiccup or a Trend Reversal After All?

CONTENTS
LIST OF BOXES 4
LIST OF FIGURES 4
LIST OF TABLES 4
LIST OF ABBREVIATIONS 5
EXECUTIVE SUMMARY 6
 INTRODUCTION 7
 ECONOMIC SITUATION AND ECONOMIC SCOPE 10
 AGGREGATE DEMAND 13
 3.1. Pent-up consumption 13
 3.2. Fiscal stimulus 15
 SUPPLY SIDE CONSTRAINTS 19
 INFLATION EXPECTATIONS IN THE SHORT AND MEDIUM TERM 22
 CONCLUSION 27
REFERENCES 29

 3 PE 695.450
IPOL | Policy Department for Economic, Scientific and Quality of Life Policies

LIST OF BOXES
Box 1: Inflation uncertainty indicators 23

LIST OF FIGURES
Figure 1: Inflation developments in the euro area 7
Figure 2: Contributions of the major sectors to euro area headline inflation 8
Figure 3: Inflation (HICP) developments in the largest four economies 9
Figure 4: Slack in the euro area economy 10
Figure 5: Slack in the euro area labour market 11
Figure 6: Development of disposable income and savings 13
Figure 7: Saving dynamics of households during the COVID-19 crisis 14
Figure 8: Producer price inflation (excluding construction and energy) 19
Figure 9: Euro area consumer, producer and import price developments 20
Figure 10: IHS Markit euro area manufacturing PMI survey indexes 20
Figure 11: Inflation forecast and actual inflation 24
Figure 12: Probability of high and low inflation 25
Figure 13: Uncertainty measures 25

LIST OF TABLES
Table 1: Analysis of saving dynamics across different income quintiles in the euro area 15
Table 2: Discretionary fiscal packages of euro area countries 16
Table 3: Impact of budgetary fiscal measures of countries on euro area output 17

PE 695.450 4
Inflation on the Upswing - Just a Hiccup or a Trend Reversal After All?

LIST OF ABBREVIATIONS
AMECO Annual macro-economic database of the European Commission

ECB European Central Bank

EU European Union

GDP Gross domestic product

HICP Harmonised index of consumer prices

IMF International Monetary Fund

NAIRU Non-accelerating inflation rate of unemployment

NAWRU Non-accelerating wage rate of unemployment

NGEU Next Generation EU

OECD Organisation for Economic Co-operation and Development

RRF Recovery and Resilience Facility

SPF Survey of Professional Forecasters

VAT Value-added tax

SPF Survey of Professional Forecasters

 5 PE 695.450
IPOL | Policy Department for Economic, Scientific and Quality of Life Policies

EXECUTIVE SUMMARY
• After rising steadily since the beginning of the year, headline inflation in the euro area stood
 at 3% in August 2021, the highest level since the end of 2011. Much of this increase can be
 explained by temporary factors, such as the rebound in energy inflation and the withdrawal of VAT
 cuts.
• Inflation dynamics in the euro area Member States show a large degree of heterogeneity,
 especially if energy prices are not taken into account. Among the four largest economies,
 Germany tops the list in terms of rising core inflation, while Italy lags behind France and Spain.
• There are several factors that could put further upward pressure on headline inflation in the
 medium term, which should now be monitored closely.
• The unemployment gap in the euro area is almost closed. However, labour force participation
 fell sharply during the COVID-19 pandemic, so that the unemployment figures currently look too
 positive. When labour demand continues to rise as the economy recovers further, wage pressure
 should be noticeable but limited.
• Only part of the pandemic-related excess savings accumulated by euro area households will
 be released in the form of pent-up consumption; the impact on headline inflation will
 therefore be limited. The main reason is that majority of these excess savings are concentrated at
 high-income households, which have low levels of marginal propensity to consume. Instead, a not
 insignificant part of the impact of excess savings will be absorbed by asset price inflation.
• Fiscal stimulus measures will help close the massive output gap that opened up during the
 COVID-19 pandemic. Should the fiscal measures push output far beyond potential output, the rise
 in inflation could be quite sharp. However, this seems an unlikely scenario. It is more likely that
 these measures will temporarily raise core inflation moderately.
• Core producer price inflation, at 6.7% in August 2021, is higher than ever before in the
 history of the euro area, mainly due to global supply constraints. The impact on headline
 inflation is nevertheless likely to be limited, as services inflation remains in the euro area the
 dominant underlying dynamic for core inflation.
• An analysis of the ECB's Survey of Professional Forecasters (SPF) shows that the increase in
 inflation currently observed in the euro area has not yet had any impact on medium-term
 inflation expectations, which are still firmly anchored. The ECB thus enjoys a high degree of
 credibility.
• We conclude that there are several reasons why inflation in the euro area is likely to remain
 persistently high in the coming quarters, especially as all these effects are at work
 simultaneously. However, most of these effects are only temporary.

• The biggest risk for the further development of inflation is a rise in inflation expectations,
 and these should now continue to be monitored critically.

PE 695.450 6
Inflation on the Upswing - Just a Hiccup or a Trend Reversal After All?

 INTRODUCTION
The COVID-19 pandemic turned out to be an unprecedented shock to the euro area economy, resulting
in sharp contractions in aggregate demand and production. As consumption, employment and energy
prices declined significantly amid the lockdown restrictions in the spring of 2020, naturally, the fall in
inflation followed. The annual rate of change in the Harmonised Index of Consumer Prices (HICP)
dropped to 0.3% in April 2020 and remained around 0% until the end of 2020. After the near-0%
inflation episodes of 2009 and 2014-16, which were preceded by the Great Recession and the European
debt crisis, respectively, this was the third time headline inflation hovered around 0% for a considerable
timespan since 2006 (Figure 1). With inflation well below the inflation target and the real economy
collapsing in the wake of the pandemic, the European Central Bank (ECB) responded promptly by
further expanding its unconventional monetary policy measures, including its large-scale asset
purchase program. Governments in the euro area implemented various discretionary fiscal stimulus
packages that include additional government spending, tax and debt deferrals, liquidity provisions and
guarantees.
Figure 1: Inflation developments in the euro area

Source: ECB Statistical Data Warehouse.

January 2021 marked an end to the near zero inflation environment. Headline inflation in the euro area
rose by 1.2 percentage points month-on-month to 0.9% year-on-year. This spike was mainly due to
technical rather than economic reasons. As a part of their fiscal stimulus packages, several euro area
governments reduced the value-added tax (VAT) in mid-2020 until the end of 2020. The reversal of the
VAT rate cut in January 2021 is estimated to contribute to a rise in headline inflation by 0.4 percentage
points in the euro area (CaixaBank Research, 2021). It is important to note that the base effect of the
VAT cut has not yet fully materialised and could push inflation slightly up in the second half of 2021 as
well. Moreover, a significant change in the relative weights of the various components that form the
HICP has contributed to the rise in inflation at the beginning of 2021. Every year, Eurostat assigns
component weights that reflect the previous year's household consumption. Due to the exceptional
changes in consumption patterns since early 2020, the currently revised weights exhibit large shifts
across categories. Therefore, a change that typically has little impact on the headline inflation rate
caused an extra 0.3 percentage point spike in January 2021 and will continue to affect inflation rates
throughout 2021 (European Central Bank, 2021a). Finally, there was a delay and cancellation of the
typical retail discount sales in January. Its effect on inflation rates in 2021 was isolated to January, but

 7 PE 695.450
IPOL | Policy Department for Economic, Scientific and Quality of Life Policies

it is likely to push inflation down in January 2022, assuming that usual seasonal discounts will occur
that year. Thus, the rise in inflation that we saw at the very beginning of 2021 is largely due to technical
and one-off reasons and will therefore only be temporary.
However, in the course of the current year, the headline inflation rate has also continued to rise,
climbing up to 3% in August 2021, the highest level since the end of 2011. In contrast, the inflation rate
that excludes energy prices dropped in the same period from its highest level of 1.5% in January 2021
to just below 1% in July 2021 before jumping back up to 1.7% in August 2021 (Figure 1). Thus, the rise
in headline inflation is largely fueled by the rebound in energy inflation (Figure 2). Oil and gas prices
dropped sharply in early 2020, and then experienced a sluggish rise to their pre-pandemic levels by the
end of 2020. This culminated in a significant base effect on energy inflation that will push the headline
inflation rates up throughout 2021. However, its impact will mainly dissipate by the end of this year,
and, therefore, is also temporary.
Figure 2: Contributions of the major sectors to euro area headline inflation

Source: Eurostat.

It is noteworthy that considerable heterogeneity exists across inflation developments in the individual
economies. The standard deviation of inflation rates across euro area economies is currently at its
highest level since December 2010. Looking at inflation developments in the four largest economies of
the euro area, for example, we see that price increases in Italy have been very subdued in recent
months, while they have been particularly strong in Germany and Spain (Figure 3). Rebound in energy
inflation is the main factor behind the rapid rise in headline inflation in Spain. However, even when
energy prices are excluded, Germany is on an inflationary trend since April 2021. This large
heterogeneity in inflation developments does not only make it difficult for the ECB to pursue a uniform
monetary policy; it also explains why, despite inflation still being in line with the inflation target in the
aggregate 1, there is currently concern among the public and policymakers that inflation, at least in
some euro area countries, could rise above the desired level in the future.

1 It should be noted that the ECB has been aiming for a symmetric medium-term inflation target of 2% since its strategy review in July
 2021.This means that after a sustained period of below-target inflation, as has been the case in recent quarters, an overshooting of
 inflation above 2% will be accepted.

PE 695.450 8
Inflation on the Upswing - Just a Hiccup or a Trend Reversal After All?

Figure 3: Inflation (HICP) developments in the largest four economies

Source: ECB Statistical Data Warehouse.

Although the volatility in energy prices has lately been the major contributor to the movements of the
headline inflation rate in the euro area, there are additional critical factors for the short- to medium-
term inflation outlook. Domestic demand is viewed as the main driver of a potential robust recovery in
the euro area. It is expected that as lockdown restrictions are eased, aggregate demand, especially for
the services sector, will hike with the release of pent-up demand. The recent rise in global input costs
due to supply bottlenecks is another important inflationary force. Inflation expectations of households
and firms affect almost every aspect of the economy, from wage negotiations to consumption patterns,
rendering it yet another crucial factor for the development of inflation. The slack in the euro area
economy and the aggregate impact of the fiscal stimulus packages are also important determinants of
inflation. Apart from the economic factors, progress with vaccinations in developed and emerging
market countries, the emergence of the Delta variant and potential other variants are key to assess the
medium-term inflation outlook.
This paper takes a closer look at the above-mentioned factors affecting inflation over the short to
medium term. First, we examine the degree of capacity utilisation in the euro area economies. We then
analyse the extent to which inflationary pressures could arise from aggregate demand, which is likely
to be triggered by pent-up consumption and fiscal stimulus. Next, we examine the impact of supply-
side bottlenecks and pipeline pressures, which could affect headline inflation via producer inflation.
Finally, the development of inflation expectations derived from the Survey of Professional Forecasters
(SPF) and their anchoring in the ECB's inflation target are examined in detail.

 9 PE 695.450
IPOL | Policy Department for Economic, Scientific and Quality of Life Policies

 ECONOMIC SITUATION AND ECONOMIC SCOPE
Inflationary pressures are significantly influenced by the cyclical situation or the margin of slack of an
economy. The cyclical stance of an economy is often measured by the output gap, which is the
difference between actual output and potential output. When actual output rises above potential
output (positive output gap), upward pressure on factor costs increases, which ultimately results in
consumer price inflation. Alternatively, economic activity is estimated by the slack in the labour market.
During times of low slack, employers are competing over workers, and hence wages tend to rise. This
increase in firms' input costs is likely to translate into higher prices. Labour market slack is estimated
using the unemployment gap measure, which is the difference between actual unemployment and
structural unemployment rates. Generally, estimates for the non-accelerating inflation rate of
unemployment (NAIRU) and the non-accelerating wage rate of unemployment (NAWRU) are used as
proxies for the structural unemployment rate. An unemployment rate higher than the NAIRU indicates
slack in the labour market and the potential to expand employment without generating price increases
(Eurofound, 2017) 2.
The euro area economy has been operating near its potential since 2018 until the COVID-19 crisis shook
the world in early 2020. The sudden complete shutdown of the euro area economies in early 2020 and
the following lockdown restrictions led to sizeable falls in production and capacity utilisation (Figure
4). As a result, the output gap widened into negative territory to around -15% in the second quarter of
2020, which is 12 percentage points lower than the gap during the Great Recession 2008/09 and the
European debt crisis 2010-13.
Figure 4: Slack in the euro area economy

Sources: AMECO, IMF, OECD. Source: Bloomberg Economics.

To combat the deflationary pressure generated from this unprecedented fall in economic activity,
governments and the ECB reacted promptly with active and expansionary fiscal and monetary policy
measures. Although the largest four economies in the euro area still have substantial margins of slack,
the output gaps in Germany and France are recovering comparatively rapidly, whereas Italy and Spain
are still lagging behind. This is one of the main drivers of the divergence in headline inflation apart from
energy among these economies in 2021 (Figure 3). Current forecasts suggest that in major euro area

2 It is important to note that although both measures are commonly used, they are difficult to estimate and subject to significant margins
 of error since potential output and structural unemployment rates are unobservable variables. Therefore, estimates for slack in the
 economy vary across methods that estimate potential output and proxies for structural unemployment.

PE 695.450 10
Inflation on the Upswing - Just a Hiccup or a Trend Reversal After All?

countries' output gaps will be closed by the end of 2022 (ECB, 2021d; European Commission, 2021 and
DIW, 2021).
However, predictions about the further development of the output gap and therefore inflationary or
deflationary pressures are only possible with high uncertainty. The impact of the COVID-19 crisis on
production largely depends on the duration of the pandemic and restrictions, and there is considerable
uncertainty over short- and long-term forecasts as future economic policies play a key role. The growth
projections of potential output in the euro area remain well below the path suggested by pre-
pandemic projections. In the event of a longer than expected compression of the economies, not only
actual production but also potential output could fall. According to International Monetary Fund (IMF)
and ECB estimates, the loss in the level of potential output due to the COVID-19 crisis could approach
around 3% in 2021, which renders an assessment of inflationary pressures even more difficult and
uncertain (European Central Bank, 2020a). Depending on whether potential output falls by more than
actual output, this could even push up the output gap and induce inflationary instead of deflationary
pressures.
Figure 5: Slack in the euro area labour market

Sources: AMECO database (NAWRU), OECD (NAIRU and Sources: Bloomberg Economics, OECD (euro area),
 unemployment rate). authors' calculations.

Notes: Unemployment gap is computed as the difference between the actual unemployment rate and the NAIRU.

The substantial fall in the euro area output did not generate the expected proportional increase in the
unemployment rate, largely due to the job retention schemes introduced by the governments of euro
area Member States (Figure 5). Currently, the euro area unemployment gap is almost at its pre-
pandemic level—near zero—suggesting that the labour market is tight. In a tight labour market, it
would be expected that as lockdown restrictions are lifted and labour demand increases, wages and
thus prices will tend to rise. However, there are a few factors suggesting that this conclusion is likely to
be flawed. Brooks and Fortun (2020) show that the relationship between core inflation and the
consensus unemployment gap is weak in the euro area, especially in the peripheral regions. The COVID-
19 crisis caused a notable decrease in the labour force participation rate in the euro area, thus
suppressing the increase in the unemployment rate (European Central Bank, 2020b). Additionally,
employees who are supported by the short-work schemes had to reduce working hours, yet this
change is not reflected in the unemployment rate. These factors exacerbated the decoupling of
inflation and the unemployment gap, rendering any inference on inflation from the movements in the
unemployment gap even more challenging. Although an accurate quantitative analysis about how the

 11 PE 695.450
IPOL | Policy Department for Economic, Scientific and Quality of Life Policies

unemployment gap affects inflation is rather difficult, it could be argued that wages might rise in the
second half of 2021 as labour demand increases and supply remains subdued. However, this effect is
likely to be temporary as supply will catch up with demand when job retention schemes and pandemic-
related transfers come to a halt. We therefore conclude that if the economy continues to recover, wage-
induced inflationary pressures are likely to be noticeable but limited.

PE 695.450 12
Inflation on the Upswing - Just a Hiccup or a Trend Reversal After All?

 AGGREGATE DEMAND
3.1. Pent-up consumption
The saving rate in the euro area experienced a sharp increase in 2020Q1, and rose to an unprecedented
level of 25% in 2020Q2 as the first COVID-19 pandemic-related restrictions came into effect. Although
the saving rate has declined slightly since then, it currently remains at a historically high level that
clearly exceeds the saving rates observed during the Great Recession 2008/09 and the European
sovereign debt crisis 2010-13. This hike was mainly fueled by collapsing consumption rather than
fluctuations in disposable income, suggesting that the resulting excess savings were largely
involuntary as lockdown restrictions inhibited households' ability to spend in sectors like hospitality,
transport and recreation. The fall in disposable income was limited because governments stepped in
massively to offset the pandemic-related decreases in households' primary incomes (Figure 6).
Figure 6: Development of disposable income and savings

 1900 26

 Gross disposable income (left axis)

 Final consumption expenditure (left axis) 24
 1800
 Saving rate (right axis)

 22
 1700

 20

 1600
 Billions of Euros

 18

 (%)
 1500

 16

 1400
 14

 1300
 12

 1200 10
 2007 2008 2009 2010 2011 2012 2013 2014 2015 2016 2017 2018 2019 2020 2021

Sources: ECB Statistical Data Warehouse, authors' calculations.

Domestic demand in the euro area is expected to be the key driver of the post-pandemic recovery. We
estimate that these excess savings, defined as the savings in excess of what would have been saved in
normal times, amount to nearly EUR 650 billion up until 2021Q2, which is almost equivalent to the
current output gap of 5% (Figure 5a) 3. Aggregate demand is expected to rise once further pandemic-
related restrictions have been lifted. However, the impact of pent-up demand on inflation depends
heavily on how much of the excess savings households have accumulated since the beginning of 2020
will be spent in the coming quarters.

3 We carried out a counterfactual analysis for the no-pandemic scenario to estimate gross excess savings. First, we assumed that the saving
 rates during 2020Q1-2021Q1 would be equal to the average saving rate in the euro area in 2019. Then, we calculated the amount of gross
 savings using the extrapolated saving rate and the actual gross disposable income during 2020Q1-2021Q1. Finally, we calculated the
 excess savings as actual gross savings minus the no-pandemic counterfactual gross savings for the period 2020Q1-2021Q1. There is no
 available data for 2021Q2. It should be noted that the accuracy of this analysis heavily depends on the extrapolated saving rate, and the
 average saving rate for 2019 is chosen as the no-pandemic counterfactual saving rate to consider the slight uptick in the saving rate of
 households since 2018.

 13 PE 695.450
IPOL | Policy Department for Economic, Scientific and Quality of Life Policies

Figure 7: Saving dynamics of households during the COVID-19 crisis

(a) Savings in the euro area (b) Change in the euro area saving
 rate compared to 2019Q4

 500 16
 Gross savings
 Involuntary savings
 No-pandemic counterfactual 14
 Precautionary savings
 450
 Other effects
 12

 400 10

 8
Billions of Euros

 350

 %
 6

 300 4

 2
 250
 0

 200 -2
 18Q1 18Q3 19Q1 19Q3 20Q1 20Q3 21Q1 20Q1 20Q2 20Q3 20Q4 21Q4

 Sources: ECB Statistical Data Warehouse, Source: ECB Economic Bulletin Issue 5, 2021.
 authors' calculations.

(c) Allocation of the extra savings in the euro area (compared to the saving rate in 2019Q4)

Source: ECB Economic Bulletin Issue 5, 2021.
Notes: The no-pandemic counterfactual in Figure 7a is calculated by extrapolating the average saving rate in 2019 and then
 multiplying it by the disposable income in 2020Q1-2021Q1.

The largest share of excess savings was involuntary due to pandemic-related restrictions and not
precautionary due to high macroeconomic uncertainty during the pandemic. However, the longer the
pandemic lasted, the larger the share of excess savings is held in illiquid rather than liquid assets (bank
deposits) (Figure 7b, Figure 7c). This suggests that even if pandemic-related restrictions continue to be
lifted, households will not deplete all of their savings. Moreover, it also matters in which income and
wealth groups these excess savings are concentrated. Using data from Eurostat's 2015 experimental
statistics on the share of disposable income and the median saving rate for each income quintile, we
calculate the share of savings for different income groups (Table 1) 4. We find that in normal times, more
than 80% of gross savings are accumulated in the top two income quintiles. This is in line with the
findings of the European Commission that a large share of pandemic-related excess savings is
concentrated in high-income households (European Commission, Economic and Financial Affairs,
2021). Since high-income households' marginal propensity to consume is significantly lower than that

4 The data is not provided for the euro area as a whole, therefore a weighted average of the variables is taken using the HICP country
 weights provided by Eurostat. A potential caveat of the analysis is that that there is no data for Italy, but we do not expect that including
 Italy would change the main finding as the share of disposable income and median saving rate are not highly heterogenous across euro
 area Member States.

PE 695.450 14
Inflation on the Upswing - Just a Hiccup or a Trend Reversal After All?

of middle- and low-income households, we expect that only part of the pandemic-related excess
savings will be released in the form of additional consumption and that the impact on headline
inflation will be limited (Drescher et al., 2020 and Fisher et al., 2020). Instead, a not insignificant part of
the impact of excess savings will be absorbed by asset price inflation.
Table 1: Analysis of saving dynamics across different income quintiles in the euro area
 Share of
 Median saving Share of savings
 Income quintile disposable
 rate ( %) (%)
 income (%)
 1 7.5 -5.2 -1.4
 2 12.8 13.5 6.3
 3 17.5 21.6 13.9
 4 23.4 29.6 25.3
 5 38.8 39.4 55.9
Sources: Eurostat experimental statistics (2015), authors' calculations.

3.2. Fiscal stimulus
Euro area countries implemented extensive discretionary fiscal stimulus packages to combat the
detrimental impact of the COVID-19 pandemic on their economies. These packages are mainly
constructed to support the firms and workers in sectors that were the most affected by pandemic-
related restrictions. The fiscal instruments included in these packages are largely the same across euro
area countries. They consist of budgetary measures (short-time work schemes, support to firms and
households, public spending and investment, tax and social contribution cuts, tax deferrals) and
liquidity support measures (loan guarantees, additional loans).
The budgetary measures in the fiscal stimulus packages of euro area countries amount to nearly EUR 1
trillion (8-9% of 2020 GDP) 5. In addition to individual countries' fiscal programs, the European Union
(EU) announced its landmark instrument for the recovery phase from the COVID-19 crisis, the Recovery
and Resilience Facility (RRF), as a component of the Next Generation EU (NGEU) program. The RRF will
provide grants to euro area countries totaling EUR 338 billion and loans totaling EUR 390 billion at
current prices (Bruegel, 2021). The euro area's fiscal policy response to the crisis is on a scale that far
exceeds even the discretionary fiscal measures taken during the Great Recession.
In addition to discretionary fiscal measures, euro area countries also took extensive liquidity support
measures, which played an essential role in keeping small and medium-sized enterprises afloat and
maintaining employment under pandemic-related constraints. The four largest economies, i.e.,
Germany, France, Italy and Spain, by far exceeded the size of budgetary measures in percent of GDP
(Table 2). However, it should be noted that more than 90% of these liquidity measures is in the form of
loan guarantees, so that the bulk of this fiscal support will not be reflected in the public budgets in the
end.

5 Calculations of DIW Berlin based on IMF database of country fiscal measures in response to the COVID-19 pandemic.

 15 PE 695.450
IPOL | Policy Department for Economic, Scientific and Quality of Life Policies

Table 2: Discretionary fiscal packages of euro area countries

 Budgetary measures
 Liquidity support (% of 2020 GDP)
 (% of 2020 GDP)
 Additional spending Equity
 Contingent liabilities
 and foregone revenues Accelerated injections,
 spending / loans, asset
 Non- deferred purchase, Quasi-
 Health Subtotal
 Subtotal health revenue debt Guarantees fiscal
 sector
 sector assumptions operations

 Germany 11.0 1.2 9.8 27.8 3.0 24.8
 France 7.6 0.8 6.8 3.1 15.6 0.9 14.7
 Italy 8.5 0.6 7.9 0.4 35.3 0.2 35.1
 Spain 7.6 1.3 6.3 14.4 0.1 13.4 0.9
The Netherlands 4.5 0.7 3.8 1.6 8.2 8.2
 Belgium 8.0 1.8 6.2 3.0 11.8 0.2 11.6
 Austria 11.7 0.6 11.1 2.4 2.4
 Portugal 5.4 0.9 4.5 0.5 5.7 5.7
 Greece 13.7 0.5 13.2 0.6 3.9 2.1 1.8
 Finland 2.5 0.8 1.7 0.9 7.5 0.7 5.1 1.7
 Ireland 9.0 1.2 7.8 0.7 1.9 0.8 1.1
Source: IMF Database of Fiscal Policy Responses to COVID-19 (announced measures as of April 2021).
Notes: The countries listed in the table amount to 97% of euro area GDP.

To assess the impact of the liquidity-protecting measures on the economy and thus on inflation, a
counterfactual analysis would be needed to examine how many companies would have exited the
market in the absence of these measures. This is beyond the scope of this paper. Therefore, we focus
on the expected impact of budgetary measures on inflation, as their direct contribution to economic
growth can be estimated using previously estimated fiscal multipliers. However, since there is no
single, universal multiplier, it is not possible to make a precise statement. The multipliers differ for
government spending, tax cuts, subsidies and transfers. Moreover, they vary widely over time and
depend heavily on the state and characteristic of the economy. For instance, government spending
multipliers tend to be higher during times of economic slack (recessions) and at the zero-lower bound
(Blanchard et al., 2015). They also depend on the public debt level and macroeconomic uncertainty and
have positive spillover effects across countries. (Pappa, 2020) Finally, the magnitude of the fiscal
multiplier during the COVID-19 crisis may be different from that of previous recessions and crises
simply because the pandemic had an unprecedented impact on the economy. Our overview analysis
of the impact of stimulus packages on economies is therefore based on certain assumptions and can
only be considered as a rough proxy.

PE 695.450 16
Inflation on the Upswing - Just a Hiccup or a Trend Reversal After All?

Table 3: Impact of budgetary fiscal measures of countries on euro area output

 Implied effects on output
 Program spending Multiplier estimates
 (in EUR bn and % of potential GDP)
 estimate (EUR bn)
 Low Medium High Low Medium High
 1071.5 0.5 1.5 2.5 535.8 1607.3 2678.8
 4.7 14.1 23.5
Sources: IMF Database of Fiscal Policy Responses to COVID-19, authors' calculations.
Notes: The estimates for the range of the aggregate fiscal multiplier for the euro area come from an intensive literature
 review (see footnote 6). The implied effects on output are calculated by multiplying the fiscal multiplier with the
 aggregate program spending. The program spending estimate includes all the budgetary fiscal stimulus measures
 announced by euro area countries listed in Table 1 until April 2021. AMECO estimate for euro area potential GDP in
 2021 is used here.

To calculate the aggregate effect of discretionary budgetary policies of euro area countries on
economic growth, we conduct a literature review estimating the size of fiscal multipliers 6. For the fiscal
spending multipliers, we only consider the estimated multipliers in recessions and at the zero interest
rate bound. Although fiscal multipliers vary widely across euro area countries and depend on various
economic factors, we make the simplifying assumption of a single fiscal multiplier for the euro area.
Table 3 shows the range of the estimated cumulative fiscal multiplier after two years under the
assumptions mentioned above as well as the corresponding stimulus on economic growth. The latter
is calculated by multiplying the fiscal multiplier by the sum of the euro area countries' program
expenditures through April 2021, as listed in Table 2. The cumulative multiplier is defined as the
cumulative change in GDP divided by the cumulative change in government consumption (as a
percentage of GDP). For example, a value of 1.5 would indicate that, after two years, the cumulative
increase in output, in euro terms, is one and a half the size of the cumulative increase in government
consumption.
It is reasonable to assume that the effect of social distancing during the COVID-19 pandemic
attenuated the fiscal multiplier. Thus, assuming that the multiplier during the recovery from the COVID-
19 pandemic tends to be between the low end of 0.5 and the medium value of 1.5 — which is the most
realistic scenario in our opinion — output would increase between EUR 540 billion and around EUR
1,600 billion over the next two years. This corresponds to about 5% to 14% of potential GDP. In light of
the fact that the output gap was at around -15% in 2020Q2 (Figure 4), the discretionary fiscal stimuli
would thus help to close the gap, but not push it into positive territory. However, in the unlikely case
that the multiplier is at the upper limit of 2.5, the cumulative impact on output after two years would
be EUR 2,679 billion, or around 24% of potential GDP. In this case, output would be driven far beyond
potential output.

6 Fiscal multipliers for government spending: Blanchard and Leigh (2013) report 1.5 for the euro area, Blanchard, Erceg and Linde (2015)
 report 2 for the aggregate euro area, Amendola et al. (2019) report 1 in normal times and 1.6-2.8 at the zero-lower bound in the euro area,
 Ramey (2019) report 0.3-2.0 from various different studies, Burriel et al. (2010) report 0.85 for the euro area. Fiscal multipliers for taxes:
 Guajardo et al. (2014) report 1 for a panel of OECD countries, Hayo and Uhl (2014) report 1 for Germany, Burriel et al. (2010) report 0.5,
 Coenen et al. (2012) report 0.15-0.4. Fiscal multipliers for transfers: Coenen et al. (2012) report 0.2-0.6 for general and around 2 for targeted
 transfers, Parraga Rodriguez (2016) report 0-1 for the euro area.

 17 PE 695.450
IPOL | Policy Department for Economic, Scientific and Quality of Life Policies

Let us assume that the expected increase in the output gap is linear over the eight quarters. This would
mean that the output gap increases by 0.6 percentage point and 1.8 percentage point per quarter on
average in the low and medium fiscal multiplier scenarios, and by 2.9 percentage points on average in
the case of a fiscal multiplier at the upper end of the estimated range. According to the euro area
Phillips curve estimates of Ball and Mazumder (2020), this would lead to an increase in annual core
inflation of about 0.5 and 1.4 percentage point in the low and medium multiplier scenario and 2.3
percentage points in the high multiplier scenario, respectively.
Thus, we conclude that the stimulus packages of the individual euro area countries help close the
massive output gap that opened up during the COVID-19 pandemic. However, in the event that the
fiscal measures push output far above potential output, the rise in inflation could be rather strong. But
this seems the unlikely scenario; it is more likely that core inflation will be raised moderately by these
measures. Moreover, as these fiscal stimulus measures are time-limited, headline inflation can be
expected to rise only temporarily — provided that inflation expectations remain anchored despite now
rising inflation, which we will discuss in more detail in chapter 5.
However, it is not only discretionary fiscal measures at the individual country level that have the
potential to boost economic growth in euro area countries — so does the EU's medium-term stimulus
package NGEU, including the RRF. To date, euro area Member States have requested about EUR 400
billion in grants and loans from this facility, with spending to be spread over six years (Bruegel, 2021).
Watzka and Watt (2020) estimate that the overall impact of the increase in public investment financed
by the RRF will be rather small for the euro area. GDP would increase by only 0.3 percentage points, so
the impact on inflation is likely to be small.

PE 695.450 18
Inflation on the Upswing - Just a Hiccup or a Trend Reversal After All?

 SUPPLY SIDE CONSTRAINTS
Producer prices in the euro area have risen rapidly since the beginning of 2021. Although the rebound
in energy price inflation is an important component of this increase, the rapid rise in core producer
prices (excluding energy and construction) shows that there must be other important factors
explaining this surge (Figure 8). Supply shortages of raw materials and intermediate products, surging
commodity price inflation and unprecedented rises in shipping costs are the main drivers of this
substantial increase in euro area core producer prices. Such factors, which exert price pressures on
firms' inputs in the early stages of the production and distribution chain (pipeline pressures), may
eventually affect the prices of consumer goods, albeit usually with a lag. Thus, underlying supply-side
developments in core producer prices are crucial for an assessment of the medium-term inflation.
Figure 8: Producer price inflation (excluding construction and energy)
 8

 Euro area

 6 Germany

 France

 Italy
 4
 Spain

 2
 Annual percentage change

 0

 -2

 -4

 -6
 2006 2007 2008 2009 2010 2011 2012 2013 2014 2015 2016 2017 2018 2019 2020 2021

Sources: Eurostat, Bloomberg.

The component of consumer price inflation most likely to reflect the rise in core producer prices is the
HICP for non-energy industrial goods (NEIG). It has not picked up so far in 2021 while both producer
and import prices for intermediate goods have risen rapidly (Figure 9). However, this lag in the pass-
through of pipeline pressures is normal, as production is generally not instantaneous in one step. The
pass-through is expected to be through producer prices and import prices for intermediate goods,
which affect producer prices for non-food consumer goods and, depending on retail and distribution
margins, eventually consumer prices for non-energy industrial goods. Against this background, it is
important to note that producer price inflation for non-food items rose to almost 2% in July 2021, up
from just 0.6% in February. Our correlation analysis suggests that producer price inflation for
intermediate goods is generally most closely related to producer price inflation for non-food goods,
with a lag of 6-8 months (0.76 on average), while the lag for import price inflation for intermediate
goods is 8-11 months (0.73 on average). In turn, the increase in producer prices for non-food items is
most strongly associated with consumer prices for industrial goods excluding energy, with a lag of 7-8
months (0.52 on average) 7.

7 A simple correlation analysis is conducted for the euro area using monthly data from 2002 to 2019. While this simple analysis cannot
 reveal a precise timeline for the pass-through of pipeline pressures to consumer prices as it does not control for demand-side factors and
 major global economic developments, it does indicate the process takes substantial time.

 19 PE 695.450
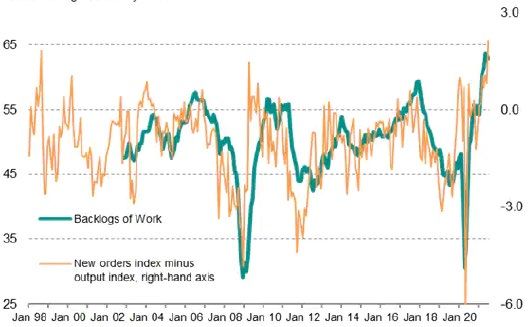
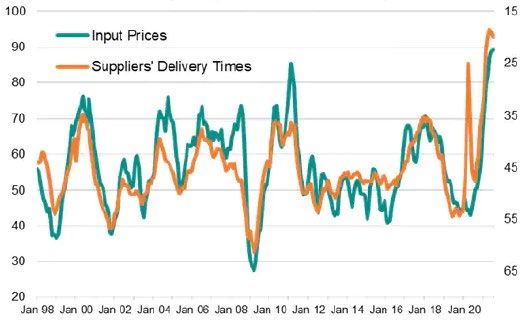
IPOL | Policy Department for Economic, Scientific and Quality of Life Policies

Figure 9: Euro area consumer, producer and import price developments

 14

 HICP (non-energy industrial goods)
 12
 PPI (excluding energy and construction

 PPI (intermediate goods)
 10
 PPI (non-food consumer goods)

 8 Import prices (intermediate goods)

 6
 Annual percentage change

 4

 2

 0

 -2

 -4

 -6
 Jan 2018 Jul 2018 Jan 2019 Jul 2019 Jan 2020 Jul 2020 Jan 2021 Jul 2021

Sources: Eurostat, ECB Statistical Data Warehouse.

The speed and level of this pass-through to consumer prices depend on many factors, particularly on
the duration of such pipeline pressures and firms' willingness to absorb the increase in input costs by
suppressing profit margins 8. Profit margins have shown a relatively high degree of resilience during
the COVID-19 crisis, mostly due to the positive impact of job retention schemes (European Central
Bank, 2021b). Therefore, the end of job retention schemes and wage increases can potentially
accelerate the pass-through of pipeline pressures, albeit with limited impact if supply-side constraints
disappear to some extent by then.
Figure 10: IHS Markit euro area manufacturing PMI survey indexes
 (a) Euro area manufacturing sector backlogs of work (b) Euro area manufacturing sector input prices (left
 scale) and supply delays (right scale, inverted)

Source: IHS Markit (2021a)
Notes: For the backlogs of work index, new orders index, output index and input prices index, readings of 50 indicate no
 change in the indicators on the prior month, readings above 50 indicate an increase and readings below 50 indicate
 a decrease. Readings of the suppliers' delivery times index below 50 indicate that it is taking longer for suppliers to
 hand over goods to factories, on average. The index is hence inverted to show the strong correlation between supply
 conditions and input price trends in the manufacturing sector.

8 Share of long-term pricing contracts, high proportion of fixed prices, stock of inventories, capacity utilisation and the competitive
 environment are also important factors (European Central Bank, 2021c).

PE 695.450 20
Inflation on the Upswing - Just a Hiccup or a Trend Reversal After All?

As the pandemic-related restrictions started to ease in May 2021, the baseline expectation was that
supply disruptions would be resolved towards the end of 2021, and hence, production would catch up
with the surging demand. Although this scenario is still possible, its likelihood has weakened
considerably. The July 2021 data from the manufacturing Purchasing Managers' Index (PMI) survey
from IHS Markit show that euro area manufacturers and their suppliers are still struggling to increase
production capacity fast enough to meet demand. New orders exceed production in the euro area
manufacturing sector to an unprecedented extent in the survey's history, and backlogs of work are thus
increasing rapidly without losing steam (Figure 10a). Survey respondents cite supply delays and
material shortages as the main reasons why euro area manufacturers cannot further increase
production capacity (IHS Markit, 2021a). Suppliers' delivery times index and euro area PMI input price
index are both at record-high levels, although their rates of increase finally showed signs of slowing
down in July 2021 (Figure 10b). While this could indicate positive developments for euro area
production capacity, emergence of the Delta variant exacerbated containment measures in many
countries and led to notable falls in the manufacturing sector in July 2021, particularly in the Asia-
Pacific region. This lack of production in key Asian countries is likely to once again hit the manufacturers
in the euro area and generate higher input prices (IHS Markit, 2021b).
We conclude that there are still very many uncertainties surrounding the evolution of key supply-side
factors that will determine how global pipeline pressures will affect euro area inflation. According to
the ECB (2021c), the impact of a strong spillover of pipeline pressures to NEIG inflation on overall euro
area inflation should nevertheless be limited, as services inflation remains the predominant underlying
dynamic for core inflation (with a weight of about two-thirds in the core HICP). Nevertheless, global
supply-side developments should be closely monitored by policymakers to keep inflation on track,
especially at a time when actual euro area inflation rates are exceeding expectations month after
month.

 21 PE 695.450
IPOL | Policy Department for Economic, Scientific and Quality of Life Policies

 INFLATION EXPECTATIONS IN THE SHORT AND MEDIUM TERM
Especially in periods of rising inflation, as is currently the case, inflation expectations need to be
carefully monitored. The development of inflation expectations and their anchoring are of great
importance for the further development of actual inflation, as the expected inflation rate feeds into
companies' wage and price decisions as well as households' consumption and investment decisions.
Temporary deviations in the actual inflation rate are acceptable as long as the expected inflation rate
in the medium term is consistent with the objective of price stability. In the case of the euro area, the
inflation target was defined as just below 2% in the medium term until July 2021, which could be
redefined as a target corridor of 1.7% and 1.9% 9. Since then, the ECB aims for a symmetrical medium-
term inflation target of 2%, which means that negative and positive deviations of inflation from this
target are now equally undesirable. Inflation expectations are anchored to a large extent by credible
central bank monetary policy. Conversely, a significant deviation of the expected inflation rate from
the target rate signals that confidence in the central bank's ability to fulfil its mandate is declining.
The trend in inflation expectations is reflected in detail in the Survey of Professional Forecasters (SPF).
Since 1999, the ECB has been surveying around 60 participants on a quarterly basis to obtain their
assessment of inflation developments over the next one to five years. The experts are each asked for
their point forecast, i.e., their inflation expectation expressed as a single number, as well as for the
probabilities with which inflation lies within certain predefined intervals. This survey approach exploits
the fact that the average of independent expert forecasts is a good estimator of future developments
(Surowiecki, 2004). In this section, we primarily analyse inflation expectations with a forecast horizon
of one and two years, which corresponds to the definition of the short and medium term. However, we
will also briefly outline the results for the inflation forecasts for the next four and five years 10.
The SPF allows us to analyse not only the point forecasts but also the density forecasts (histogram) of
the individual experts, the latter being the basis for the construction of uncertainty measures. We
derive three different measures of forecast uncertainty from the individual density forecasts of survey
respondents (see Box 1 for a more detailed overview). First, static uncertainty, which measures the
average variance of the individual probability distributions at a given time. Second, to measure how
much the individual experts' point estimates vary over time, we calculate the average of the standard
deviations of the individual point estimates over a rolling two-year window (dynamic uncertainty). And
third, we calculate a measure that focuses on the cross-sectional dispersion of point forecast, measured
as the average standard deviation of the experts' point estimates at a given time (disagreement) 11.

9 See ECB (2003), "Press Seminar on the Evaluation of the ECB's Monetary Policy Strategy - Transcript of Questions and Answers". The fact
 that the ECB's inflation target is defined in terms of its inflation expectations is made clear by the statement of Otmar Issing, former Chief
 Economist of the ECB: "(...) this 'close to 2%' is not a change, it is a clarification of what we have done so far, what we have achieved -
 namely inflation expectations remaining in a narrow range of roughly 1.7% and 1.9% - and what we intend to do in our forward-looking
 monetary policy".
10 Four calendar years ahead for surveys conducted in the Q1 and Q2 rounds, and five calendar years ahead for surveys conducted in the
 Q3 and Q4 rounds.
11 All three measures require to address the open-ended lower-end and upper-end intervals in the SPF questionnaire. We follow Andrade
 et al. (2012) and close the open intervals by assuming that they have a width of twice the length of the closed intervals.

PE 695.450 22
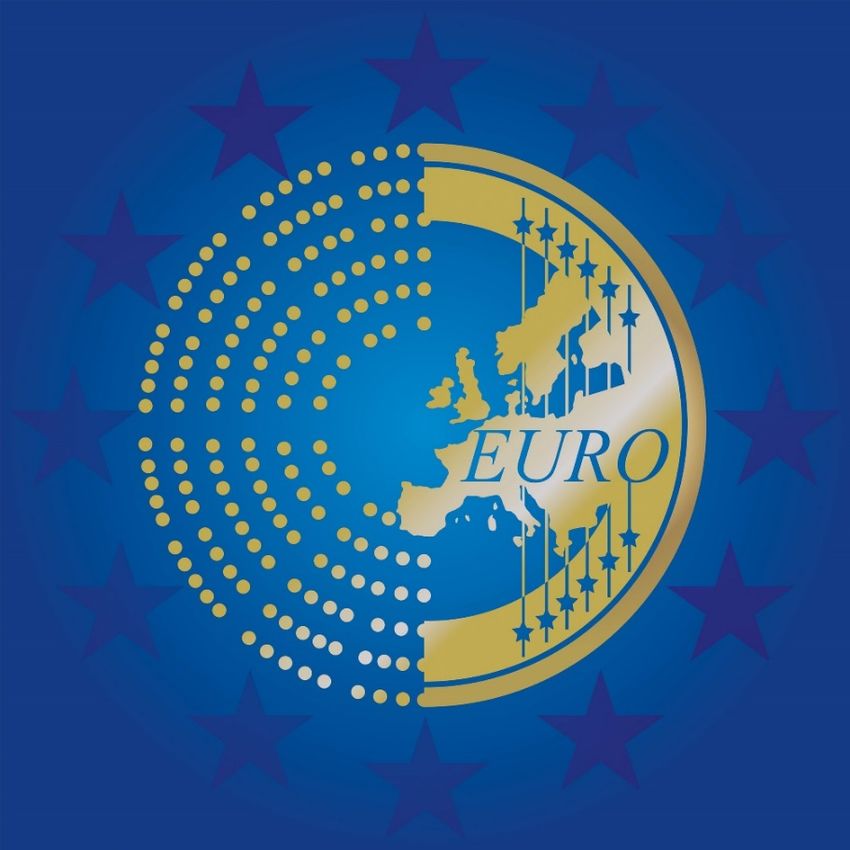
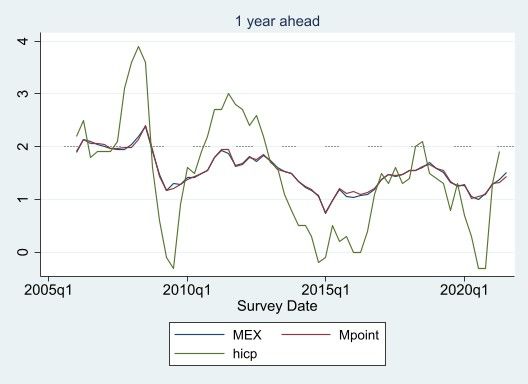
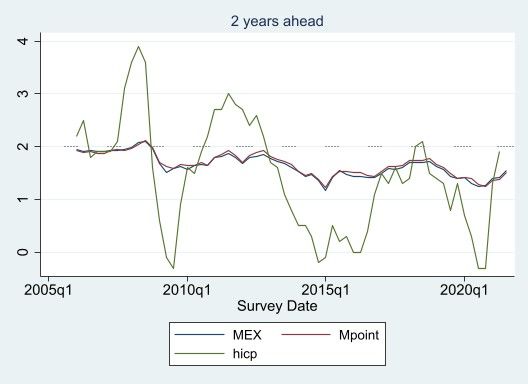
Inflation on the Upswing - Just a Hiccup or a Trend Reversal After All?

Box 1: Inflation uncertainty indicators

 Based on the results of the SPF, a quarterly survey of around 60 participants conducted by the
 ECB since 1999, statistical uncertainty factors can be calculated. Let n denote the number of
 experts surveyed. Expert i specifies a probability whith which he expects inflation to be at
 time t in interval k.
 Static uncertainty:
 Static uncertainty θt is equal to the square root of the average variance σ2i of the individual
 probability distributions at a given time:
 1

 = � ∑ =1

 2 , = 1, … , .

 When the individual probability distribution is broadly spread on average, the general
 uncertainty about the expected level of inflation is high. If the probability distribution is very
 narrow, uncertainty is generally low.
 Dynamic uncertainty:
 The dynamic uncertainty measures the average standard deviation of the experts' point
 estimates � over a two-year time window:
 3
 1 1
 = � � � ( � + − � )2 � , = 1, … ,
 8
 =1 =−4

 where � denotes the average point estimate of an expert i. This indicator shows how much the
 experts' point estimates fluctuate over a two-year horizon. If the indicator is low, the experts'
 inflation expectations are relatively stable.
 Disagreement:
 The disagreement measures the average standard deviation of the point estimates � at a
 given time:

 = �1/ �( � − � )2 , = 1, … ,
 =1

 where � is the midpoint of the aggregate probability distribution and thus indicates the
 average inflation forecast of all experts. The further apart the experts' inflation forecasts, the
 higher the disagreement and the larger the indicator. The advantage of this measure over the
 ordinary standard deviation is that it corrects for the presence of outliers in the inflation survey—
 that is, overly positive or negative inflation forecasts.

Source: Authors' elaboration.

Figure 11 shows that the mean inflation forecast (MEX) calculated from the individual experts'
probability distributions deviates only marginally from the average point inflation estimate across all
experts (Mpoint). It can be seen that one-year-ahead inflation expectations exhibit somewhat higher
volatility than two-year-ahead inflation forecasts. However, the pattern and the level are very similar.

 23 PE 695.450
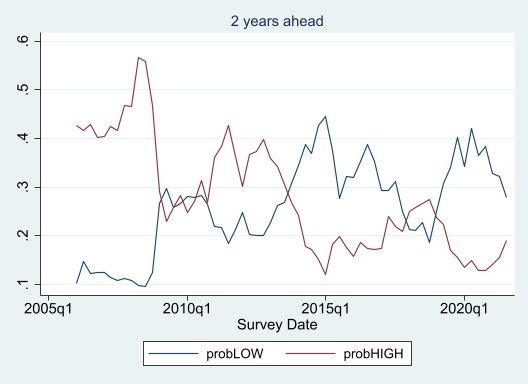
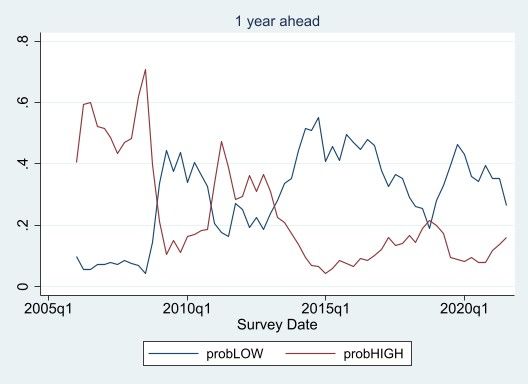
IPOL | Policy Department for Economic, Scientific and Quality of Life Policies

Since the outbreak of the global financial crisis in 2008Q4, average expected inflation has been
continuously below 2%. Despite an ultra-loose monetary policy, survey expectations for one- and two-
year inflation were, with few exceptions, even consistently below the ECB's target range. While inflation
expectations rose slightly after the announcement of an expanded asset purchase program in the first
quarter of 2015, they started to decline again in 2019, almost reaching the 2015Q1 low of around 1%
at the end of 2019. Since then, inflation forecasts have been continuously increasing again, but with
around 1.5% in 2021Q3, are still well below the inflation target of 2%. Looking at inflation expectations
for the next four to five years, we find that long-term inflation expectations exhibit extremely low
volatility, with mean inflation expectations of around 1.8%, confirming that expectations are firmly
anchored, especially in the long run.
Figure 11: Inflation forecast and actual inflation

Source: Survey of Professional Forcasters (ECB); Calculations of DIW Berlin.
Notes: MEX denotes the average inflation forecast calculated from the individual experts' probability distributions, Mpoint
 the average point inflation estimate across all experts and hicp depicts the actual harmonized index of consumer
 prices at the survey date.

Figure 12 shows the average probability with which the experts expect inflation to deviate upward
(>2% - probHIGH) and downward (
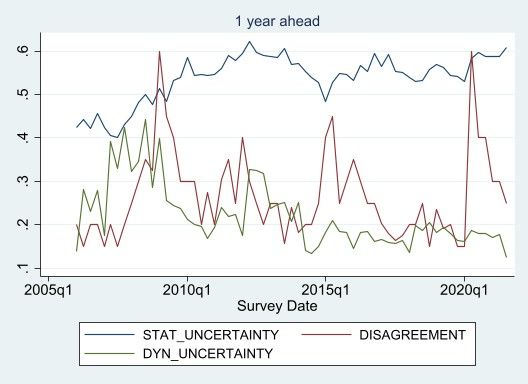
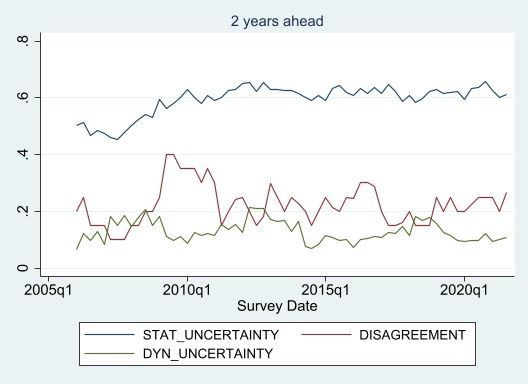
Inflation on the Upswing - Just a Hiccup or a Trend Reversal After All?

Figure 12: Probability of high and low inflation

Source: Authors' elaboration.

Figure 13 shows the evolution of our three measures of uncertainty over time. It is striking that
uncertainty in all three dimensions is much more volatile when it comes to inflation in one year than to
inflation in two years. This suggests that inflation expectations are much more anchored in the medium
term than in the short term, which in principle expresses a high degree of credibility of the ECB.
It can be seen that disagreement among respondents increases markedly in times of crisis. Similar to
the situation during the global financial crisis between the fall of 2008 and the end of 2009,
respondents' assessments of how inflation will evolve in the next year diverged widely in the first wave
of the COVID-19 pandemic. A high degree of disagreement suggests that the decisions (on prices,
wages, consumption) of individual economic agents in the euro area may also diverge considerably.
Different inflation forecasts may also reflect regional differences, making it increasingly difficult for the
ECB to define a uniform and optimal monetary policy for the euro area as a whole. In contrast,
dispersion of expert assessments of inflation in the medium-term did not increase significantly during
the COVID-19 crisis. This suggests that this crisis was expected to affect the economy primarily in the
short run.
Figure 13: Uncertainty measures

Source: Authors' elaboration.

 25 PE 695.450
IPOL | Policy Department for Economic, Scientific and Quality of Life Policies

The situation is different with regard to the uncertainty surrounding individual inflation forecasts (static
uncertainty). Since the outbreak of the global financial crisis, the average dispersion of expectations has
increased and since remained at a higher level. Compared with before the crisis, the surveyed experts
thus consider a significantly wider range of future inflation rates to be possible. The pandemic, by
contrast, does not appear to have had any significant impact on this uncertainty.
In contrast, uncertainty about expected inflation in the next year of the individual experts (dynamic
uncertainty) has tended to decline on average over time since its peak during the global financial crisis,
reaching a similarly low level as uncertainty about inflation in two years. This means that the experts
surveyed are currently revising their inflation expectations over time less frequently than they did
during or before the financial crisis. This development reflects the success of a forward guidance-
oriented communication strategy of the kind used by the ECB since July 2013: it was designed to reduce
economic agents' uncertainty about future monetary policy decisions by providing explicit forward
guidance. And even this uncertainty measure has not noticeably increased during the current COVID-
19 pandemic.
In summary, the increase in inflation currently observed in the euro area has not yet had any impact on
inflation expectations in the medium term and this aspect is not yet exerting any significant inflationary
pressure. Only with regard to the development of inflation in the short term has the disagreement of
expert assessments increased, which is likely to be due more to the high level of uncertainty
surrounding the course of the pandemic than to the credibility of the ECB.

PE 695.450 26
You can also read