Does financial globalization uncertainty affect CO2 emissions? Empirical evidence from some selected SSA countries
←
→
Page content transcription
If your browser does not render page correctly, please read the page content below
QFE, 5(2): 247–263.
 DOI: 10.3934/QFE.2021011
 Received: 04 January 2021
 Accepted: 30 March 2021
 Published: 06 April 2021
http://www.aimspress.com/journal/QFE

Research article

Does financial globalization uncertainty affect CO2 emissions?
Empirical evidence from some selected SSA countries

Ibrahim Sambo Farouq1,*, Nuraddeen Umar Sambo2, Ali Umar Ahmad3, Aminu Hassan
Jakada4 and Isma’il Aliyu Danmaraya5

1
 Faculty of Business Management, Universiti Sultan Zainal Abidin, Terengganu, Malaysia
2
 Development Impact Evaluation, World Bank, Nigeria
3
 Faculty of Maritime Management, Universiti Malaysia Terengganu, Malaysia
4
 Faculty of Art and Social Science, Federal University Dutse, Nigeria
5
 American University of Nigeria, Nigeria

* Correspondence: Email: ibrahimumms@gmail.com; Tel: +601159773562.

Abstract: Based on the Environmental Kuznets’s Curve theory, this study seeks to investigate the
asymmetric relationship between the financial globalization uncertainty and the environmental quality
alongside the test of Kuznets’s hypothesis. The research covers the data set of nine Sub Saharan African
countries from 1980−2019. The Kuznets’s hypothesis of the relationship between economic growth and
the environment quality has been validated, identifying the pivotal point of the relationship’s transition.
The results further reveal that the positive shock of FGU is inversely related to CO2 emissions, implying
that as the foreign capital flow increases, the accompanying CO2 emissions decreases. Whereas, the
negative decomposed component of the financial globalization uncertainty indicates a negative and
significance coefficient. While, renewable energy reduces the deterioration of the environmental quality.
In the last part of the study, policy implications are recommended accordingly.

Keywords: environmental Kuznets curve; panel NARDL model; environment quality; financial
development

JEL Codes: F64, F65

248

1. Introduction

 Productivity growth has generally increased as a result of the globalization phase, and financial
development which has been quite effective in the productivity growth process is also experiencing a
positive nod following the economic globalization (Erdogan et al., 2020). However, rapid
manufacturing and financial growth have contributed to the increase in energy use and emissions
respectively. As such, primary energy use as at 2018 rose in by 2.9 percent, almost twice its estimated
10-year annual average rate of 1.5 percent (BP, 2019). In addition, a dramatic rise in greenhouse gas
(GHG) emissions has been caused by recent increases in global energy usage (Danish et al., 2020). In
2018, levels of atmospheric carbon dioxide (CO2) increased by 2.0% and reached 33,890 million tons,
marking the highest growth in the last seven years (BP, 2019). CO2 emissions that account for 65% of
GHG emissions have been caused by the use of fossil fuels and industrial activities (Intergovernmental
Panel on Climate Change IPCC, 2014). Many studies have concentrated on the impact of globalization,
economic growth, and financial progress on environmental quality because of the declining ecosystem
and growing knowledge of improving and preserving environmental quality. Globalization refers to
the financial openness and economic reforms element that increases the attractiveness of large inflows
of foreign direct investment-related research and development (Dauvergne, 2008).
 The manufacturing sector has been the major engine of economic growth in many nations since
the early 19th century’s Industrial Revolution. The use of machinery and technical inputs in the
manufacturing process has contributed to a remarkable and significant shift in the economic
interactions between people in formerly agricultural societies, leading in exponential rapid economic
development. Industrial economic development, however, has generated problems with environmental
deterioration, and the convergence of industrial processes has been a significant contributor to climate
change. The average world temperature rose by almost 0.87 °C first from late nineteenth century, but
as per the 2018 report of the international panel on climate change (IPCC), meanwhile climate and
environmental extremes were found to occur more strongly amid the rise in world temperature by
0.5 °C. These issues are exacerbated by anthropogenic greenhouse gases that have socioeconomic and
ecological effects in the form of more vague weather, increased severity of catastrophic events, severe
drought in many areas, sea level rise due to the melting of polar ice caps, proliferation and extinction
of many living organisms, and impairment of human health (IPCC, 2018).
 Global warming is one of the big challenges in today’s environment that has the ability to ruin
sustainable productive capacity in both developing and developed nations. The environmental
emission of carbon dioxide and other greenhouse gases is the primary cause for climate change. These
greenhouse gases contribute to global warming, and the atmosphere across the globe is affected by
global warming. Therefore, understanding the driving forces of CO2 emissions is important. Our study
aims to evaluate the determinants of CO2 emissions, and special interest is given to the level of global
financial uncertainty. carbon emissions are closely linked to industrial development and fossil fuel
burning (Grossman and Krueger, 1991). Earlier studies have suggested that income (usually calculated
by the per capita gross domestic product) has a major effect on environmental quality (Kuznets, 2019).
However, income can reduce the amount of environmental pollution in developing countries, as health
and other problems that may be more essential than the rate of per capita income or economic strength
may be regarded by policymakers in these nations. In addition, emissions of the atmosphere and
greenhouse gases, contributing to anthropogenic climate change, are affecting sustainable economic
development in both developed and emerging economies. A greater number of per capita income or

Quantitative Finance and Economics Volume 5, Issue 2, 247–263.
249

productivity expansion would increase the carbon emissions intensity. However, as per capita GDP
grows, policy makers should be more concerned about carbon emission. Policymakers should have a
more environmentally friendly manufacturing process at this point, and this systemic transformation
would reduce the rate of growth of Carbon emission. This viewpoint was modelled by Grossman and
Krueger (1991); Al-Mulali et al. (2015) as the environmental kuznets curve (EKC). The empirical
findings revealed that large economic output would cause the amount of greenhouse gas emissions to
increase until a developed country has a particular per capita GDP level.
 At this stage, we include the level of global financial uncertainty as a new driving factor of CO2
emissions in these selected SSA countries. In other words, we extend the EKC model with the FGU
and address a possible omitted variable bias. Indeed, researchers have indicated that uncertainty
decreases investments (Ozturk et al., 2020; Özokcu and Özdemir, 2017; Atasoy, 2017). The waves of
uncertainty regarding CO2 emissions, however, seem to be ignored by empirical literature. We propose
that uncertainty about financial globalization can have a negative or positive impact on the process of
carbon emission in an open economy. Our hypothesis is driven by the fact that an open economy
comprises of energy-intensive commodity use and expenditure in energy. At this point, a higher level
of FGU could lead to a decline in energy usage and pollution-intensive goods, thereby reducing CO2
emissions as FGU increases.
 Unrestrained international capital flows are core aspects of the present international economic
market, the so-called Dollar-Wall Street regime. To the Us dollar which is at the forefront of the
international currency hierarchy (Gowan, 1999), but also to certain nations that have a high place
within the world currency hierarchy, the structure offers a huge advantage to capitalist core countries,
especially to the USA. In order to enforce conditionality on nations, external debt and financial
dependence are central points of entry. Conditionality also demands that nations be more open to
international investment and financial flows, and that public infrastructure and natural wealth be
privatized, thus reducing the national policy capacity (Soederberg, 2014). Moreover, debt and fund
investment flows appear to increase uncertainty and financial crisis vulnerability (Bortz and
Kaltenbrunner, 2018).
 Trans-border foreign investment to developing economies, like green finance, are also
particularly problematic against the backdrop of a developmentalist outlook, leading to uncertainty
and a net outflow of wealth from the center to the core countries. Moreover, they will promote access
to and enhance the transfer of domestic environmental assets to the world’s core nations. This
eliminates external vulnerability and potentially promotes strategies of productive (green) aggregation.
Since CO2 is really the main greenhouse gas released from human activities, responsible for 76% of
the total carbon emissions (IPCC, 2014), several research efforts anchored on the principle of the EKC
used Carbon emissions as the variable that indicates the extent of environmental harm, such as in the
studies of Atasoy (2017); Sinha and Shahbaz (2018). Some studies in the past have shown that the
concentration of CO2 is a result of several factors besides sales and productivity expansion. As
domestic credit improves financial access for businesses with a mission to build environmentally
sustainable technologies or to manufacture environmentally friendly goods, it helps to minimize
potential deterioration of the environment.
 On the contrary, financial development would increase CO2 emissions by itself in favor of
economic growth (Shahbaz et al., 2013; Pata, 2018). In addition, the industrialization of the national
economy has been found to increase CO2 emissions either directly or indirectly due to the use of energy
in the additive manufacturing process and the intensive use of energy in other fields following the

Quantitative Finance and Economics Volume 5, Issue 2, 247–263.
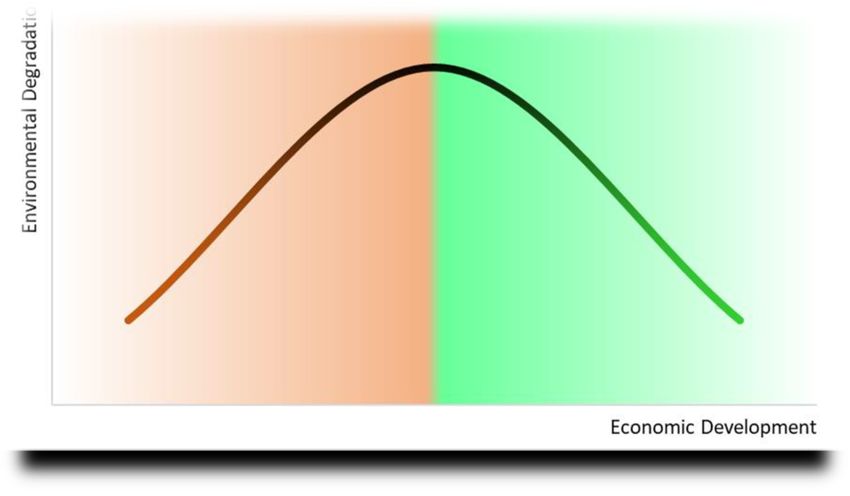
250

process of economic growth and urbanization (Liu and Bae, 2018). Moreover, as foreign investors
transfer global capital into those economies, the degree of financial expansion rises. The influence of
financial globalization uncertainty towards environmental degradation in the case of developing
economies deserves a significant research interest, more especially the selected SSA countries.
 Consequently, the primary aim of this research is to investigate the effect of the financial
globalization uncertainty in relation to carbon emissions. Nine SSA countries have been chosen for the
data analysis, including the Congo Republic, Zimbabwe, Botswana, Kenya, Nigeria, South Africa,
Sudan, Togo, and Senegal. Furthermore, the study provides a clearer understanding whether or not the
various socio-political backgrounds and economic systems of the various countries or economic blocks
have ramifications for the functioning of the EKC and the association between productivity growth
and the environmental quality. In addition to checking the validity of the EKC hypothesis, this research
also has a secondary objective of evaluating the effects of other variables on the level of CO2 emissions
beyond economic growth. By so doing, this study uses the nonlinear pool mean group model to test
the EKC hypothesis, as it can directly capture the nonlinear relationship between instability of financial
globalization, economic growth, renewable energy and environmental quality. This asymmetric nature
of the study coupled with its uniqueness in terms of financial globalization uncertainty determinant to
CO2 emissions makes the current study different from the previous studies.
 This article is organized into six sections. Section 1 is the introduction that provides the context
and sense of the environmental analysis. The EKC literature, related research, and the factors
influencing the levels of CO2 emissions are discussed in Section 2 and the EKC theory is defined. The
definition of the regression model is dealt with in section 3. The data and variables used in the analysis
are explained in Section 4. The main study findings are presented in Section 5. Section 6 gives
conclusions and recommendations.

2. Related theory and research works

2.1. The environmental kuznets curve (EKC) hypothesis

 Figure 1. The environmental Kuznets’s curve.

Quantitative Finance and Economics Volume 5, Issue 2, 247–263.
251

 The theory of the environmental Kuznets’s curve describes an inverted U-shaped association
between economic growth and environmental destruction (Figure 1), environmental contamination
pressure rises in the early phases of growth due to excessive pollutants and the widespread and intense
use of natural resources coupled with increased utilization of production resources up to a particular
stage, as revenue increases; and afterwards, it declines, perhaps due to the increasing public
consciousness and concern with regards to environmental destruction and the efforts of research and
development are more geared towards the idea of the green economy as production increases at a
greater extent (Stern, 2004; Kaika and Zervas, 2013).

2.2. Literature review

 In recent years, scholars have drawn attention to the association between the growth of the
financial sector and environmental deterioration. Many studies show strong evidence that finance
induces increased greenhouse gas emissions (Cetin et al., 2018a; Paramati et al., 2018; Ali et al., 2019;
Dar and Asif, 2017; Xing et al., 2017; Javid and Sharif, 2016; Charfeddine and Khediri, 2015). Firstly,
the growth of the stock exchange would help listed firms strengthen their funding sources, decrease
financing costs, reduce operational risk, make new projects, and thereby maximize the use of energy
and CO2 emissions. Secondly, financial expansion could increase environmental emissions by
increased amounts of foreign direct investment inflows. Eventually, the country’s developed financial
system makes the country more attractive to the foreign investors, and the influx of these foreign
investors are usually associated with increased productions that results to higher rates of carbon
emissions. This is because studies have shown that most of the foreign investors prefer investing in
these developing countries because of their weak environmental regulations (Raza & Shah, 2018).
 On the other hand, some studies have observed that financial development increases the energy
output and productivity of the sector, thereby significantly reducing energy use and emissions of
carbon dioxide (Saud et al., 2019; Ghorashi and Rad, 2018; Dogan and Seker, 2016; Al-mulali et al.,
2015; Salahuddin et al., 2015). In addition, Katircioğlu and Taşpinar (2017) documented a
unidirectional causality in the context of Organization for Economic Cooperation and Development
economies between financial development and carbon emissions. The results of Zaidi et al. (2019)
verified the Cooperation Countries’ bidirectional causality between financial development and
environmental quality in Asia Pacific. In much the same vein, Farhani and Ozturk (2015) discovered
a unidirectional causal relationship between financial development and carbon emissions for Tunisia.
And Zafar et al. (2019) discovered a unidirectional relationship between greenhouse gases and
financial development for OECD economies.
 There is a correlation between CO2 emissions and economic growth. Studies have shown that as
a nation experiences productivity growth in the early phases of economic progress, carbon emissions
increase, but decrease after achieving a certain degree of economic prosperity (Charfeddine and Mrabet,
2017; Ahmad et al., 2017; Al-Mulali et al., 2015). However, earlier studies identify the relationship
between sustainable growth and environmental degradation as conflicting, such as a report by Yeh &
Liao (2017) for Taiwan, Boufateh (2019) for the United States, Ma and Jiang (2019) for China, Aye
and Edoja (2017) for 31 developed countries and Acheampong (2018) for 116 economies across the
world found that CO2 emissions declined with an increase in the productivity growth. Similarly, Ozcan
(2013) also offers some support for the reduction in carbon emissions with an increase in actual per
capita GDP. However, Omri et al. (2015) and Charfeddine and Mrabet (2017) for MENA countries,

Quantitative Finance and Economics Volume 5, Issue 2, 247–263.
252

Begum et al. (2015) for Malaysia, Ahmad et al. (2017) for Croatia, Dong et al. (2018) for China, and
Al-Mulali et al. (2015) for Vietnam among others have demonstrates that an uptick in economic
activity is capable of rising energy consumption and thereby exacerbating CO2 emissions.
 Amidst the context of rising worries about global warming, the role of renewable energy in the
battle against pollution has been thoroughly examined in different countries and regions. Yet another
literature stream including Lin and Zhu (2019); Danish et al. (2019); Hanif et al. (2019); Nathaniel and
Iheonu (2019); Chen et al. (2019); Dong et al. (2018); Pata (2018); Zambrano-Monserrate et al. (2018);
Sinha and Shahbaz (2018); Liu et al. (2017); Zoundi (2017); Shahbaz et al. (2017); Al-Mulali et al.
(2016); Bilgilli et al. (2016); Ben Jebli et al. (2016); Sugiawan and Managi (2016); Al-Mulali et al.
(2015a); Bölük and Mert (2015) have shown inconclusive results. Most of the studies have found
renewable energy to play a positive role in fostering economic growth and improving the atmosphere by
mitigating CO2 emissions through the use of green energy. Destek and Sinha (2020) conducted one of
the uncommon and most recent studies that recognizes ecological footprint as the dependent variable for
verifying the reliability of the EKC hypothesis for 24 nations exploiting panel data from 1980 to 2014 in
the Organization for Economic Co-operation and Development economies. The research used
econometrics estimation approach such as panel mean-group (MG), FMOLS-MG and Dynamic
Ordinary Least Squares-MG estimators to determine the regressor coefficients, acknowledging panel
heterogeneity. The approximate coefficients invalidate the reliability of EKC in the panel.
 The scientific exercise, however, supports the emission-mitigating effect of renewable energy by
triggering an EF downward wave. Non-renewable energy was, however, found to produce an upsurge
in EF. An analytical exercise was initiated by Danish and Ulucak (2020) to assess the feasibility of the
Ecological Footprint derived EKC model employing panel data for the BRICS nations over the year
1992 to 2016. By integrating green energies, urbanization and environmental resources rent, the
authors increased the EKC base model. For the data estimation, dynamic panel estimation techniques
such as FMOLS and DOLS estimators were used. The result confirmed the involvement of the EKC
in the BRICS. Renewable technology has also been found to have an inhibitory impact on the
environmental footprint. Alola et al. (2019a) adds to the scientific literature on the role of green energy
as its main indicator in enhancing environmental sustainability, taking into account the ecological
footprint. They perform a panel analysis using data from 16 European Union countries for the year
1997 to 2014 and examine them with the introduction of the Pooled Mean Group regression technique.
The outcomes of the research confirm the beneficial role of renewable energy, assessed by EF, in the
environmental protection.

3. Methodology

3.1. Data description

 In this study, we use the data on metric tons per capita to measure CO2 emissions (Farouq and
Sulong (2021b); Dabachi et al., 2020; Jakada et al., 2020a; Jakada et al., 2020b; Jakada Mahmood and
Ahmad, 2020), meanwhile the measure of financial globalization uncertainty as widely used by Ahmad
et al. (2018); Danlami et al. (2018); Farouq et al. (2020); Farouq and Sulong (2021a) among others to
the FGUit-1 that represents the lagged one period of foreign direct investment inflows. With the actual
values of the residuals obtained by regressing the FDII on its lagged value with a time trend refers to
the volatility of the financial globalization, while economic growth is measured using real GDP

Quantitative Finance and Economics Volume 5, Issue 2, 247–263.
253

(Farouq et al., 2020; Farouq and Sulong, 2020a; Farouq et al., 2021), finally the Renewable energy is
the natural log of percentage share of renewable energy in aggregate final energy usage. The study is
based on the panel dataset that covers the year from 1980 to 2019. The data for all the concern variables
have been sourced from the world development indicator (2021).

3.2. Methodology and model specification

 The objective of this paper is to analyze the possible asymmetric linkage between financial
globalization uncertainty and quality of environment in nine selected sub-Saharan African countries
by focusing on one main research objective: does the financial globalization uncertainty
asymmetrically sensitive to the quality of environment? The econometric framework is based on the
stochastic properties and the heterogeneity of the data analyzed. For that purpose, the Pesaran’s (2007
and 2006) unit root test that considers cross-sectional dependence and allows testing for heterogeneity
are presented. Secondly, after testing for unit root, the symmetric cointegration test is implemented
(Westerlund, 2007). Thirdly, we present in vivid details the estimation technique namely the nonlinear
panel PMG model.
 The financial development-CO2 emission relationship is traditionally explored in previous
research using the auto-distributive lag model (ARDL) cointegration study of ordinary time series
approaches and the conventional PMG for panel results followed by Granger’s modelling error
correction (EC) and causality. However, the aforementioned econometric methods allow the
evaluation of the presence of long-run relationships followed by short-run interactions, while the
linkage between finance and environmental quality is symmetrical. Over this, they are not sufficient
to obtain asymmetries of imaginable variables. Via the use of the Nonlinear Pooled Mean Group
(NPMG) method developed by (Shin et al., 2014), this research then explores the short-term as well
as the long-term asymmetric relation between financial globalization uncertainty and environmental
quality, with positive and negative partial sum decompositions of the explanatory variable. This
approach has the value of separating the explanatory factors under review between short-term and
long-term asymmetric reactions to adjustments in environmental emissions. In this variable’s
logarithmic transition, the shift in the variable being evaluated is defined as the first variation. The
asymmetric relationship of cointegration can be expressed as follows:
 0 , , , (1)
 All the variables are transformed into logarithmic form. The log-linear functional form of the
empirical equation is as follows:
 0 (2)
where CO2 is carbon emissions representing the quality of environment, FGU specifies financial
globalization uncertainty, GDP denotes economic growth, RWE illustrates renewable energy, and =
( 1, 2, 3, 4+, 5−) is a vector of unknown parameters.
 We build the nonlinear panel ARDL model of Shin et al. (2014) in panel term, which is really a
nonlinear reflection of the hierarchical heterogeneous data panel model suitable for large T panels. We
have followed this method for three reasons. Firstly, it helps the study to capture nonlinear asymmetries.
Secondly, it accounts for the intrinsic variability impact of the results as we have seen for the financial
globalization uncertainty. Third, it is more fitting if there is an existence of a unit root or a mixed

Quantitative Finance and Economics Volume 5, Issue 2, 247–263.
254

convergence order of not more than I (1). Asymmetric panel ARDL in contrast to the symmetrical
scenario, this variant of the panel ARDL, referred to as the nonlinear panel ARDL, allows for an
asymmetrical reaction of the global financial shocks to the environmental quality. In other words, in
this case, positive and negative changes are not supposed to have the same effect on environmental
quality. Thus, the asymmetrical variant of the Equation (3) expressed below:

 ∆ 0 1 ∅ ∆

 ∑ ∆ ∆ (3)

where and shows the positive and negative financial globalization uncertainty shocks
respectively. These shocks are respectively computed as positive and negative partial sum
decompositions of financial globalization changes.

4. Empirical results

4.1. Descriptive summary

 Table 1 presents a brief description of stats and a list of correlations. The distributions of all
variables are greatly skewed, and the kurtosis values suggest that the distributions of the sequence are
more clustered with longer tails than the normal distribution form. On the other hand, the
correspondence equation indicates that there is a positive link between CO2 and FGU, RNWE and CO2,
and CO2 and GDP. Such relationships are merely a reflection of the potential relationship between the
entire variables.
 Table 1. Descriptive statistics.
 LCO2 LFGU LGDP LRNWE
Mean 1.523 13.253 15.227 16.064
Std. Dev. 1.018 12.805 5.058 2.105
Skewness −2.271 1.516 1.075 0.503
Kurtosis 7.538 5.025 2.610 1.820
 Correlation Matrix
 LC02 LFGU LGDP LRNWE
LCO2 1.000
LFGU 0.279* 1.000
 (0.000)
LGDP 0.096* 0.145* 1.000
 (0.000) (0.000)
LRNWE 0.053* 0.231* 0.237* 1.000
 (0.000) (0.000) (0.000)

Quantitative Finance and Economics Volume 5, Issue 2, 247–263.
255

4.2. Unit root

 When using panel data for the multivariate cointegration test and the NARDL panel estimation
model, this study carried out a unit root test to assess if the data sets are stationary. The findings of the
evaluation are presented in Tables 2, (CIPS and CADF). It can be said that all panel variable series of
all parameters are stationary at the first difference, as the resulting p-values are less than 0.05, leading
to the dismissal of the null hypothesis that the variable is non-stationary or holds a unit root. Therefore,
the panel dataset of this study can be used for panel PMG estimation.

 Table 2. Panel unit root test.

 Variables CIPS CADF
 At level At first different At level At the first diff
 LC02it −1.317 −5.280* −0.530 −5.372*
 (0.000) (0.000) (0.000) (0.000)
 LFGUit −1.853 −5.341* −0.822 −5.042*
 (0.000) (0.000) (0.000) (0.000)
 LGDPit −0.729 −5.214* −1.084 −6.241*
 (0.000) (0.000) (0.000) (0.000)
 LRNWEit −1.680 −5.230* −0.836* −5.279*
 (0.000) (0.000) (0.004) (0.000)
*Notes: *, ** and *** Denotes rejection of the null hypothesis at 1% and 5% and 10% significance level.

4.3. Co-integration

 We use the cointegration method introduced by Westerlund (2007) to explore the existence of
long-term relationships within variables in this study. Westerlund’s error-correction approach (2007)
is stated as follows:
 (4)
 (5)

where 1, . . . , and 1, . . . , represent the cross-countries and time period of the data. The
k-dimensional vector denotes the independent variables and is cited as stochastic. The scalar
break dummy represented by such that 1 and zero otherwise. Also, and
denotes the cross-unit specific intercept and slope coefficient before the break, while and
 represent the change in these parameters after the break. And i are represented as an error
term with mean zero and independent across. We present the co-integration result using
Westerlund panel approach in Table 3 below. Considering the p-values of both the panel and time
series of the co-integration result that shows significance at 1 percent, we therefore reject the null
hypothesis of no co-integration and accept the alternate hypothesis of long-run relationship among
the scrutinized variables.

Quantitative Finance and Economics Volume 5, Issue 2, 247–263.
256

 Table 3. Heterogeneous Co-integration tests.

 with trend without trend
 Statistic Value p-value Value p-value
 Westerlund Gt −3.208* 0.000 −3.342* 0.000
 Ga −12.147* 0.035 −11.521* 0.000
 Pt −10.075* 0.000 −9.105* 0.000
 Pa −11.095* 0.000 −18.433* 0.000
*Note: ** and * means the null hypothesis rejection of no cointegration at 5% and 1% levels of significance.

4.4. Estimation

 In this section, we present the summary result of the estimation as highlighted in the table 4. In the
long run, the positive shock in foreign capital flows exhibit a negative link with CO2 emissions. Findings
implying that further development in capital flows will increase the demand for renewable energy use and
subsequently result to improved quality of environment. Such that, a 1-unit increase in financial
globalization uncertainty reduces carbon emissions within a range of 42 percent. This is in line with
Qamruzzaman and Jianguo (2020); Hübler and Keller (2010); Wang (2009); Ayanwale (2007). Following
that, foreign capital flows in developing economy accelerate economic growth with technological
advancement, industrialization, infrastructural development, and higher production possibilities for
domestic trade expansion, thereby assist effectively to retain energy efficiency and control greenhouse gas
emission with the application of advanced technological transfer. On the other hand, negative shocks in
foreign capital flows show a negative link with CO2 emissions. Which implies that there would be a
reduction in renewable energy consumption as a result of limiting foreign capital flow, which in turn
increase CO2 emissions (Sinani and Meyer, 2004; Carkovic and Levine, 2005; Lall, 2002). More precisely,
a 1% decline in financial globalization uncertainty will increase CO2 emissions by 22 percent.
 Meanwhile, GDP and CO2 appear to be positively related by 33 percent. This can be substantiated
by Rafindadi and Ozturk (2017). As expected, the GDP square turns out to be negative and statistically
significance by 25 percent. The findings validate the environmental Kuznet curve hypothesis (Ozturk
et al., 2020; Jakada et al., 2020; Kaika and Zervas, 2013). Likewise, the renewable energy indicates a
negative and significance relationship towards CO2 emissions by 39 percent (Crestanello, 2020).
Whereas, the result is contrary to the findings of Adedoyin et al. (2020) and Dogan and Ozturk (2017).
 Positive and negative shocks of financial globalization uncertainty in the short run, however,
increases and decreases the sum of CO2 emissions depending on the positive or negative
decompositions, thereby worsening or improving the environmental efficiency. Whereas, the GDP as
well upsurge environmental degradation in the state of short term, while the corresponding GDP square
as well as renewable energy shrinks the carbon emissions in the short run.
 We also observed in both the long and short run the presence of asymmetric effect running from
financial globalization uncertainty to environmental quality of the selected SSA countries. Finding
reveal that any observed change in financial globalization uncertainty, would have the definitive
significance effect on the quality of environment.

Quantitative Finance and Economics Volume 5, Issue 2, 247–263.
257

 Table 4A. Short run panel NARDL.

 Variable Coefficient Estd.Error z-Statistics
 −0.502* 0.158 −3.177
 −0.324* 0.051 −6.353
 0.308* 0.085 3.624
 −0.402* 0.094 −4.277
 −0.345* 0.105 −3.286
 ect −0.621* 0.128 −4.852
 Symmetry test
 3.432*
 Log Likelihood 279.692

 Table 4B. Long run panel NARDL.

 Variable Coefficient Estd.Error t-Statistics
 −0.425* 0.102 −4.167
 −0.221* 0.042 −5.261
 0.334* 0.082 4.073
 −0.257* 0.068 −3.779
 −0.395* 0.098 −4.030
 Symmetry test
 2.346**

5. Conclusion

 This study evaluates the relationship between financial globalization uncertainty, economic
growth, renewable energy and environmental degradation for over the year 1980 to 2019 period for 9
selected sub-Saharan African economies, including Congo Republic, Zimbabwe, Botswana, Kenya,
Nigeria, South Africa, Sudan, Togo and Senegal. For the analysis, the research uses nonlinear panel
PMG estimation regression model. We are able to validate the environmental Kuznets curve hypothesis
which shows that the relationship between productivity growth and the environmental quality goes in
favor of the hypothesis, demonstrating that as these countries’ economic growth once attain a certain
level and increase beyond that point, it then forces a decrease in the environmental degradation.
 The study further found asymmetric relationship between financial globalization uncertainty and
environmental quality. The result indicates that, while considering the positive shock, as foreign capital
flow increases the linkage turns out to be inverse, which means that the corresponding CO2 emissions
goes down. And a possible explanation to this decrease could be linked to the fact that more inflows
of foreign capital are usually accompanied by foreign technology, which on the other hand increase
the use of renewable energy and subsequently results to a decline in the environmental deterioration.
While on the other hand, the negative decomposed variable of the financial globalization uncertainty
as well shows a negative relationship, implying that when there is shortage in the foreign capital flows,
there is every possibility of having increased deterioration of the environment. This follows that, these
sampled countries are characterized with under developed financial system (Ochere et al., 2017), as
such efficient resource allocation and the monitoring of the used production machines are usually

Quantitative Finance and Economics Volume 5, Issue 2, 247–263.
258

ineffective, and that contributes to the use of heavily emitted machines, hence environmental
deterioration. Similarly, the p-value of the renewable energy shows that the variable is as well
significance and the negative sign of its coefficient indicates an inverse relationship with respect to the
environmental degradation. Showing that, as the use of renewable energy increase, the corresponding
CO2 emissions decreases.

6. Policy recommendations

 Taking into account the finding that global financial uncertainty may encourage investment in
economic activities that generate emission-free goods due to the use of modern technology, therefore,
financial institutions should offer priority to credit provision for investment in the use and production
of clean and green technologies, maybe by offering lower interest rates on environmental agreements.
As these countries continue to diversify their economies with increasing production contributing to
high CO2 emissions, policies should be enacted to motivate more activities in the tertiary sector, such
as services and finance, or to encourage the adoption of clean and environmentally friendly
technologies by the secondary industry. In essence, to achieve economic and environmental
sustainability, green financing is an environmentally sustainable approach. Finally, it has been found
that supporting renewable energy provides benefits to the climate. Science and technological
advancement are also vital for the production of clean energy sources and associated infrastructure.

7. Limitation of the study and suggestions for future studies

 The limitation of the current study is not far from the fact that this research considers only few
out of the top leading Sub-Saharan African countries, and this is due to the data availability limitation.
But, for future studies, they might consider using more countries with few years’ coverage, since data
is available for recent years. In addition, other advanced heterogeneous econometrics techniques can
be considered, like DCCE, CCE etc.

Conflict of interest

 The authors declare no conflict of interest.

Reference

Acheampong AO (2018) Economic growth, CO2 emissions and energy consumption: What causes
 what and where? Energy Econ 74: 677–692.
Adedoyin FF, Gumede MI, Bekun FV, et al. (2020) Modelling coal rent, economic growth and CO2
 emissions: does regulatory quality matter in BRICS economies? Sci Total Environ 710: 136284.
Adedoyin F, Ozturk I, Abubakar I, et al. (2020) Structural breaks in CO2 emissions: Are they caused
 by climate change protests or other factors? J Environ Manage 266: 110628.
Ahmad M, Khan Z, Ur Rahman Z, et al. (2018) Does financial development asymmetrically affect
 CO2 emissions in China? An application of the nonlinear autoregressive distributed lag (NARDL)
 model. Carbon Manage 9: 631–644.

Quantitative Finance and Economics Volume 5, Issue 2, 247–263.
259

Ahmad N, Du L, Lu J, et al. (2017) Modelling the CO2 emissions and economic growth in Croatia: is
 there any environmental Kuznets curve? Energy 123: 164–172.
Ali R, Bukhsh K, Yasin MA (2019) Impact of urbanization on CO2 emissions in emerging economy:
 Evidence from Pakistan. Sust Cities Society 48: 101553.
Al-Mulali U, Tang CF, Ozturk I (2015) Estimating the environment Kuznets curve hypothesis:
 evidence from Latin America and the Caribbean countries. Renew Sust Energy Rev 50: 918–924.
Al-Mulali U, Saboori B, Ozturk I (2015) Investigating the environmental Kuznets curve hypothesis
 in Vietnam. Energy Policy 76: 123–131.
Alola AA, Bekun FV, Sarkodie SA (2019) Dynamic impact of trade policy, economic growth, fertility
 rate, renewable and non-renewable energy consumption on ecological footprint in Europe. Sci
 Total Environ 685: 702–709.
Atasoy BS (2017) Testing the environmental Kuznets curve hypothesis across the US: Evidence from
 panel mean group estimators. Renew Sust Energy Rev 77: 731–747.
Ayanwale AB (2007) FDI and economic Growth: Evidence from Nigeria. African Economic
 Research Consortium Paper 165, Nairobi.
Aye GC, Edoja PE (2017) Effect of economic growth on CO2 emission in developing countries:
 Evidence from a dynamic panel threshold model. Cogent Econ Financ 5: 1379239.
Baloch MA, Ozturk I, Bekun FV, et al. (2021) Modeling the dynamic linkage between financial
 development, energy innovation, and environmental quality: Does globalization matter? Bus
 Strat Environ 30: 176–184.
Begum RA, Sohag K, Abdullah SMS, et al. (2015) CO2 emissions, energy consumption, economic
 and population growth in Malaysia. Renew Sust Energy Rev 41: 594–601.
Bilgili F, Koçak E, Bulut Ü (2016) The dynamic impact of renewable energy consumption on CO2
 emissions: a revisited environmental Kuznets curve approach. Renew Sust Energy Rev 54: 838–845.
Bölük G, Mert M (2015) The renewable energy, growth and environmental Kuznets curve in Turkey:
 an ARDL approach. Renew Sust Energy Rev 52: 587–595.
Bortz PG, Kaltenbrunner A (2018) The international dimension of financialization in developing and
 emerging economies. Dev Change 49: 375–393.
Boufateh T (2019) The environmental Kuznets curve by considering asymmetric oil price shocks:
 evidence from the top two. Environ Sci Pollut Res 26: 706–720.
BP (2019) Statistical Review of World Energy 2019. Available from:
 https://www.bp.com/en/global/corporate/energy-economics/statistical-review-of-world-energy.html.
Carkovic M, Levine R (2005) Does foreign direct investment accelerate economic growth? In: T. H.
 Moran, E. M. Graham, and M. Blomström, Does foreign direct investment promote development?
 ed., Washington, DC: Institute for International Economics, 195–220.
Cetin M, Ecevit E, Yucel AG (2018) The impact of economic growth, energy consumption, trade
 openness, and financial development on carbon emissions: empirical evidence from Turkey.
 Environ Sci Pollut Res 25: 36589–36603.
Charfeddine L, Mrabet Z (2017) The impact of economic development and social-political factors on
 ecological footprint: A panel data analysis for 15 MENA countries. Renew Sust Energy Rev 76:
 138–154.
Chen X, Huang B, Lin CT (2019) Environmental awareness and environmental Kuznets curve. Econ
 Model 77: 2–11.

Quantitative Finance and Economics Volume 5, Issue 2, 247–263.
260

Crestanello JP (2020) The impact of renewable electricity production on carbon emissions. Available
 from: https://scholar.harvard.edu/.
Dabachi UM, Mahmood S, Ahmad AU, et al. (2020) Energy consumption, energy price, energy
 intensity environmental degradation, and economic growth nexus in African OPEC countries:
 evidence from simultaneous equations models. J Environ Treat Tech 8: 403–409.
Danish S, Zafar-ul-Hye M (2019) Co-application of ACC-deaminase producing PGPR and
 timber-waste biochar improves pigments formation, growth and yield of wheat under drought
 stress. Sci Rep 9: 1–13.
Danlami MR, Loganathan N, Streimikiene D, et al. (2018) The effects of financial development-trade
 openness nexus on nigeria’s dynamic economic growth. Econ Sociol 11: 128.
Dar JA, Asif M (2017) Is financial development good for carbon mitigation in India? A regime
 shift-based cointegration analysis. Carbon Manage 8: 435–443.
Dauvergne C (2008) Making people illegal: What globalization means for migration and law,
 Cambridge University Press.
Destek MA, Sinha A (2020) Renewable, non-renewable energy consumption, economic growth, trade
 openness and ecological footprint: Evidence from organisation for economic co-operation and
 development countries. J Clean Prod 242: 118537.
Dogan E, Seker F (2016) The influence of real output, renewable and non-renewable energy, trade
 and financial development on carbon emissions in the top renewable energy countries. Renew
 Sust Energy Rev 60: 1074–1085.
Dogan E, Ozturk I (2017) The influence of renewable and non-renewable energy consumption and
 real income on CO2 emissions in the USA: evidence from structural break tests. Environ Sci
 Pollut Res 24: 10846–10854.
Erdogan S, Adedoyin FF, Bekun FV, et al. (2020) Testing the transport-induced environmental
 Kuznets curve hypothesis: The role of air and railway transport. J Air Trans Manage 89: 101935.
Farhani S, Ozturk I (2015) Causal relationship between CO2 emissions, real GDP, energy
 consumption, financial development, trade openness, and urbanization in Tunisia. Environ Sci
 Pollut Res 22: 15663–15676.
Farouq IS, Sulong Z (2020) The impact of economic growth, oil price, and financial globalization
 uncertainty on financial development: evidence from selected leading african countries. Int J Bus
 7: 274–289.
Farouq IS, Sulong Z, Sambo NU (2020) The effects of environmental quality, trade openness, and
 economic growth on financial development in algeria: A diks and panchenko approach. J Crit
 Rev 7: 45–554.
Farouq IS, Sulong Z (2021) The effects of foreign direct investment uncertainty on financial
 development in Nigeria: an asymmetric approach. Iran J Manage Stud 14: 383–399.
Sulong Z, Farouq IS (2021) Energy-Finance Nexus: Evidence from African Oil Exporting Countries.
 Int Energy J 21.
Farouq I, Sulong Z, Ahmad U, et al. (2020) Heterogeneous Data Approach on Financial development
 of Selected African Leading Economies. Data in Brief 30: 105670.
Ghorashi N, Alavi Rad A (2018) Impact of financial development on CO2 emissions: panel data
 evidence from Iran’s economic sectors. J Community Health Res 7: 127–133.
Gowan P (1999) The global gamble: Washington’s Faustian bid for world dominance, London Verso.

Quantitative Finance and Economics Volume 5, Issue 2, 247–263.
261

Grossman GM, Krueger AB (2017) Environmental impacts of a north American free trade agreement;
 national bureau group estimators. Renew Sust Energy Rev 77: 731–747.
Hanif I, Raza SMF, Gago-de-Santos P, et al. (2019) Fossil fuels, foreign direct investment, and
 economic growth have triggered CO2 emissions in emerging Asian economies: some empirical
 evidence. Energy 171: 493–501.
Hübler M, Keller A (2009) Energy Savings via FDI: Evidence from Developing Countries. Environ
 Dev Econ 15: 59–80.
IPCC (2014) Climate Change 2014. Available from: https://www.ipcc.ch/pdf/assessment-
 report/ar5/wg3/ WGIIIAR5_SPM_TS_Volume.pdf (accessed on 22 December 2020).
Jakada AH, Mahmood S (2020) An asymmetric effect of economic growth, foreign direct investment
 and financial development on the quality of environment in Nigeria. J Manage Theory Pract 1:
 5–13.
Jakada AH, Mahmood S, Ahmad AU, et al. (2020) Financial development and the quality of the
 environment in Nigeria: an application of non-linear ARLD approach. Res World Econ 11: 78–92.
Javid M, Sharif F (2016) Environmental Kuznets curve and financial development in Pakistan. Renew
 Sust Energy Rev 54: 406–414.
Jebli MB, Youssef SB, Ozturk I (2016) Testing environmental Kuznets curve hypothesis: The role of
 renewable and non-renewable energy consumption and trade in OECD countries. Ecol Indic 60:
 824–831.
Jiang P, Yang H, Ma X (2019) Coal production and consumption analysis, and forecasting of related
 carbon emission: evidence from China. Carbon Manage 10: 189–208.
Kaika D, Zervas E (2013) The environmental Kuznets curve (EKC) theory-part A: Concept, causes
 and the CO2 emissions case. Energy Policy 62: 1392–1402.
Katircioğlu ST, Taşpinar N (2017) Testing the moderating role of financial development in an
 environmental Kuznets curve: empirical evidence from Turkey. Renew Sust Energy Rev 68:
 572–586.
Kuznets S (2019) Economic growth and income inequality. Am Econ Rev 45: 25–37.
Lall S, Marsden JE, Glavaški S (2002) A subspace approach to balanced truncation for model
 reduction of nonlinear control systems. Int J Robust Nonlinear Control IFAC‐Affiliated J 12:
 519–535.
Lin B, Zhu J (2019) Determinants of renewable energy technological innovation in China under CO2
 emissions constraint. J Environ Manage 247: 662–671.
Liu X, Bae J (2018) Urbanization and industrialization impact of CO2 emissions in China. J Clean
 Prod 172: 178–186.
Nathaniel SP, Iheonu CO (2019) Carbon dioxide abatement in Africa: The role of renewable and non-
 renewable energy consumption. Sci Total Environ 679: 337–345.
Omri A, Daly S, Rault C, et al. (2015) Financial development, environmental quality, trade and
 economic growth: What causes what in MENA countries. Energy Econ 48: 242–252.
Otchere I, Senbet L, Simbanegavi W (2017) Financial sector development in Africa-an overview. Rev
 Dev Financ 7: 1–5.
Ozcan B (2013) The nexus between carbon emissions, energy consumption and economic growth in
 Middle East countries: a panel data analysis. Energy Policy 62: 1138–1147.
Özokcu S, Özdemir Ö (2017) Economic growth, energy, and environmental Kuznets curve. Renew
 Sust Energy Rev 72: 639–647.

Quantitative Finance and Economics Volume 5, Issue 2, 247–263.
262

Paramati SR, Alam MS, Apergis N (2018) The role of stock markets on environmental degradation:
 A comparative study of developed and emerging market economies across the globe. Emerg
 Mark Rev 35: 19–30.
Pata UK (2018) Renewable energy consumption, urbanization, financial development, income and CO2
 emissions in Turkey: testing EKC hypothesis with structural breaks. J Clean Prod 187: 770–779.
Pesaran MH (2006) Estimation and inference in large heterogeneous panels with a multifactor error
 structure. Econometrica 74: 967–1012.
Pesaran MH (2007) A simple panel unit root test in the presence of cross‐section dependence. Journal
 Appl Econometrics 22: 265–312.
Qamruzzaman M, Jianguo W (2020) The asymmetric relationship between financial development,
 trade openness, foreign capital flows, and renewable energy consumption: Fresh evidence from
 panel NARDL investigation. Renew Energy 159: 827–842.
Raza SA, Shah N (2018) Testing environmental Kuznets curve hypothesis in G7 countries: the role
 of renewable energy consumption and trade. Environ Sci Pollut Res 25: 26965–26977.
Rafindadi AA, Ozturk I (2017) Impacts of renewable energy consumption on the German economic
 growth: Evidence from combined cointegration test. Renew Sust Energy Rev 75: 1130–1141.
Salahuddin M, Gow J, Ozturk I (2015) Is the long-run relationship between economic growth,
 electricity consumption, carbon dioxide emissions and financial development in gulf cooperation
 council countries robust? Renew Sust Energy Rev 51: 317–326.
Saud S, Chen S, Haseeb A (2019a) The role of financial development and globalization in the
 environment: accounting ecological footprint indicators for selected one-belt-one-road initiative
 countries. J Clean Prod 26: 2253–2269.
Shahbaz M, Solarin SA, Mahmood H, et al. (2013) Does financial development reduce CO2 emissions
 in Malaysian economy? A time series analysis. Econ Model 35: 145–152.
Shin Y, Yu B, Greenwood-Nimmo M (2014). Modelling asymmetric cointegration and dynamic
 multipliers in a nonlinear ARDL framework, In: Festschrift in honor of Peter Schmidt, Springer,
 New York, NY, 281–314.
Sinani E, Meyer KE (2004) Spillovers of technology transfer from FDI: the case of Estonia. J Comp
 Econ 32: 445–466.
Sinha A, Shahbaz M (2018) Estimation of environmental Kuznets curve for CO2 emission: role of
 renewable energy generation in India. Renew Energy 119: 703–711.
Soederberg S (2014) Debtfare States and the Poverty Industry: Money, Discipline and the Surplus
 Population, New York: Routledge.
Stern DI (2004) The rise and fall of the environmental Kuznets curve. World Dev 32: 1419–1439.
Sugiawan Y, Managi S (2016) The environmental Kuznets curve in Indonesia: Exploring the potential
 of renewable energy. Energy Policy 98: 187–198.
Ulucak R, Khan SUD, Baloch MA, et al. (2020) Mitigation pathways toward sustainable development:
 Is there any trade‐off between environmental regulation and carbon emissions reduction? Sust
 Dev 28: 813–822.
Wang Z, Gerstein M, Snyder M (2009) RNA-Seq: a revolutionary tool for transcriptomics. Nature
 Rev Gene 10: 57–63.
Westerlund J (2007) Testing for error correction in panel data. Oxf B Econ Stat 69: 709–748.
WDI T (2019) World development indicators (DataBank). Available from:
 https://databank.worldbank.org/source/world-development-indicators.

Quantitative Finance and Economics Volume 5, Issue 2, 247–263.
263

Xing T, Jiang Q, Ma X (2017) To facilitate or curb? The role of financial development in China’s
 carbon emissions reduction process: A novel approach. Int J Environ Res Public Health 14: 1222.
Yeh JC, Liao CH (2017) Impact of population and economic growth on carbon emissions in Taiwan
 using an analytic tool STIRPAT. Sust Environ Res 27: 41–48.
Zafar MW, Shahbaz M, Hou F, et al. (2019) From nonrenewable to renewable energy and its impact
 on economic growth: the role of research & development expenditures in Asia-Pacific economic
 cooperation countries. J Clean Prod 212: 1166–1178.
Zaidi SAH, Wei Z, Gedikli A, et al. (2019) The impact of globalization, natural resources abundance,
 and human capital on financial development: Evidence from thirty-one OECD countries. Resour
 Policy 64: 101476.
Zambrano-Monserrate MA, Silva-Zambrano CA, Davalos-Penafiel JL, et al. (2018) Testing
 environmental Kuznets curve hypothesis in Peru: the role of renewable electricity, petroleum and
 dry natural gas. Renew Sust Energy Rev 82: 4170–4178.
Zoundi Z (2017) CO2 emissions, renewable energy and the environmental Kuznets curve, a panel
 cointegration approach. Renew Sust Energy Rev 72: 1067–1075.

 © 2021 the Author(s), licensee AIMS Press. This is an open access
 article distributed under the terms of the Creative Commons
 Attribution License (http://creativecommons.org/licenses/by/4.0)

Quantitative Finance and Economics Volume 5, Issue 2, 247–263.
You can also read