Institution & Project Creation Manual - The CEO Team Spring 2021 - Collect Earth Online
←
→
Page content transcription
If your browser does not render page correctly, please read the page content below
Institution & Project
  Creation Manual
  The CEO Team   Spring 2021
2
Table of Contents
WELCOME TO COLLECT EARTH ONLINE .................................................................................................................. 5

            QUICK INTRODUCTION TO COLLECT EARTH ONLINE ................................................................................ 6

      SETTING UP YOUR ACCOUNT .........................................................................................................................................6
      WEBSITE FEATURES .....................................................................................................................................................6
      REPORT AN ISSUE AND REQUEST NEW FEATURES ...............................................................................................................7

            INSTITUTION SET UP AND MANAGEMENT .............................................................................................. 8

      LIST OF INSTITUTIONS & INSTITUTION PAGES....................................................................................................................8
      REQUEST TO JOIN AN INSTITUTION .................................................................................................................................9
      CREATING A NEW INSTITUTION ....................................................................................................................................10
      INSTITUTION MANAGEMENT .......................................................................................................................................11
      INSTITUTION USER (MEMBER) MANAGEMENT .................................................................................................................12
      OTHER ADMINISTRATOR PRIVILEGES .............................................................................................................................12

            BUILT-IN & ADDING BASE IMAGERY SOURCES ...................................................................................... 13

      BUILT IN BASE IMAGERY SOURCES ................................................................................................................................13
      ADDING ADDITIONAL BASEMAP IMAGERY ......................................................................................................................14
      ADDING IMAGERY FROM MULTIPLE TIME PERIODS ...........................................................................................................30
      EDITING AND DELETING IMAGERY ................................................................................................................................31
      ESTIMATING IMAGERY COSTS ......................................................................................................................................32
      SYNTHETIC APERTURE RADAR (SAR) DATA IN CEO FOR FOREST DEGRADATION.....................................................................34

            PROJECT CREATION ............................................................................................................................... 35

      CREATE A NEW PROJECT (WIZARD) ...............................................................................................................................35
      PROJECT OVERVIEW..................................................................................................................................................36
      IMAGERY SELECTION .................................................................................................................................................41
      PLOT DESIGN—BACKGROUND....................................................................................................................................42
      PLOT DESIGN—CEO’S BUILT IN SYSTEM .......................................................................................................................43
     SAMPLE DESIGN—CEO’S BUILT IN SYSTEM....................................................................................................................46
      PLOT & SAMPLE DESIGN—CSV & SHP FILES................................................................................................................46
      SURVEY QUESTIONS..................................................................................................................................................52
     SURVEY RULES ..........................................................................................................................................................65
     REVIEW PROJECT .......................................................................................................................................................68

            PROJECT INFORMATION INTERFACE ..................................................................................................... 69

      PROJECT DETAILS .....................................................................................................................................................69
      PROJECT MANAGEMENT ............................................................................................................................................69
      MODIFY PROJECT DETAILS .........................................................................................................................................70
      EXTERNAL LINKS .......................................................................................................................................................70
      EXPORT DATA ..........................................................................................................................................................71

            GEO-DASH IMPLEMENTATION .............................................................................................................. 74

      WIDGET FORMATTING NOTES .....................................................................................................................................76
      ADD AN IMAGE COLLECTION WIDGET...........................................................................................................................76

                                                                                                                                                                            3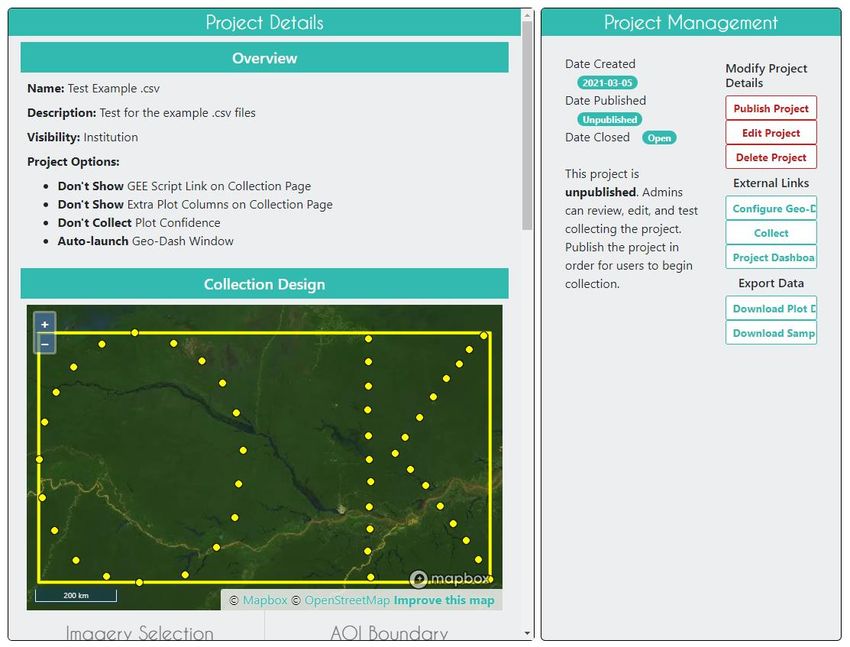
ADD A TIME SERIES GRAPH WIDGET ............................................................................................................................78
 ADD A STATISTICS WIDGET ........................................................................................................................................79
 ADD A DUAL IMAGE COLLECTION WIDGET.....................................................................................................................79
 ADD AN IMAGE ASSET WIDGET ...................................................................................................................................81
 ADD AN IMAGE COLLECTION ASSET WIDGET .................................................................................................................83
 ADD SRTM DIGITAL ELEVATION DATA 30M WIDGET .....................................................................................................83
(FOREST) DEGRADATION TOOL .....................................................................................................................................84
MOVE & RESIZE WIDGETS ...........................................................................................................................................85
 EDIT & DELETE WIDGETS ............................................................................................................................................86

       CREATING A PROJECT FOR VALIDATION ................................................................................................ 87

 ACCURACY ASSESSMENT ............................................................................................................................................87
 VALIDATION GOALS & REQUIRED SAMPLE SIZE ................................................................................................................88
 SAMPLING APPROACH ...............................................................................................................................................90
 ALTERNATIVE: USING TIMESYNC .................................................................................................................................90

                                                                                                                                                                   4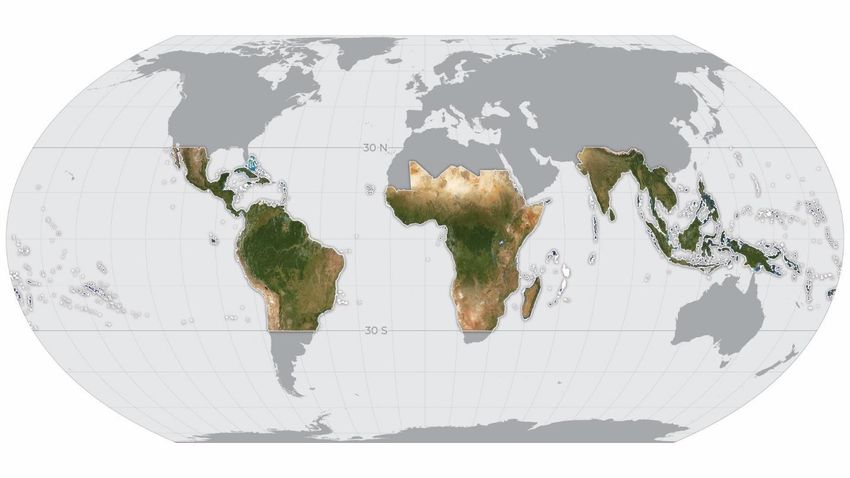
Welcome to Collect Earth Online
Collect Earth Online, or CEO, is a free and open-source image viewing and interpretation tool, suitable
for projects requiring information about land cover and/or land use. CEO enables simultaneous visual
interpretations of satellite imagery, providing global coverage from MapBox and Bing Maps, a variety of
satellite data sources from Google Earth Engine, and the ability to connect to your own Web Map
Service (WMS) or Web Map Tile Service (WMTS). The full functionality is implemented online, no
desktop installation is necessary.

CEO allows institutions to create projects and leverage their teams to collect spatial data using remote
sensing imagery. Use cases include historical and near-real-time interpretation of satellite imagery and
data collection for land cover/land use model validation.

Collect Earth Online (CEO) is available at https://collect.earth/.

This manual provides information for institution and project administrators, including how to set up an
institution, how to set up a project, and project management suggestions. Part 1 provides a quick
overview of the Collect Earth Online platform, so administrators can set up their own user accounts. Part
2 details how to set up and manage an institution in CEO. Part 3 discusses how to manage custom
imagery feeds; if your institution will only be using CEO’s standard imagery, you can skip this section.
Part 4 discusses how to create a data collection project, Part 5 discusses project review, and Part 6
introduces the Geo-Dash, which provides additional information for uses during data collection. Part 7
explains how to manage a published project. If you are interested in setting up a CEO project for
validation (e.g. of a land cover model), Part 8 discusses project creation for these specialized projects.

This manual uses a few formatting standards for ease of use. Clickable links are shown [like this]. The
names of pages, like the Home page, are bolded.

The     icon is used to indicate use cases. The        icon is used to indicate new, interesting, and or useful
functionality in CEO. Finally, CEO is a live tool that is under continuous development. Workarounds for
current issues are shown in boxes like this:

                 This is a description of a current challenge and how to work around it.

And planned features are shown in boxes like this:

                 This is a description of a planned feature.

                                                                                                              5
Quick Introduction to Collect Earth Online
   Setting up your account
   1. In your browser window, navigate to https://collect.earth/. CEO supports Google Chrome,
      Mozilla Firefox, and Microsoft Edge.
   2. Click [Login/Register] on the upper right.
   3. To set up a new account, click on [Register] and follow the instructions.
   4. When you have an account, login with your email and password.
   5. If you forget your password, click on [Forgot your password?] and follow the instructions.

   Website features
You can access the Home, About, Support, and Account pages from the top menu bar.

   1. The Home page includes information about institutions, published projects, and a map showing
      locations of existing projects.
   2. The About page summarizes information about CEO.
   3. The Support features any currently available Collect Earth Online Manuals, Tutorials, and a
      Collect Earth Online Demo. This page also includes links for bug reporting and forums to ask for
      help.
   4. The Blog page hosts interesting news about CEO and information about new features.
   5. The Account page lists information such as user statistics and allows users to update their
      account settings.
   6. There is a purple ? in the top right corner of the screen. Clicking on this will bring up the help
      interface, which provides information about CEO’s features. These help interfaces are available
      for the Home page, for Data Collection (see other manual) and for Project Creation.

               CEO will be adding dynamic “My Institutions/My Projects” tabs along
               with more detailed Account pages. This will make it easier to access
               your institutions and projects.

                                                                                                           6
Report an issue and request new features
When you click on [Support] at the top of the webpage, there is a link to the GitHub issues page. This
page is also available at: https://github.com/openforis/collect-earth-online/issues.

If you discover any of the Collect Earth Online functions are not working properly or would like to
suggest an additional feature, you can use this page to log an issue or suggestion. Once logged, these
messages go directly to the Collect Earth Online developer team.

You will have to either log in or set up a GitHub account to log an issue. By logging in, the development
team can contact you in case they need additional information to provide a solution to the issue or
feature suggestion. Alternatively, if you are unable to register an account with GitHub, you can ask
questions on the OpenForis forum, which is available here http://www.openforis.org/support.

    1. When you have a GitHub account, navigate to the CEO GitHub Page.
    2. To log an issue or request a new CEO feature, simply click on the green [New issue] button in the
       upper right-hand portion of the screen.
    3. Type in a title that conveys the topic of the issue or request.
    4. Then below, type in a detailed message summarizing the issue you have encountered or the
       additional functionality you would like to see in CEO.
    5. Once you have finished providing the details, click the green [Submit new issue] button. This will
       log your request.

                                                                                                            7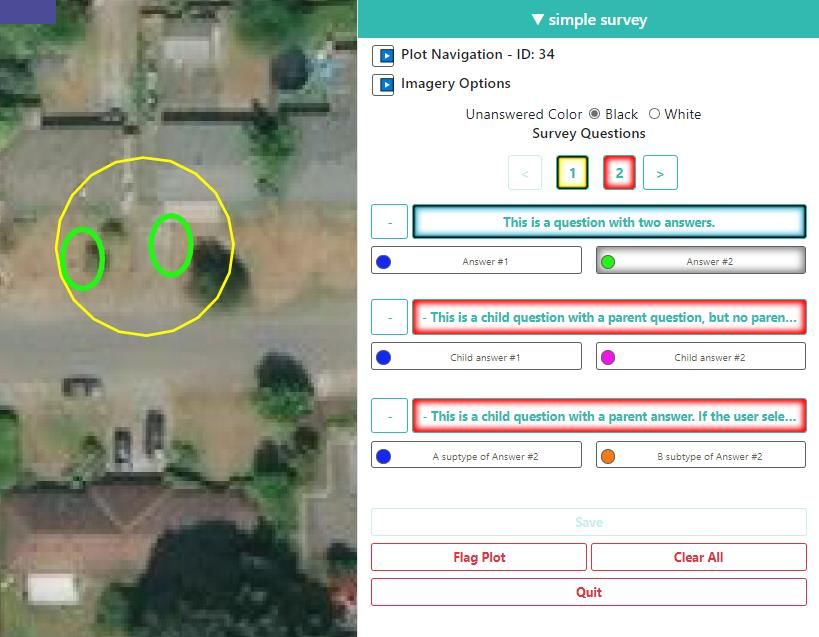
Institution Set Up and Management
List of institutions & Institution pages
1. A list of all institutions is displayed on the Home page.
2. If you are logged in, this list is broken into two: Your Affiliations and Other Institutions. Your
   Affiliations are institutions to which you belong.
3. Clicking on an ’institutions’ name expands a list of all active Projects for the Institution. Clicking
   on these projects will take you to the Data Collection page (see Data Collection Manual).

4. Next to each institution’s name is a [VISIT] button. Clicking on this will open the Institution page.
5. On any Institution info page, you can find:

   i.   The institution’s logo, which when clicked will take you to the institution’s website link,
  ii.   The institution’s name
 iii.   A short description of the institution,
 iv.    Imagery feeds available to the institution
  v.    The institution’s projects, and
 vi.    A list of all registered users associated with the institution.

                                                                                                            8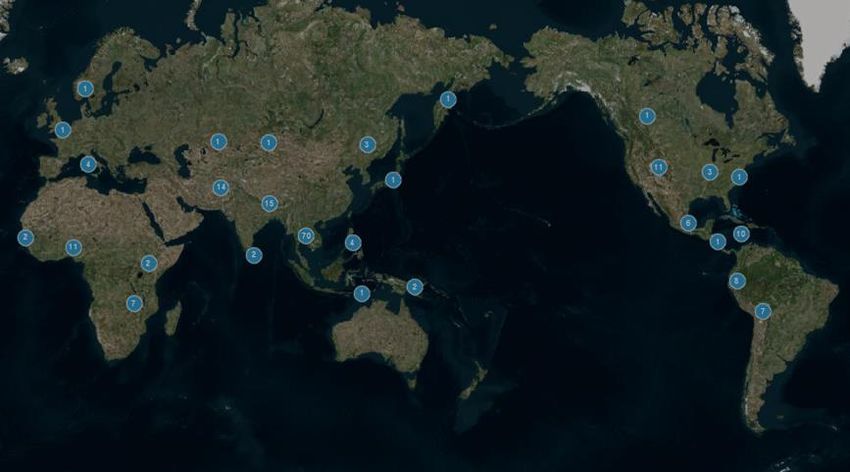
Request to join an institution
1. If your institution already has an account on CEO and you would like to request to be a member,
   start by navigating to the Institution page via the info button described in A.2-4 above.
2. The list of Users is contained under the Users tab. Click on this tab.
3. Click on the [Request Membership] button to be considered to join the institution.
4. Once you are part of an institution, the Institution panel on the Home page will show your
   institutions. This makes it easier to access these institutions and their projects.

                                                                                                 9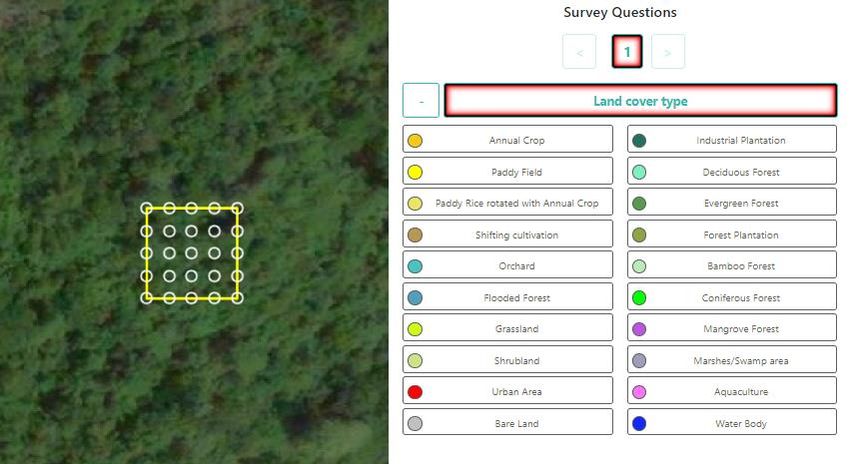
Creating a new institution
1. If your institution is not yet signed up for CEO, you can create a new institution. You will need to
   be signed into your account (click [Login/Register]).
2. When you are signed in, navigate to the Home page and click on [Create New Institution] on the
   left panel of the Home page.

3. Enter your institution’s name, URL, and a brief description of your institution. These will display
   on your Institution page.
4. You can upload a logo from your computer by clicking on [Browse…] and navigating to the
   correct location on your computer.

                                                                                                     10
5. Click [Create Institution] after you have finished entering your information.
Institution management
If you are an administrator for an institution, you can make changes to your institution’s information
after the institution is created.
1. If you want to make changes, start by navigating to your Institution’s info page (see A.2-4
above).
2. You can make changes to the institution page by clicking [Edit] at the top of the page.
3. You can also delete your institution by clicking [Delete]. This action is PERMANENT, and your
institution cannot be recovered afterwards. ALL PROJECTS ASSOCIATED WITH THE INSTITUTION
WILL ALSO BE DELETED.
More importantly, you can also manage three aspects of your institution that allow data collection
through CEO. These include the Imagery feeds, the data collection Projects, and the Users associated
with the institution. This information is displayed in three panels on your Institution’s info page.
4. The Imagery tab lists all available imagery and WMS Feeds. You can add new imagery feeds here
as well. This is discussed in Part 3 of this manual.
115. The Projects panel lists your institution’s projects, identifies projects as public or private, and
allows you to create new projects. This is discussed in Part 4: Project Creation of this manual.
6. The Users panel lists your ’institutions’ members and allows them to be updated. This is
discussed in Section E. below.
Institution user (member) management
1. As an administrator, you can add a Collect Earth Online member to the institution by typing the
user’s email address into the box and clicking the [Add User] button. Only email addresses that
have already created a CEO account can be added to the institution. If you are successful, a pop-
up window will notify you that the user has been given the role ‘member,’ and the user’s email
address will appear in the list of users.
2. You can approve pending affiliation requests as well.
3. To change the role of a user, use the menu to the right of their email address. Available user
roles are Admin and Member. Users who are Admins can edit any of the institution’s projects.
4. To restrict the Admin capabilities of a user to only one of the institution’s projects, you can
create a new institution specifically for that project. Add the user as an Admin for the new
institution.
5. You can also remove users from the institution using this drop-down menu and selecting the
Remove option.
Other administrator privileges
1. As an administrator you can review and modify the answers for all plots, including plots labeled
by other CEO users. Members of an institution can only review and modify answers for plots
they themselves have labeled. To access this feature, use the Navigate Through dropdown
menu on the Collection Page set to All Collected Plots.
2. As an administrator you can review "unpublished" projects that you or other administrators
have created. This is discussed further in Part 4: Project Creation.
3. As an administrator, you can download collected data from Institution projects. See Part 5:
Project Information Interface Sec. E: Export Data for a list of the data fields included in data
download.
12Built-in & Adding Base Imagery Sources
Built-in base imagery sources
There are a handful of built-in imagery options in CEO. Each of these options has different strengths and
limitations.
MapBox is an open-source mapping platform for custom designed maps. The satellite imagery uses
different sources based on the zoom level and geographic availability.
• Zoom levels 0-8 use de-clouded data from NASA MODIS satellites.
• Zoom levels 9-12 use NASA/USGS Landsat 5 & 7 imagery.
• Zoom levels 13+ use a combination of open and proprietary sources, including Digital Globe for
much of the world, USDA’s NAIP 2011–2013 in the contiguous United States, and open aerial
imagery from Denmark, Finland, and parts of Germany.
MapBox Satellite and Mapbox Satellite w/Labels are thus composite satellite imagery, where each map
tile may be stitched together from imagery acquired on multiple dates. There is not necessarily a single
date for an imagery tile. This is the same as, for example, Google Maps and Bing Aerial Imagery.
CEO has created a plain satellite layer as well as one with labels. More information is available here:
https://www.mapbox.com/ and https://docs.mapbox.com/help/how-mapbox-works/satellite-imagery/.
Maxar has eliminated multiple data products that were previously
available on CEO, including: DigitalGlobeRecentIMagery;
DigitalGlobeRecentImagery+Streets; DigitalGlobeWMSImagery; and
EarthWatch.
Planet NICFI Public is imagery available through a partnership between Norway’s Ministry of Climate
and Environment, specifically Norway’s International Climate and Forest Initiative (NICFI) and Planet.
Along with other partners, they have made high-resolution (sub 5-m pixel) imagery available in the
tropics. MMore information can be found here: https://www.planet.com/pulse/planet-ksat-and-airbus-
awarded-first-ever-global-contract-to-combat-deforestation/.
13Adding additional basemap imagery
The built-in imagery is not sufficient as basemaps for some projects, including projects comparing land
uses between two time periods, or projects that need imagery from specific dates or months. CEO
allows institutions to add new imagery sources through their Institution page. This section discusses the
different imagery types that can be added.
The instructions below assume you are starting on your Institution page (see directions in Part 2: A.2-4)
and are logged in as an Administrator for your Institution.
Under the Imagery panel on the Institution page, click [Add New Imagery]. Under Select Type you will
see these options: GeoServer, BingMaps, Planet Monthly, Planet Daily, SecureWatch, Sentinel 1,
Sentinel 2, MapBox Raster and MapBox Static. GeoServer is a protocol that can be applied broadly, while
the other options connect to specific data sources that you generally need to subscribe to.
For BingMaps, Planet Monthly, Planet Daily, SecureWatch, and the MapBox products you will first need
to locate your no-authentication API key. You will be asked to provide this key in the CEO imagery setup
panel.
We will now talk about how to add imagery for each of these options, since the information needed to
set up the WMS server will differ based on the specific imagery you are adding (note the options in the
image may be different than what you see, as imagery availability has shifted significantly recently).
141. WMS Imagery
i. This option can be used to access data your Institution hosts or data services that use WMS
or WTMS. Imagery must be accessible using WMS or WTMS. Images stored locally on a
user’s computer cannot be added to a CEO project, although they can be accessed if you
upload them to a WMS or WTMS (as a basemap), or as a Google Earth Engine Asset (for
Geo-Dash and/or basemap).
ii. The first step of preparing to connect to your WMS with CEO is checking that your WMS is
compatible with CEO.
a) CEO requests data in EPSG:3857. Your WMS server is responsible for reprojecting the
imagery it hosts into this requested projection.
iii. Second, to connect your web map service (WMS) to CEO, you need to gather three pieces of
information: the base URL for your WMS, the layer name that you want, and any
parameters your WMS requires to serve imagery.
iv. Title: This will be the displayed name of the imagery.
v. Attribution: This is the displayed attribution for your imagery. It will appear at the top of the
map while users perform data collection tasks.
vi. URL: This should be the URL of your WMS/WTMS. It should be http:// or https://
vii. Layer Name: This is the layer name from your server that you want to display.
viii. Params (as JSON object): If there are any parameters for the layer you want to specify, put
them here as a JSON object. Documentation for the WMS getMapService is available online
here: https://docs.geoserver.org/stable/en/user/services/wms/reference.html#getmap.
These work only if they are parsed by the target WMS. Here are some examples:
{"TILED": true}
{"VERSION": "1.1.1", "CONNECTID": "63f634af-fc31-4d81-9505-
b62b4701f8a9", "FEATUREPROFILE": "Accuracy_Profile",
15"COVERAGE_CQL_FILTER": "(acquisition_date>'2012-01-
01')AND(acquisition_dateo We definitely don’t want to include “request=GetCapabilities”. This won’t return
imagery.
o However it does look like we need “map=ortofoto.map”.
o Using this process, identify any additional parameters your WMS requires to serve
imagery.
Now that we have the crucial information, we can connect the WMS to CEO.
• In CEO, navigate to your Institutional Imagery page.
• Create a new imagery layer of type WMS Imagery.
• For Title, add your desired name. This might be the WMS layer name, the WMS name, some
combination of these, etc.
• Add the Attribution for your imagery.
• Type in your WMS URL (only the portion before the ?) that you identified above.
• Type in your WMS Layer Name.
• Type in your additional WMS Parameters. These need to be written as a JSON object.
o Therefore “map=ortofoto.map”
o Becomes {"MAP":"ortofoto.map"}. Note the straight “”.
o If you do not have any parameters type {}.
• Double check and press Save!
o To add this imagery to all of your projects, check Add Imagery to All Projects When
Saving.
Additional troubleshooting hints:
• If your layer is blank, first check your resolution. Some WMS layers will only be visible at certain
resolutions.
• Next, double check the URL and the layer name for typos.
• If these don’t work, a good place to start is to make sure that your WMS server is working
correctly by finding a WMS URL to an image of one of their map tiles. If you open this URL in
your web browser, you should see that image load successfully.
17o For example, http://geos0.snitcr.go.cr/cgi-
bin/web?SERVICE=WMS&VERSION=1.3.0&REQUEST=GetMap&FORMAT=image%2Fpng
&TRANSPARENT=true&LAYERS=Mosaico5000&WIDTH=320&HEIGHT=320&CRS=EPSG%3
A3857&STYLES=&FORMAT_OPTIONS=dpi%3A113&BBOX=-
9275174.760236427%2C939258.2035682462%2C-
9236039.001754416%2C978393.9620502564&map=ortofoto.map
o https://geos1.snitcr.go.cr/Ortofoto2017/wms?SERVICE=WMS&VERSION=1.1.1&REQUES
T=GetMap&FORMAT=image%2Fpng&TRANSPARENT=true&LAYERS=fotocentros_ortofot
o_2017_5000&TILED=true&WIDTH=256&HEIGHT=256&SRS=EPSG%3A5367&gridSet=CR
TM05&STYLES=&BBOX=348586.56637714803%2C738692.4676108168%2C912687.8695
003731%2C1302793.770734042
▪ Note that this server requires SRS instead of CRS. Both are OGC compliant.
While you’re creating the working WMS URL, you might get the following error:
▪ Therefore when creating this URL, you would know to include the
{“SRS”:”EPSG3857”} JSON argument.
• Make sure your layer is available in the correct projection. CEO uses 3857.
• If your layer is still blank, next visit your browser’s console and examine the error messages.
2. XYZ Tiles
i. XYZ Tiles is a flexible way of adding imagery. Services you can now add includes any of the
adaptations of Open Street Maps, Yandex, and any other service using XYZ.
ii. Title: This will be the displayed name of the imagery.
iii. Attribution for the XYZ Imagery. This will be shown to your users in the data collection pane.
iv. Add the XYZ URL.
a) By default, XYZ uses the widely-used Google grid, where (x,y) (0,0) are in the top left.
b) In general, it should have the format: ?x={x}&y={y}&z={z} . For example,
https://sat0{1-4}.maps.yandex.net/tiles?l=sat&x={x}&y={y}&z={z} Another example,
https://mt1.google.com/vt/lyrs=y&x={x}&y={y}&z={z}
c) You can also use grids where (x,y) (0,0) are in the bottom left. To do so, you will need to
use the following format: ?x={x}&y={-y}&z={z}
d) Note that sometimes you will need to edit a provided URL to make it compatible with
CEO. For example, the Open Street Map WIKI provides the following URL for the German
18version of Open Street Maps: https://a.tile.openstreetmap.de/${z}/${x}/${y}.png. As
provided this will not work. To make it work, you will need to delete the “a.” subdomain
and the “$” characters.
e) The edited URL does work in CEO: https://tile.openstreetmap.de/{z}/{x}/{y}.png
v. If you want to add this imagery source to all your institution’s projects, check the box next
to Add Imagery to All Projects When Saving.
vi. When all fields are filled out, click on [Add New Imagery].
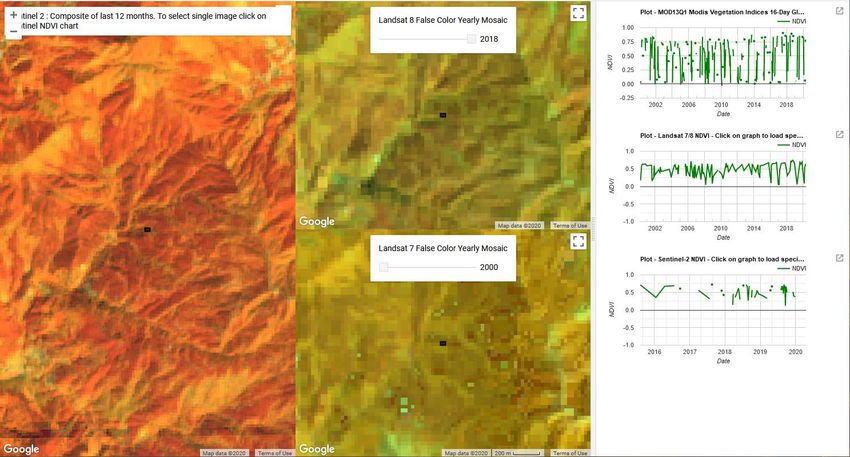
3. Open Street Maps
i. Open streets Maps is an open source mapping product. Note this provides Open Street
Map’s Standard Tile Layer (Standard tile layer - OpenStreetMap Wiki). This product is useful
for orienting users, since it has street and place names.
ii. Title: This will be the displayed name of the imagery.
iii. If you want to add this imagery source to all of your institution’s projects, check the box next
to Add Imagery to All Projects When Saving.
iv. When all fields are filled out, click on [Add New Imagery].
194. BingMaps
i. This imagery option allows you to add Bing Maps with your own API key. The imagery
provided by Bing Maps is composite satellite imagery. This means that each map tile is
stitched together from imagery acquired on multiple dates. There is not a single date for an
imagery tile. Some map tiles contain imagery collected over a multi-day window while other
tiles contain imagery collected over a multi-year window. As there is not a single date for an
imagery tile, CEO cannot provide the exact date of the imagery used. If you’re interested in
learning more, the Bing Maps API can be found here: https://docs.microsoft.com/en-
us/bingmaps/rest-services/imagery/imagery-metadata. The Bing tile system uses the
Mercator projection and has 23 levels of zoom (though not all levels are available in all
locations). Commonly, the resolution at max zoom is about 0.3 m per pixel. For more
information, see https://docs.microsoft.com/en-us/bingmaps/articles/bing-maps-tile-
system.
ii. Title: This will be the displayed name of the imagery.
iii. Imagery Id: Only Aerial and AerialWithLabels are currently implemented. Note that the
AerialWithLabels imagery uses the legacy static tile service, which is deprecated, and
current data will not be refreshed. It therefore may have older imagery than the Bing Aerial
dataset.
iv. Access Token: Your BingMaps key. For more information or to obtain your own key, see
https://docs.microsoft.com/en-us/bingmaps/getting-started/bing-maps-dev-center-
help/getting-a-bing-maps-key.
20v. If you want to add this imagery source to all of your institution’s projects, check the box next
to Add Imagery to All Projects When Saving.
vi. When all fields are filled out, click on [Add New Imagery].
Directions for requesting a Bing maps key:
• To use Bing Maps imagery for your projects, you can create your own FREE Bing maps key to
connect your institution's projects to your Bing Maps account. The full directions for creating a
key are here: https://docs.microsoft.com/en-us/bingmaps/getting-started/bing-maps-dev-
center-help/getting-a-bing-maps-key
• Visit https://www.bingmapsportal.com/ to request a Bing key or copy your existing key.
o Sign in. You will need a Bing maps account or Microsoft account
(https://docs.microsoft.com/en-us/bingmaps/getting-started/bing-maps-dev-center-
help/creating-a-bing-maps-account)
o Once you have logged in, click on My account, then click on My Keys
o If you already have a key, click Show key or Copy key
o If you do not have a key, click on Click here to create a new key.
o Fill out the information. Application URL is optional (and I might suggest not using it) but
if you do, use https://collect.earth as your Application URL
o You will create a Basic key. If you need more imagery, you will need to talk to Microsoft
and request an Enterprise key (https://www.microsoft.com/en-us/maps/create-a-bing-
maps-key#enterprise)
5. Planet Monthly
i. Planet offers multiple data products (product specification here:
https://support.planet.com/hc/en-us/articles/360022233473-Planet-Imagery-Product-
Specifications) . This option pulls from the Planet Monthly mosaic product, which allows you
to display imagery from a specific month. User help is available here:
https://developers.planet.com/docs/apps/explorer//.
ii. Title: This will be the displayed name of the imagery.
iii. Default Year: The default year that will be displayed when the map loads.
iv. Default Month: The default month that will be displayed when the map loads. Use integer
format 1-12.
v. Access Token: Your Planet access token. This can be accessed through your My Account
page on the Planet website.
vi. If you want to add this imagery source to all of your institution’s projects, check the box next
to Add Imagery to All Projects When Saving.
vii. When all fields are filled out, click on [Add New Imagery].
21Default Year & Default Month will let you put in any integer, positive or
negative. The up and down arrow keys start at 0. Please type year in the
YYYY format and month as an integer between 1-12.
6. PlanetDaily
i. PlanetDaily is another imagery product available from Planet. It allows users to detect land
use and land cover change in near real time. This data source allows you to select a start and
end date, with up to daily imagery resolution. Your study area might not have full coverage
every day.
ii. Title: This will be the displayed name of the imagery.
iii. Access Token: Your PlanetDaily API key. This can be accessed through your My Account
page on the Planet website.
iv. Start Date: Starting date for the imagery you are interested in; you can input the date using
numeric keys or with the calendar widget on the right side.
v. End Date: Ending date for the imagery you are interested in.
vi. If you want to add this imagery source to all of your institution’s projects, check the box next
to Add Imagery to All Projects When Saving.
vii. When all fields are filled out, click on [Add New Imagery].
7. Planet NICFI
i. This allows you to add your own Planet NICFI key, instead of using CEO’s. Note that you will
need an account from the Planet NICFI program: https://www.planet.com/nicfi/. This is
separate from your ‘normal’ Planet account.
ii. Title: This will be the displayed name of the imagery.
iii. Access Token: Your PlanetDaily API key. This can be accessed through your My Account
page on the Planet website.
iv. Default Time: Choose the default time period of imagery to display. Note that the time
periods available from NICFI are actively being changed. As of March 2021 these include
individual months: 2020-09 through 2021-02 and bi-annual products: 2020-06_2020-08,
2019-12_2020-05, 2019-06_2019-11, 2018-12_2019-05, 2018-06_2018-11, 2017-12_2018-
05, 2017-06_2017-11, 2016-12_2017-05; 2016-06_2016-11, and 2015-12_2016-05. THESE
ARE SUBJECT TO CHANGE BASED ON PLANET AND NICFI’s DECISIONS.
22v.
vi. Default Band: Choice between Visible (RGB) and Infrared false color.
vii. If you want to add this imagery source to all of your institution’s projects, check the box next
to Add Imagery to All Projects When Saving.
viii. When all fields are filled out, click on [Add New Imagery].
8. SecureWatch Imagery
i. SecureWatch is a service from Maxar focused on monitoring for new land use/land cover
changes and comparing current land use/land cover with over 20 years of historic images.
For more information see: https://www.digitalglobe.com/products/securewatch.
ii. https://gcs-
docs.s3.amazonaws.com/Access/Miscellaneous/DevGuides/WMS/WMS_Map.htm?Highligh
t=key
iii. Title: This will be the displayed name of the imagery.
23iv. Connect ID: This is your API key. You need to use a no-auth key here, which should be a
string of letters and numbers separated by dashes.
v. Start Date: Starting date for the imagery you are interested in; you can input the date using
numeric keys or with the calendar widget on the right side.
vi. End Date: Ending date for the imagery you are interested in.
vii. If you want to add this imagery source to all of your institution’s projects, check the box next
to Add Imagery to All Projects When Saving.
viii. When all fields are filled out, click on [Add New Imagery].
9. Sentinel 1 Imagery
i. Sentinel data is piped through GEE into CEO. Sentinel 1 information is only available from
April 2014 to present (Sentinel 1A launch).
ii. Title: This will be the displayed name of the imagery.
iii. Default Year: The default year that will be displayed when the map loads.
iv. Default Month: The default month that will be displayed when the map loads. Use integer
format 1-12.
v. Band Combination: Preset combinations of bands for most uses. VH and VV are single
polarization, VH/VV and HH/HV are dual polarization. More info
https://sentinel.esa.int/web/sentinel/user-guides/sentinel-1-sar/acquisition-modes.
vi. Min: Minimum value for bands that will get mapped to 0 for visualization. This can be one
value for all bands, or a value for each of the three bands. This should be one number.
Acceptable values for each band’s minimum are the same as for Sentinel imagery available
through GEE generally; see https://developers.google.com/earth-
engine/datasets/catalog/sentinel. Min can be as low as -50, but 0 is frequently used.
vii. Max: Maximum value for bands that will get mapped to 255 for visualization. This can be
one value for all bands, or a value for each of the three bands. This should be one number.
Acceptable values for each band’s maximum are the same as for Sentinel imagery available
through GEE generally. See link above. Max can be as high as 1, but .3 is frequently used.
viii. If you want to add this imagery source to all of your institution’s projects, check the box next
to Add Imagery to All Projects When Saving.
ix. When all fields are filled out, click on [Add New Imagery].
10. Sentinel 2 Imagery
i. Sentinel 2 imagery is available from June 2015-present.
ii. Title: This will be the displayed name of the imagery.
iii. Default Year: The default year that will be displayed when the map loads.
iv. Default Month: The default month that will be displayed when the map loads. Use integer
format 1-12.
v. Band Combination: Select one of the options available, including True Color, False Color
Infrared, False Color Urban, Agriculture, Healthy Vegetation, and Short Wave Infrared.
24vi. Min: Minimum value for bands that will get mapped to 0 for visualization. This can be one
value for all bands, or a value for each of the three bands. This should be a single number.
Acceptable values for each band’s minimum are the same as for Sentinel imagery available
through GEE generally; see https://developers.google.com/earth-
engine/datasets/catalog/sentinel For example, 0 could be used.
vii. Max: Maximum value for bands that will get mapped to 255 for visualization. This should be
a single number. Acceptable values for each band’s maximum are the same as for Sentinel
imagery available through GEE generally. See link above. For example, values of 2800-4000
are frequently used.
viii. Cloud Score: Allowable cloud cover. Values can be 0-100.
ix. If you want to add this imagery source to all of your institution’s projects, check the box next
to Add Imagery to All Projects When Saving.
x. When all fields are filled out, click on [Add New Imagery].
11. GEE Image Asset
i. Google Earth Engine (GEE) Assets include user’s uploaded assets along with assets provided
by other users and GEE. Information on Assets can be found here:
https://developers.google.com/earth-engine/guides/asset_manager. More detail on
uploading your own assets is below. Note that Image Asset refers to a single image (e.g. a
GeoTIFF layer) while ImageCollection Asset refers to a stack of images (e.g. GeoTiff layers of
the same location over different dates).
ii. Title: This will be the displayed name of the imagery.
iii. Asset ID: The Asset ID for your image asset. Will have a format similar to:
USDA/NAIP/DOQQ/n_4207309_se_18_1_20090525
iv. Visualization Parameters (JSON format): Any visualization parameters for your layer. For
example, {"bands":["R","G","B"],"min":90,"max":210}
v. If you want to add this imagery source to all of your institution’s projects, check the box next
to Add Imagery to All Projects When Saving.
vi. When all fields are filled out, click on [Add New Imagery].
2512. GEE ImageCollection Asset
i. Google Earth Engine (GEE) Assets include user’s uploaded assets along with assets provided
by other users and GEE. Information on Assets can be found here:
https://developers.google.com/earth-engine/guides/asset_manager. More detail on
uploading your own assets is below. Note that Image Asset refers to a single image (e.g. a
GeoTIFF layer) while ImageCollection Asset refers to a stack of images (e.g. GeoTiff layers of
the same location over different dates).
ii. Title: This will be the displayed name of the imagery.
iii. Asset ID: The Asset ID for your image asset. Will have a format similar to:
LANDSAT/LC08/C01/T1_SR
iv. Start Date: The default start date of imagery to display.
v. End Date: The default end date of imagery to display.
vi. Visualization Parameters (JSON format): Any visualization parameters for your layer. For
example, {"bands":["B4","B3","B2"],"min":0,"max":2000}
vii. If you want to add this imagery source to all of your institution’s projects, check the box next
to Add Imagery to All Projects When Saving.
viii. When all fields are filled out, click on [Add New Imagery].
Uploading GeoTIFF images to GEE:
• Visit https://code.earthengine.google.com/
• Navigate to Assets
26• Click New, then under Image Upload click GeoTIFF.
• A new window will pop up. Click Select and navigate to the GeoTIFF asset.
• Alter the Asset ID name if you would like.
• Check the default settings, e.g. if your data has a start/end time then add those.
• Click Upload.
27• Wait for your asset to upload. When it does, click on the asset name and a new window will pop
up.
• Next to ImageID there are two interlocking squares.
• Click on this to copy your ImageID to the clipboard (you’ll need this to connect to CEO).
o You can also click on the “Bands” tab to get more information about your image. This is
very useful for specifying your visualization parameters in CEO.
o Can also add gamma etc. information, see https://developers.google.com/earth-
engine/guides/image_visualization
13. MapBox Raster
i. MapBox Raster serves raster tiles including Mapbox Satellite. For more information see::
https://docs.mapbox.com/help/glossary/raster-tiles-api/.
ii. Title: This will be the displayed name of the imagery.
iii. Layer Name is the desired layer name from MapBox.
iv. Access Token will be your no-auth key from MapBox. For more information, see
https://docs.mapbox.com/help/glossary/raster-tiles-api/.
v. If you want to add this imagery source to all of your institution’s projects, check the box next
to Add Imagery to All Projects When Saving.
vi. When all fields are filled out, click on [Add New Imagery].
14. MapBox Static
i. Mapbox Static serves raster tiles generated from a Mapbox GL-based style. This API has
additional parameters that can be used to refine the results of a request. More information
see: https://docs.mapbox.com/help/glossary/static-tiles-api/
ii. Title: This will be the displayed name of the imagery.
iii. User Name will be your MapBox user name.
iv. Map Style ID will be the id from MapBox.
v. Access Token will be your MapBox no-auth key. For more information see
https://docs.mapbox.com/help/glossary/static-tiles-api/.
vi. If you want to add this imagery source to all of your institution’s projects, check the box next
to Add Imagery to All Projects When Saving.
vii. When all fields are filled out, click on [Add New Imagery].
For imagery options with dates, the dates you input are the default dates that the imagery will
be restricted to on the collection page. However, the user will be able to change these when
exploring the map as there are start & end date widgets on the collection page sidebar (there
are examples in the Data Collection Manual). For SecureWatch, the user will also be able to choose
between FeatureProfiles. Without specifying a FeatureProfile, the most recent available imagery
between the start and end dates displayed on the map.
28SecureWatch and the Planet products will not return imagery if the map is zoomed out too much. This
results in a white map canvas being displayed at the project overview level usually. Simply click the "Go
to first plot" button on the Collection page to zoom in to the plot level, and then the imagery should
appear.
For SecureWatch, the date shown when data is collected will be added to the project .csv data available
for download (See Part 7: E “Download your data”).
29Adding imagery from multiple time periods
Adding multiple imagery options with different default time periods can make data collection easier for
projects that compare two or more time periods to detect land use and land cover change. WMS/WMTS
that you can use to create basemaps from different time points include GeoServer, Planet Monthly,
Planet Daily, Secure Watch, Bing Maps, Mapbox Raster, and Mapbox Static.
1. GeoServer:
i. For GeoServer, how to add different years of imagery depends on your server.
a) If your different years are stored as different layers, alter the GeoServer Layer Name
field when you add the second layer. Make sure your title/attribution/etc. fields are
accurate for the new layer.
b) If your server uses filtering to display imagery from different years you will need to alter
the GeoServerParams field (again, making sure the information in your other fields is
correct).
ii. Once you have decided the best approach for your server, repeat the steps in Part 3 B.1
above for each time period you would like to add.
iii. Note that some years may not contain any imagery, due to the sparseness of the data
within the database. If no imagery for the selected time range appears, you will need to
change your GeoServerParams field, possibly to change the feature profile or date ranges.
2. Planet Monthly, Planet Daily, and Planet NICFI
i. For all Planet products, you simply need to change the time period fields to add layers with
different default time periods. Users will be able to change the time period displayed during
data collection; however, this is the default that will be shown first.
ii. Be sure to change the Title field to reflect the correct default Year, Month, and Day for each
new layer that you add.
3. Secure Watch
i. For this Maxar product, you simply need to change the time period fields to add layers with
different default time periods. Users will be able to change the time period displayed during
data collection; however, this is the default that will be shown first.
ii. Be sure to change the Title field to reflect the correct default Year, Month, and Day for each
new layer that you add.
4. Sentinel 1 & 2
i. Users will be able to change the default Year and Month during data collection.
30ii. However, additional layers with different default years and months can be added based on
user preference.
iii. Be sure to change the Title field to reflect the correct default Year, Month, and Day for each
new layer that you add.
5. GEE Image Asset
i. Different Image Assets that cover different periods of time can be added using the Imagery
interface.
ii. However, if you have multiple images of the same area over different periods of time,
consider using ’sGEE’s ImageCollection functionality rather than multiple Image assets.
6. GEE ImageCollection Asset
i. Users will be able to change the default Year and Month during data collection.
ii. However, additional layers with different default years and months can be added based on
user preference.
iii. Be sure to change the Title field to reflect the correct default Year, Month, and Day for each
new layer that you add.
Editing and deleting imagery
After you have added imagery you may need to change the default dates or the Visualization
Parameters.
1. Navigate to your Institution page.
2. Next to the imagery you would like to edit, there is a editing hand button.
3. When you click on the editing hand button, it will take you back to the imagery creation form.
4. Edit the values as needed, using Section B above as a guide.
5. Check the Add Imagery to All Projects When Saving if you would like to add your imagery to all
of the institution’s projects.
6. When you are done, click Save Imagery Changes.
7. You can delete imagery by clicking the trash can icon next to the imagery name.
31There is currently no way to ‘preview’ what imagery will be visible in
your new layer in the ‘Add Imagery’ workflow. There are two ways to
work around this.
First, if your data source has a data viewing portal, you can use this to
explore the imagery and determine what is available for the time
periods you are interested in.
Second, you can add the imagery layer, then open an existing project
from your institution. The imagery will be available in the dropdown
menu (if you are switching between a project window and an Institution
window, you may need to refresh the project window to get the new
layer to appear). You can then check if the imagery is displaying
correctly and go back to the Institution page to edit the imagery based
on what you see.
Estimating imagery costs
Before setting up a project in CEO, it is important to estimate how much imagery will be used for
budgetary and resource allocation. Here is a quick guide to help.
1. When is imagery used? Imagery data is used whenever there is a map on the page. This means
that on CEO, all these pages can use data:
i. Home
ii. Data Collection
iii. Create Project
iv. Review Project
v. Project Dashboard
vi. GeoDash (specific options or modules)
vii. TimeSync (when implemented)
On these pages, when the map first loads, imagery data is used. Every time a user zooms or pans the
map window, imagery is used. The largest amount of use will probably be with Data Collection.
2. Estimating imagery use for a project:
32i. Each organization that provides imagery sets their own rules for how many tiles you can
download per year given the kind of account that you have with them. Therefore, it is
important to estimate this before setting up a project.
ii. Additionally, services may “count” imagery against your quota differently. For example,
Planet uses a rule “Every Pixel is Charged Once” so you can download a pixel multiple times
but it is only charged once (see here: You will also need to know this.
https://support.planet.com/hc/en-us/articles/360021227554--When-is-a-Planet-product-
charged-against-my-quota-). You will also need to know this.
iii. To figure out how much imagery you are likely to use for a single project, count the number
of plots. Then determine how many users will classify each plot (in CEO this is usually 1 user
per plot currently). Next, try to factor in how often people will zoom or pan their maps for
context when answering the survey questions for a plot. Multiply these numbers together.
iv. Next, decide if you are using the Geo-Dash and ask yourself how many map widgets you will
display on your Geo-Dash page. Multiply that number by the number of plots to get the
amount of Geo-Dash imagery you will need. Keep in mind that Geo-Dash imagery counts
against our annual limit for user memory/processing in GEE, whereas the usual global layers
on CEO (Bing Maps, SecureWatch, Planet) have separate annual tile-based limits. For GEE,
we recommend clipping and pre-processing the imagery to image assets or imageCollection
assets for the collection area. This eliminates processing on-the-fly for each user that is
collecting, as Geo-Dash can just grab the pre-processed image asset.
v. Finally, add a few extra tile downloads for loading the maps while creating and reviewing
the project.
vi. Once you have a sense of how many map images you will need for your project, you will
then need to look up the tile counting policy for the imagery service that you are using. For
example, some of them count 15 tiles as 1 unit of usage. Others use different counting rules.
3. Tip to reduce imagery use: Consider setting your default background imagery to a cheaper
source—like Bing—and only switching to more expensive paid imagery when you are at the
correct zoom level.
33Synthetic Aperture Radar (SAR) data in CEO for forest degradation
Observations of backscatter variations over time in satellite SAR data can be attributed to structure and
moisture. For forests, these can be linked to changes in the moisture conditions of the trees and soil as
well as changes in forest structure. These are extremely useful for e.g. detecting forest degradation.
Color display of SAR data for detecting forest degradation is possible in CEO using Sentinel 1 data, WMS
data, and GEE Image Assets and ImageCollection assets.
For information on detecting forest degradation through our GEE widget functionality, please see Part 4:
E Project options.
For information on detecting forest degradation through our Geo-Dash widget, please see Part 6: I
(Forest) Degradation tool.
For more information on SAR, please see:
1. Kellndorfer, Josef. “Using SAR Data for Mapping Deforestation and Forest Degradation.” SAR
Handbook: Comprehensive Methodologies for Forest Monitoring and Biomass Estimation. Eds.
Flores, A., Herndon, K., Thapa, R., Cherrington, E. NASA. 2019. DOI: . 10.25966/68c9-gw82;
available online at: https://gis1.servirglobal.net/TrainingMaterials/SAR/Ch3-Content.pdf
Also https://www.servirglobal.net/Global/Articles/Article/2674/sar-handbook-comprehensive-
methodologies-for-forest-monitoring-and-biomass-estimation
2. This one pager from SERVIR & SilvaCarbon:
https://servirglobal.net/Portals/0/Documents/Articles/2019_SAR_Handbook/SAR_VegIndices_1
page_new.pdf
34Project Creation
With your imagery loaded, you are ready to create a new project.
Before starting a data collection effort in CEO, make sure you have concrete goals, indicators, and
metrics for your initiative. While this manual focuses on technical issues, other resources are available
to help you create these goals, indicators, and metrics. Some helpful resources include:
• The Road to Restoration: A Guide to Identifying Priorities and Indicators for Monitoring Forest
and Landscape Restoration, found at: http://www.fao.org/in-action/forest-landscape-
restoration-mechanism/resources/detail/en/c/1253837/. This guide from FAO & WRI outlines
steps toward setting goals, choosing indicators, and defining metrics.
If your project is focused on land use or land cover classification, you also need to have a classification
scheme and an interpretation key. A classification scheme should be exhaustive, exclusive, consistent
with the purpose of the work, and sufficiently descriptive. The scheme can be either single level or
hierarchical and it does not need to be of uniform detail. Data collectors refer to an interpretation key—
a collection of rules, imagery, and guidance—to classify land cover elements. A comprehensive
interpretation key allows data collectors to produce more consistent and reliable results.
• See Chapters 2 & 3 of the Theoretical Manual from Collect Earth Online, found at
https://collect.earth/downloads/CEO_Theoretical_Manual.pdf.
Designing a project is an iterative process, and you will probably need to make multiple edits to projects
in CEO as you refine your goals, land use or land cover classification schemes, imagery sources, etc.
These changes can be made to a project before your project is published. This means that you can
create a project and collect test data in it, and edit any errors you find before publishing the project.
Some things can also be changed after a project is published, including imagery. For example, if you
realize after you have created a project that you have forgotten to add an imagery layer, you can add it
after project setup with the steps from Part 3.
The survey questions that are asked about each survey point cannot currently be changed after the
project is published. Do not start data collection until you are sure that your survey questions are
correct.
The instructions below assume you are starting on your Institution page (see directions in Part 2: A.2-4)
and are logged in as an Administrator for your Institution.
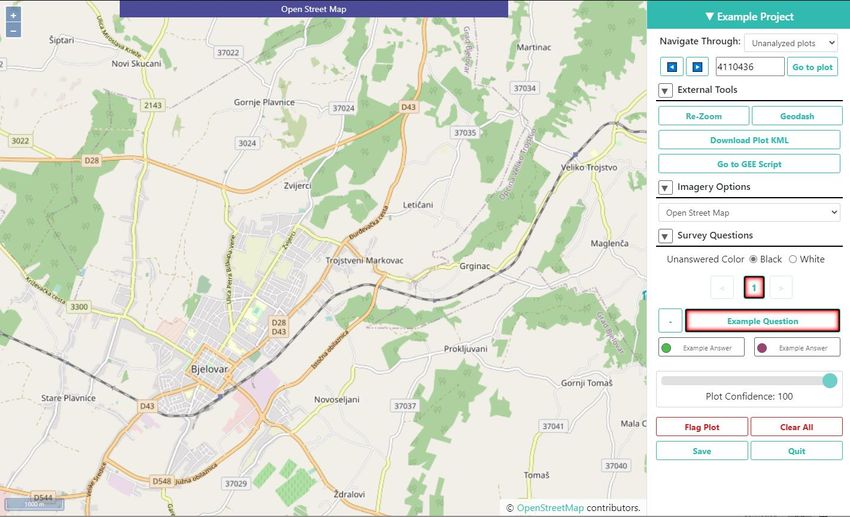
Create a new project (wizard)
1. In the Projects tab on your Institution page, click [Create New Project]. This will bring you to the
Create Project wizard.
35You can also read