INTEGRATED RESOURCE PLAN - OKLAHOMA GAS & ELECTRIC PREPARED 2018 - OGE Energy Corporation
←
→
Page content transcription
If your browser does not render page correctly, please read the page content below
INTEGRATED RESOURCE PLAN
          OKLAHOMA GAS & ELECTRIC

                     PREPARED 2018
                      OGE ENERGY CORP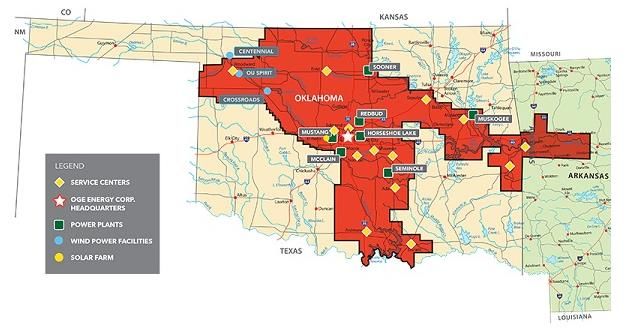

2018 Integrated Resource Plan

EXECUTIVE SUMMARY
OG&E submits this Integrated Resource Plan (IRP) in compliance with requirements
established pursuant to the Oklahoma Corporation Commission’s (OCC) Electric Utility
Rules OAC 165:35-37 and the Arkansas Public Service Commission’s (APSC) Resource
Planning Guidelines for Electric Utilities. This IRP is submitted according to the triennial
schedule established by the OCC and APSC.

OG&E’s minimum planning reserve margin is established in Section 4.1.9 of the SPP
Criteria. The SPP planning reserve margin requirement was lowered in 2017 from the
previous level of 13.6% to 12%. This change results in OG&E having reduced capacity
requirements of approximately 100 MW.

The objective of this IRP is to explore options to maintain OG&E’s generation capability
in accordance with the SPP planning reserve margin requirement of 12% in a manner
that achieves the lowest reasonable costs to customers, improves reliability and
maintains environmental balance. OG&E believes the best way to accomplish this is by
considering a range of capacity options with varying degrees of scalability and timelines.
The company desires fuel diversity by maintaining a reasonable balance among gas, coal
and renewable generation resources while adding advancing technologies as they
become cost effective and environmentally sound. System resiliency, especially near
critical load centers, is also an important consideration for locational benefits realized by
customers.

OG&E’s resource planning process includes collecting information regarding material
assumptions used in the modeling and analysis of potential resource additions. A key
assumption in this IRP is the removal of the company’s existing power purchase
agreement with AES Shady Point and subsequent replacement of an equal amount of
capacity. The company believes this step may reduce customers’ costs. Capacity needs,
beginning in 2019, are shown in the table below:

     OG&E Planning Reserve Margin and Needed Capacity (MW unless noted)
                                          2019 2020 2021 2022 2023
               Total Capacity             6,479 6,359 6,359 6,359 6,359
               Net Demand                 5,934 5,949 6,001 6,031 6,069
               Reserve Margin               9%    7%    6%    5%    5%
               Needed Capacity*             168   305   362   396   438
               *Indicates the capacity needed to restore the reserve margin to 12%.

OG&E considered more than 300,000 portfolios that meet the capacity needs utilizing a
combination of potential future resources of various technology types, sizes and
availability. Although dependent on the value to OG&E customers of existing capacity
available in the market versus new-build cost, the portfolio analysis shows that adding
capacity through a market opportunity, adding solar resources and implementing

                                                 i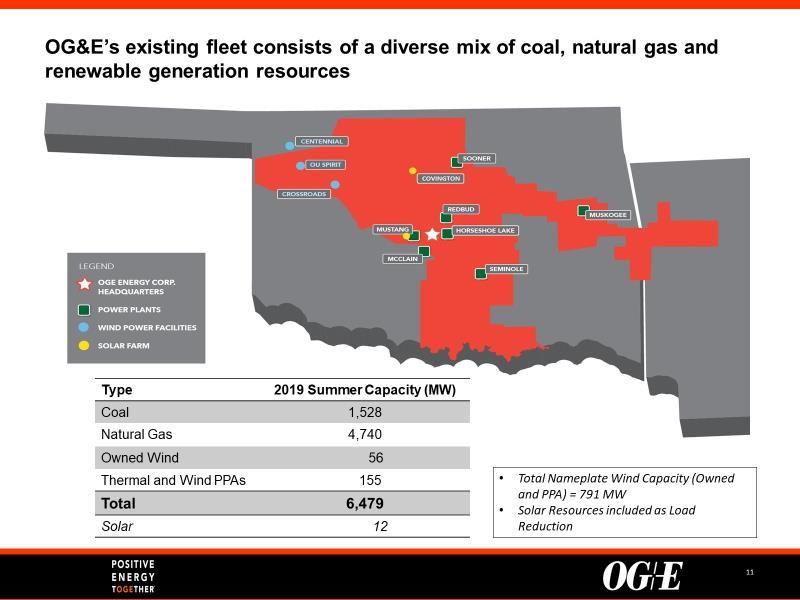
2018 Integrated Resource Plan

improvements to OG&E’s existing combined cycle units result in the lowest customer cost
under the base case assumptions. OG&E plans to issue a Request for Proposal (RFP)
to solicit bids for available resources to satisfy the capacity needs in 2019, 2020 and 2021
and, if needed, upgrade OG&E’s existing combined cycle plants to increase their capacity
by 2023. This plan addresses OG&E’s future requirements in a manner which produces
the lowest reasonable cost and provides the opportunity to mitigate risks.

                                             ii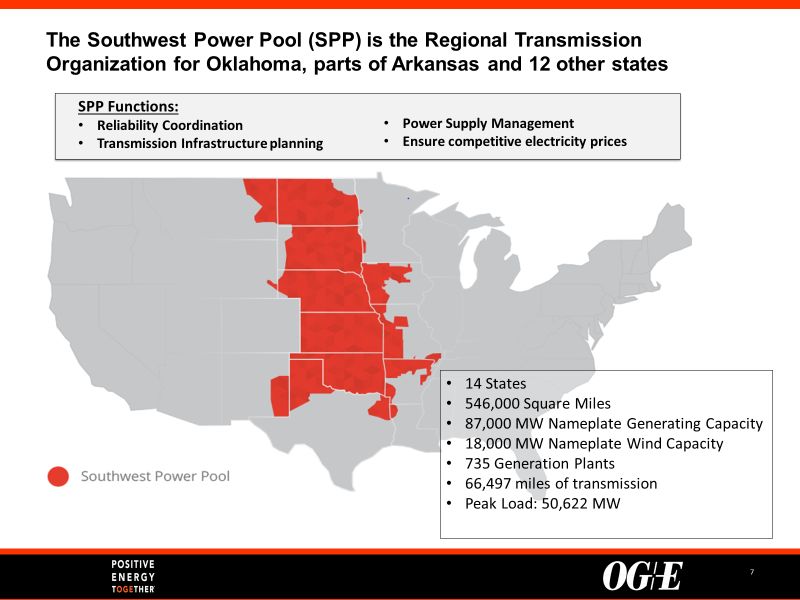
2018 Integrated Resource Plan

Table of Contents
I.         Introduction ............................................................................................................. 1
II.        IRP Objectives and Process.................................................................................... 2
III.       Assumptions............................................................................................................ 3
      A. Load Forecast ....................................................................................................... 3
      B. Generation Resources........................................................................................... 3
        1.  Existing Resources ......................................................................................... 3
         2.       Future Resource Options ................................................................................ 5
      C. Fuel Price Projections............................................................................................ 6
        1.  Scenarios ........................................................................................................ 6
         2.       Sensitivities ..................................................................................................... 7
  D. Integrated Marketplace Locational Marginal Prices ............................................... 8
  E. Environmental Considerations ............................................................................... 9
IV. Resource Planning Modeling and Analysis ........................................................... 10
      A.    Planning Reserve Margin .................................................................................... 10
      B.    Modeling Methodology ........................................................................................ 10
      C.    Portfolio Development ......................................................................................... 11
      D.    Portfolio Analysis ................................................................................................. 12
      E.    Conclusion........................................................................................................... 15
V.         Action Plan ............................................................................................................ 16
VI.        Schedules ............................................................................................................. 17
  A. Electric Demand and Energy Forecast ................................................................ 17
  B. Existing Generation Resources ........................................................................... 18
  C. Transmission Capability and Needs .................................................................... 19
  D. Needs Assessment ............................................................................................. 20
  E. Resource Options ................................................................................................ 20
  F. Fuel Procurement and Risk Management Plan ................................................... 21
  G. Action Plan .......................................................................................................... 21
  H. Requests for Proposals ....................................................................................... 22
  I. Modeling Methodology and Assumptions ............................................................ 22
  J. Transmission System Adequacy ......................................................................... 22
  K. Resource Plan Assessment ................................................................................ 23
  L. Proposed Resource Plan Analysis ...................................................................... 23
  M. Physical and Financial Hedging .......................................................................... 24
VII. Appendices ........................................................................................................... 25

                                                                    iii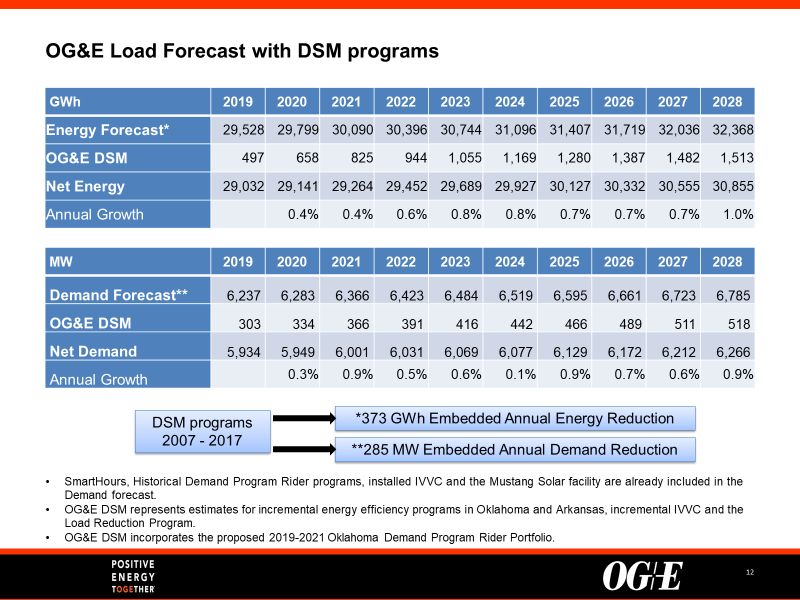
2018 Integrated Resource Plan

List of Figures
Figure 1 – OG&E Service Area ....................................................................................... 1
Figure 2 – Integrated Resource Planning Seven Step Process ...................................... 2
Figure 3 – EIA 2018 Annual Energy Outlook Fuel Projections (Nominal $)..................... 6
Figure 4 – Scenario Fuel Projections .............................................................................. 7
Figure 5 – Natural Gas Sensitivities ................................................................................ 7
Figure 6 – Solar Capital Cost Sensitivities ...................................................................... 8
Figure 7 – Average Annual OG&E Load LMP by Scenario and Sensitivity ..................... 8
Figure 8 – 2019 Projected Monthly OG&E Load LMP Statistics ...................................... 9
Figure 9 – Projected May 2019 OG&E Hourly Load LMPs.............................................. 9
Figure 10 – Customer Cost Components ...................................................................... 11
Figure 11 – Resource Option Availability ...................................................................... 11
Figure 12 – Sensitivity Analysis NPVCC ....................................................................... 14
Figure 13 – Natural Gas Sensitivity NPVCC with Existing Assets ................................. 15

List of Tables
Table 1 – Energy Forecast (GWh) .................................................................................. 3
Table 2 – Demand Forecast (MW) .................................................................................. 3
Table 3 – OG&E Existing Thermal Resources ................................................................ 4
Table 4 – OG&E Existing Renewable Resources ........................................................... 4
Table 5 – Existing Power Purchase Contracts ................................................................ 4
Table 6 – Resource Options in 2018$ ............................................................................. 5
Table 7 – Renewables Nameplate Overnight Cost Projections in 2018$ ($/kW AC) ......... 6
Table 8 – Planning Reserve Margin (MW unless noted) ............................................... 10
Table 9 – Portfolios with Base Case NPVCC in Million $ .............................................. 12
Table 10 – Scenario 30-year NPVCC in Million $ .......................................................... 13
Table 11 – Sensitivity 30-year NPVCC in Million $ ........................................................ 13

                                                          iv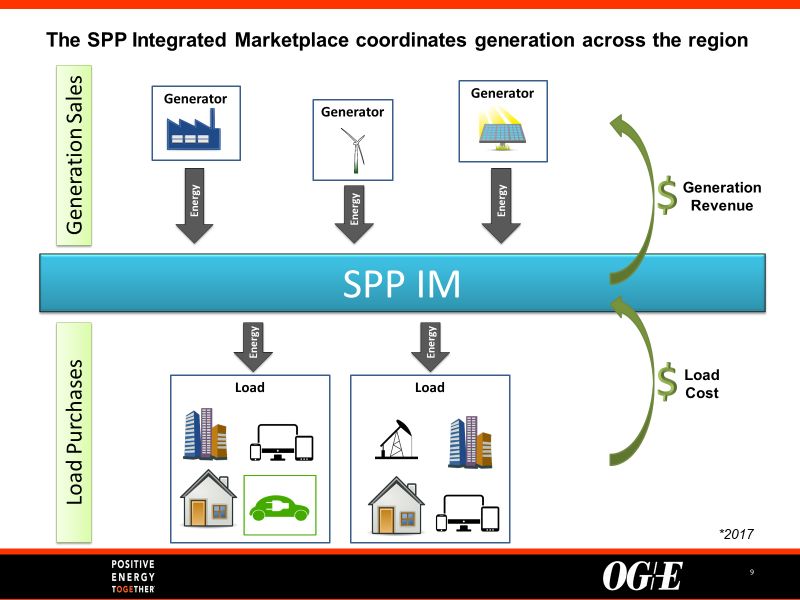
2018 Integrated Resource Plan

List of Acronyms
Acronym     Phrase Represented                               Reference
AGP         Advanced Gas Path                                Technology
APSC        Arkansas Public Service Commission               Agency
CO2         Carbon Dioxide                                   Chemical
CC          Combined Cycle electricity generating unit       Technology
CT          Combustion Turbine electricity generating unit   Technology
DSM         Demand Side Management                           Industry
EE          Energy Efficiency                                OG&E
EIA         Energy Information Administration                Agency
EPA         Environmental Protection Agency                  Agency
FERC        Federal Energy Regulatory Commission             Agency
FIP         Federal Implementation Plan                      EPA
HSL         Horseshoe Lake                                   OG&E
IM          Integrated Marketplace                           SPP
ITP         Integrated Transmission Plan                     SPP
ITP10       ITP 10 Year Assessment                           SPP
ITP20       ITP Long Term 20 Year Assessment                 SPP
ITPNT       ITP Near Term Assessment                         SPP
IVVC        Integrated Volt Var Control                      OG&E
IRP         Integrated Resource Plan                         Industry
LMP         Locational Marginal Price                        SPP
LRP         Load Reduction Program                           OG&E
MATS        Mercury and Air Toxics Standards Rule            EPA
NERC        North American Electric Reliability              Agency
NPVCC       Net Present Value of Customer Cost               OG&E
NTC         Notice to Construct                              SPP
NREL        National Renewable Energy Laboratory             Agency
O&M         Operations & Maintenance                         General
OCC         Oklahoma Corporation Commission                  Agency
OG&E        Oklahoma Gas & Electric                          Agency
PCI         Power Costs Inc.                                 Agency
PI          Plant Improvements                               Technology
PPA         Power Purchase Agreement                         Industry
RFP         Request for Proposal                             General
SPP         Southwest Power Pool                             SPP
STEP        SPP Transmission Expansion Plan                  SPP

                                         v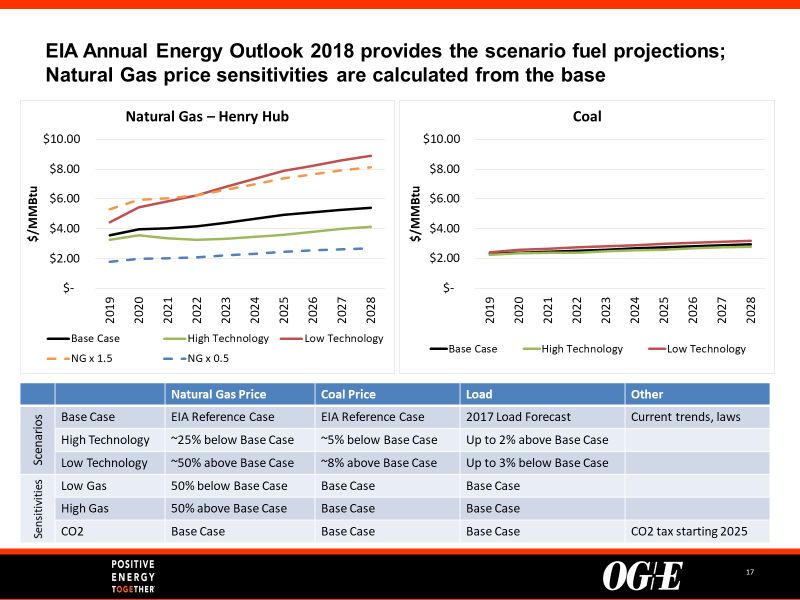
2018 Integrated Resource Plan

I.      Introduction
OG&E was formed in 1902 and is Oklahoma’s oldest and largest investor-owned electric
utility. OG&E serves more than 842,000 customers in 276 towns and cities in a 30,000
square mile area of Oklahoma and western Arkansas. OG&E’s service area is shown in
Figure 1.

                               Figure 1 – OG&E Service Area

This IRP Report and Appendices have been completed following the OCC Electric Utility
Rules and APSC Resource Planning Guidelines for Electric Utilities. Sections II - V
present the IRP objectives and process, assumptions, resource planning modeling and
analysis, and five-year action plan. Section VI concludes the report with the following
schedules as prescribed by Oklahoma Corporation Commission rule OAC 165:35-37-
4(c):

     A. Electric demand and energy forecast
     B. Forecast of capacity and energy contributions from existing and committed supply-
        and demand-side resources
     C. Description of transmission capabilities and needs covering the forecast period
     D. Assessment of the need for additional resources
     E. Description of the supply, demand-side and transmission options available to the
        utility to address the identified needs
     F. Fuel procurement plan, purchased power procurement plan, and risk management
        plan
     G. Action plan identifying the near-term (i.e., across the first five (5) years) actions
     H. Proposed RFP(s) documentation, and evaluation
     I. Technical appendix for the data, assumptions and descriptions of models
     J. Description and analysis of the adequacy of its existing transmission system
     K. Assessment of the need for additional resources to meet reliability, cost and price,
        environmental or other criteria
     L. An analysis of the utility’s proposed resource plan
     M. Description and analysis of the utility’s consideration of physical and financial
        hedging to determine the utility’s ability to mitigate price volatility

                                              1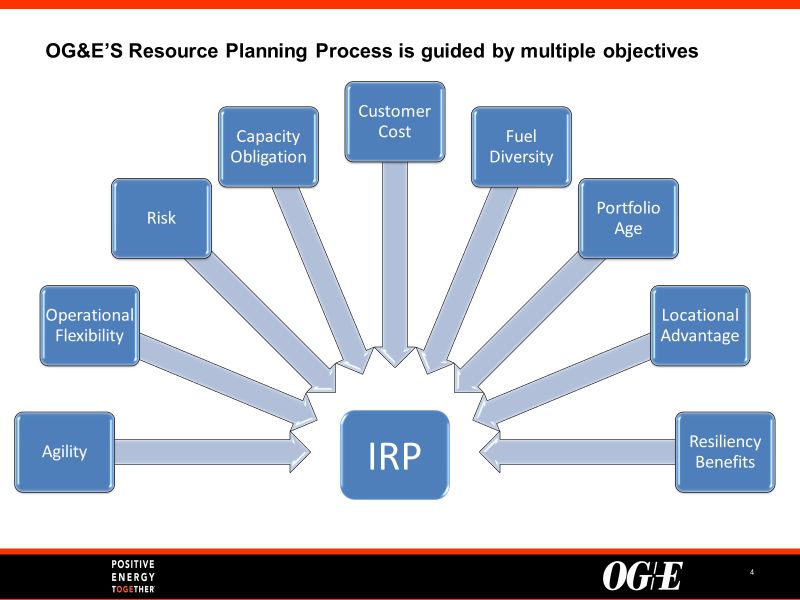
2018 Integrated Resource Plan

II.      IRP Objectives and Process

OG&E strives to develop a resource plan that will allow it to meet its capacity obligations
over the planning horizon at the lowest reasonable cost with due consideration of the
uncertainties attributable to many of the planning assumptions and other items of value
to OG&E customers. The objectives below are relied upon to identify the best future
portfolio.

      1. Capacity Obligation: satisfy SPP’s planning reserve margin requirements
      2. Operational Flexibility: maintain or increase the ability of OG&E’s portfolio to
         respond at SPP’s direction to localized reliability issues
      3. Expected Cost to Consumers: lowest reasonable Net Present Value of Customer
         Cost (NPVCC) subject to satisfying other IRP objectives
      4. Exposure to Risks: consider the sensitivity of NPVCC related to risks that affect
         customer cost and benefits, including uncertain future prices of fuel and emissions,
         as well as other potential risks
      5. Agility: Consider a range of capacity options with varying degrees of scalability and
         differing implementation timelines
      6. Fuel Diversity: maintain a reasonable balance among natural gas, coal and
         economically viable renewable, energy storage and demand-side resources
      7. Portfolio Age: maintain a reasonable balance of resources as measured by
         expected remaining asset life
      8. Locational Advantage: increase the reliability and resiliency of OG&E’s distribution
         system
      9. Resiliency Benefits: maintain generation capability to minimize disruptions

OG&E’s seven-step Integrated Resource Planning process remains largely unchanged
from previous IRPs and is illustrated in Figure 2.

                 Figure 2 – Integrated Resource Planning Seven Step Process

                                              Develop
                               Determine                    Perform       Interpret
                                            Models and
  Define IRP       Collect     Needs and                   Uncertainty    Data and     Develop IRP
                                              Perform
  Objective     Assumptions     Potential                 and Scenario      Draw         Report
                                             Computer
                               Additions                    Analysis     Conclusions
                                            Simulations

                                                2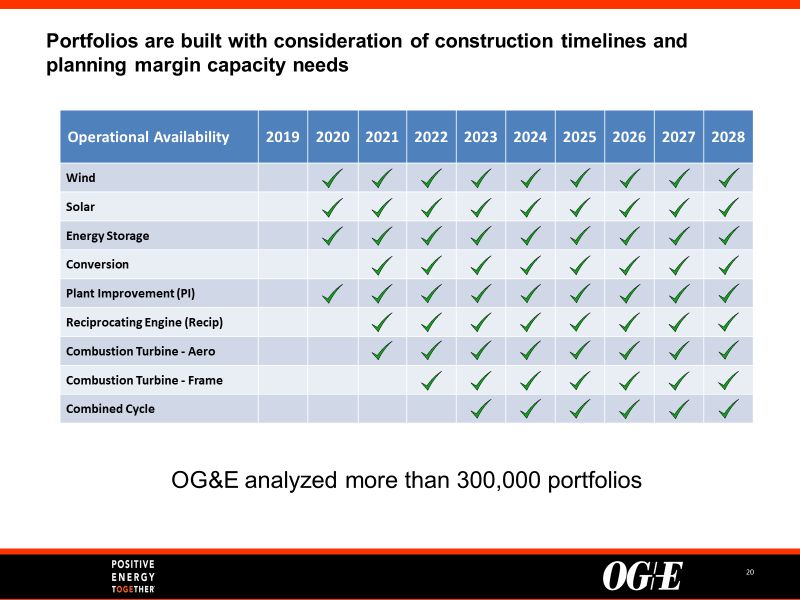
2018 Integrated Resource Plan

    III.     Assumptions
    OG&E’s resource planning process includes collecting information regarding material
    assumptions used in the modeling and analysis of potential resource additions.

        A.   Load Forecast
    The retail energy forecast is based on retail sector-level econometric models representing
    weather, growth and economic conditions in OG&E’s Oklahoma and Arkansas service
    territories. The peak demand forecast relies on an hourly econometric model. Historical
    and forecast weather-adjusted retail energy sales are the main driver for the peak
    demand forecast projections. The peak demand forecast is reduced by planned OG&E
    Demand Side Management (DSM) programs to determine the net demand used for
    planning purposes. Peak demand and energy forecasts are provided in Section VI under
    Schedule A.

                                         Table 1 – Energy Forecast (GWh)
                              2019     2020   2021    2022    2023   2024           2025      2026     2027       2028
                  1,2
Energy Forecast           29,528       29,799   30,090   30,396   30,744   31,096   31,407   31,719    32,036    32,368
OG&E DSM3,4                  497          658      825      944    1,055    1,169    1,280    1,387     1,482     1,513
Net Energy                29,032       29,141   29,264   29,452   29,689   29,927   30,127   30,332    30,555    30,855

                                         Table 2 – Demand Forecast (MW)
                                2019     2020 2021 2022 2023 2024                   2025     2026     2027      2028
                        1,2
  Demand Forecast               6,237 6,283 6,366 6,423 6,484 6,519 6,595 6,661 6,723 6,785
  OG&E DSM3,4                     303   334   366   391   416   442   466   489   511   518
  Net Demand                    5,934 5,949 6,001 6,031 6,069 6,077 6,129 6,172 6,212 6,266

        B.   Generation Resources
    OG&E remains obligated to comply with SPP Planning Reserve Margin requirements by
    maintaining capacity sufficient to serve its peak load requirements and a planning
    reserve. This is accomplished through OG&E-owned generation, existing power
    purchase agreements or, if necessary, potential new resources.

       1. Existing Resources
    OG&E’s existing portfolio of electric generating facilities consists of owned thermal
    generation, owned renewable resources and several power purchase contracts as
    presented in the following three tables.

    1 SmartHours, Historical Demand Program Rider programs, installed IVVC and the Mustang Solar facility
    are already included in the Energy and Demand forecasts.
    2 Competitive new load larger than 1 MW outside of OG&E service territory is included.
    3 Represents estimates for incremental energy efficiency programs in Oklahoma and Arkansas, incremental

    IVVC and the Load Reduction Program.
    4 DSM incorporates the proposed 2019-2021 Oklahoma Demand Program Rider Portfolio.

                                                            3
2018 Integrated Resource Plan
Table 3 – OG&E Existing Thermal Resources
First Year In Summer
Unit Type Unit Name
Service Capacity (MW)
Muskogee 6 1984 518
Coal Fired Steam
Sooner 1 1979 505
(1,528 MW)
Sooner 2 1980 505
Muskogee 4 1977 490
Muskogee 5 1978 490
Horseshoe Lake 6 1958 167
Gas Fired Steam Horseshoe Lake 7 1963 214
(3,195 MW) Horseshoe Lake 8 1969 397
Seminole 1 1971 475
Seminole 2 1973 480
Seminole 3 1975 482
5
Combined Cycle McClain 2001 380
(994 MW) Redbud 2002 614
Horseshoe Lake 9 2000 44
Horseshoe Lake 10 2000 43
Tinker (Mustang 5A) 1971 33
Tinker (Mustang 5B) 1971 32
Combustion Mustang 6 2018 57
Turbine Mustang 7 2018 57
(551 MW) Mustang 8 2018 57
Mustang 9 2018 57
Mustang 10 2018 57
Mustang 11 2018 57
Mustang 12 2018 57
Table 4 – OG&E Existing Renewable Resources
First Year Nameplate Summer
Unit Type Unit Name
In Service Capacity (MW) Capacity (MW)
Centennial 2006 120 16
Wind
OU Spirit 2009 101 9
(56 MW)
Crossroads 2012 228 31
Solar Mustang 2015 3 3
(12 MW)6 Covington 2018 9 9
Table 5 – Existing Power Purchase Contracts
First Year Nameplate Summer
Unit Name Capacity (MW)
In Service Capacity (MW)
Keenan 2010 152 18
Power Purchase Taloga 2011 130 7
(155 MW) Blackwell 2012 60 10
Oklahoma Cogen 1989 120 120
5 Represents OG&E owned interest: 77% of McClain and 51% of Redbud.
6 Solar is connected to distribution and is embedded in the Net Demand Forecast.
42018 Integrated Resource Plan
OG&E has exercised its option on its purchase power agreement with AES Shady Point,
effective January 2019. OG&E believes it may reduce customers’ costs by replacing it
with an equal amount of capacity.
2. Future Resource Options
OG&E contracted with Burns & McDonnell to provide cost and performance estimates for
combined cycle (CC) and simple cycle technologies like combustion turbines (CT) and
reciprocating engines (Recip). This also included an option to add the necessary
components to OG&E’s existing Horseshoe Lake units 9 & 10 to convert them to a
combined cycle unit. Additionally, there are plant improvements that can be made at the
Redbud and McClain combined cycle plants. The cost estimates for Wind and Solar are
from the National Renewable Energy Lab’s (NREL) and the estimate for batteries is from
U.S. Energy Information Administration’s (EIA) 2018 Annual Energy Outlook 7. The
potential additional resource options are shown in Table 6.
Table 6 – Resource Options in 2018$
Nameplate Summer Fixed Variable
Nameplate Overnight Peak O&M O&M
Capacity Capital Cost Capacity Cost Cost
Technology Description (MW) ($/kW) (MW) ($/kW) ($/MWh)
Wind8 250 $1,640 50 $33.50 N/A
Batteries Lithium Ion 100 $2,190 100 $36.30 N/A
Solar9 Photovoltaic Single Axis 100 $1,460 80 $20.50 N/A
Conversion Horseshoe Lake CC 80 $2,510 80 $8.40 -$1.10
Plant Improve- McClain 42 $880 42 $1.70 N/A
ment (PI) Redbud 60 $800 60 $1.80 N/A
Reciprocating Recip Engine Single 6 $2,130 6 $18.10 $5.30
Engine Recip Engine Multiple 49 $1,540 49 $17.30 $4.10
LMS100 105 $1,400 93 $2.90 $1.80
CT Aero
Trent 60 SCGT 66 $780 57 $4.50 $1.10
5000F SCGT 245 $560 222 $3.00 $0.90
CT Frame
G/H Class 268 $730 244 $3.50 $1.50
7EA 96 $1,060 78 $6.60 $0.90
2x1 8000H 1,066 $680 989 $2.50 $1.90
Combined 1x1 HA.02 Fired 610 $840 571 $3.80 $2.00
Cycle (CC) 1x1 HA.02 497 $950 462 $3.80 $2.00
2X1 GE 7FA.05 Fired 885 $740 845 $2.40 $1.90
2X1 GE 7FA.05 714 $850 684 $2.40 $1.90
OG&E has been monitoring the prices for solar and wind resources over the last few
years and relies on the NREL10 estimates which show both solar and wind costs will
continue to decrease over the next decade. NREL’s mid-range price projections for utility
scale solar and wind are shown in Table 7.
7 https://www.eia.gov/outlooks/aeo/
8 Wind accredited peak capacity is assumed to be 20% of nameplate capacity
9 Solar accredited peak capacity is assumed to be 80% of nameplate capacity
10 https://atb.nrel.gov/electricity/2017/index.html?t=su, https://atb.nrel.gov/electricity/2017/index.html?t=lw
52018 Integrated Resource Plan
Table 7 – Renewables Nameplate Overnight Cost Projections in 2018$ ($/kWAC)
2018 2019 2020 2021 2022 2023 2024 2025 2026 2027 2028
Solar $1,460 $1,410 $1,330 $1,320 $1,300 $1,280 $1,270 $1,250 $1,240 $1,220 $1,200
Wind $1,640 $1,620 $1,610 $1,600 $1,590 $1,580 $1,560 $1,550 $1,540 $1,520 $1,510
C. Fuel Price Projections
OG&E utilizes the fuel price projections provided in the EIA 2018 Annual Energy Outlook
(AEO)11. EIA’s models consider macroeconomic growth, world oil prices, technological
progress, and energy policies to provide price projections for the U.S. The AEO
“Reference Case” reflects current market conditions, laws and regulations and is the
foundation for OG&E’s Base Case in this IRP. Figure 3 provides the 2018 Annual Energy
Outlook’s Henry Hub Natural Gas price assumption and the U.S. average coal price for
the next ten years.
Figure 3 – EIA 2018 Annual Energy Outlook Fuel Projections (Nominal $)
$6.00
$5.00
$/MMBTU
$4.00
$3.00
$2.00
$1.00
$-
2019 2020 2021 2022 2023 2024 2025 2026 2027 2028
Natural Gas - HH $3.55 $3.96 $4.02 $4.16 $4.42 $4.66 $4.93 $5.10 $5.28 $5.42
Coal $2.31 $2.40 $2.46 $2.51 $2.58 $2.68 $2.76 $2.83 $2.90 $2.96
1. Scenarios
The 2018 Annual Energy Outlook provides several scenarios to account for uncertainties
around trends in technology improvements, economic performance, commodity prices,
legislation, regulation or energy policies. The Low and High Oil and Gas Resource and
Technology cases provide the largest variation in commodity prices while also changing
load projections. The commodity prices for these scenarios are provided in Figure 4.
11 https://www.eia.gov/outlooks/aeo/
62018 Integrated Resource Plan
Figure 4 – Scenario Fuel Projections
$9.00
$8.00
Low Technology
$7.00
$6.00 Base Case
$/MMBtu
$5.00
High Technology
$4.00
$3.00
$2.00
$1.00
$-
2019
2020
2021
2022
2023
2024
2025
2026
2027
2028
2019
2020
2021
2022
2023
2024
2025
2026
2027
2028
Natural Gas Prices Coal Prices
2. Sensitivities
Sensitivity analysis involves changing a single input variable of the Base Case and
measures the impact of the change in that specific variable. Sensitivity analysis was
conducted that contemplates changes to natural gas prices, solar capital costs and
adding a CO2 tax. Two sensitivity cases measure the impact of changing natural gas
prices and are shown in Figure 5.
Figure 5 – Natural Gas Sensitivities
$9.00
$8.00
1.5x Natural Gas
$7.00
$6.00
$/MMBtu
$5.00 Base Case
Natural Gas
$4.00
$3.00
0.5x Natural Gas
$2.00
$1.00
$-
2019
2020
2021
2022
2023
2024
2025
2026
2027
2028
Solar prices have declined markedly in recent years. Projections of solar capital costs
going forward will impact the viability of solar resources in any generation portfolio. A
range of potential future solar capital costs from NREL is shown in Figure 6.
72018 Integrated Resource Plan
Figure 6 – Solar Capital Cost Sensitivities
$/Nameplate kW AC in 2018 $ $2,500
$2,000
NREL High Solar
Cost Projection
$1,500
NREL Mid Solar
$1,000 Cost Projection
NREL Low Solar
$500 Cost Projection
$0
2019
2020
2021
2022
2023
2024
2025
2026
2027
2028
A third sensitivity added a cost of $20 per ton of CO2 to electric generation plants starting
in 2025 and escalating by 2.5% each year afterward.
D. Integrated Marketplace Locational Marginal Prices
Hourly Locational Marginal Prices (LMPs) for both generation and load are established
through the Integrated Marketplace (IM). As a result, in order to evaluate new generation
resources in the IRP, it is necessary to project the market prices for the region that will
apply to electricity generated by OG&E units and to purchases from the market to serve
OG&E’s load. OG&E utilizes ABB PROMOD IV, an electric market simulation tool which
incorporates generating unit operating characteristics, transmission grid topology and
constraints, to estimate future nodal energy prices in the SPP IM. Market conditions such
as availability of diverse generation resources, fuel pricing and emission costs impact
market pricing. The resulting average annual OG&E Load LMPs for all scenarios and
sensitivities are provided in Figure 7.
Figure 7 – Average Annual OG&E Load LMP by Scenario and Sensitivity
$80
Low Technology
$70 Scenario
$60 CO2 Sensitivity
$50
1.5x Gas
$/MWH
$40 Sensitivity
$30 Base Case
$20
High Technology
$10 Scenario
$- 0.5x Gas
Sensitivity
2019
2020
2021
2022
2023
2024
2025
2026
2027
2028
2029
2030
2031
2032
2033
2034
2035
2036
2037
2038
82018 Integrated Resource Plan
Figure 8 shows the seasonality and variability of hourly LMPs throughout a year assuming
base case gas prices.
Figure 8 – 2019 Projected Monthly OG&E Load LMP Statistics
$80
$70
$60
$50
$/MWH
Maximum
$40
$30 Average
$20
Minimum
$10
$0
Jan Feb Mar Apr May Jun Jul Aug Sep Oct Nov Dec
Figure 9 below shows the volatility in projected hourly LMPs for the month of May 2019
assuming base case gas prices.
Figure 9 – Projected May 2019 OG&E Hourly Load LMPs
$50
$45
$40
$35
$/MWH
$30
$25
$20
$15
$10
$5
$0
50
0
650
100
150
200
250
300
350
400
450
500
550
600
700
Hours
E. Environmental Considerations
The activities of the Company are subject to numerous complex federal, state and local
laws and regulations relating to environmental protection, such as air quality, water
quality, waste management, wildlife conservation, and natural resources. Previous
resource plans identified OG&E’s actions to comply with EPA’s Mercury and Air Toxics
Standards (MATS) rule and Regional Haze Rule Federal Implementation Plan (FIP).
While environmental laws and regulations have the potential to change, the ultimate
scope, timing and impact of potential changes on OG&E's resources cannot be
determined with certainty at this time. OG&E continues to monitor developments in
environmental policy, legislation and regulation, however only known and measurable
regulations are included in its base assumptions for this resource plan.
92018 Integrated Resource Plan
IV. Resource Planning Modeling and Analysis
This section explains the amount and timing of OG&E’s future incremental capacity
needs, the modeling and analysis steps utilized to identify the lowest reasonable
customer cost plan for satisfying those needs and the risks considered.
A. Planning Reserve Margin
The SPP IM does not operate a capacity market in contrast to certain other regions.
OG&E continues to have responsibility for ensuring that it has planning capacity sufficient
to serve its peak load requirements and a planning reserve margin. OG&E’s minimum
12% planning reserve margin is established in Section 4.1.9 of the SPP Planning Criteria.
OG&E’s annual projection of the planning reserve margin is shown in Table 8.
Table 8 – Planning Reserve Margin (MW unless noted)
2019 2020 2021 2022 2023 2024 2025 2026 2027 2028
Owned
6,324 6,324 6,324 6,324 6,324 6,157 6,157 6,092 6,092 6,092
Capacity
Purchase
Capacity 155 35 35 35 35 35 35 35 35 35
Contracts
Total
6,479 6,359 6,359 6,359 6,359 6,192 6,192 6,127 6,127 6,127
Capacity
Demand
6,237 6,283 6,366 6,423 6,484 6,519 6,595 6,661 6,723 6,785
Forecast
OG&E
Demand 303 334 366 391 416 442 466 489 511 518
DSM
Net
5,934 5,949 6,001 6,031 6,069 6,077 6,129 6,172 6,212 6,266
Demand
Reserve
Margin 9% 7% 6% 5% 5% 2% 1% -1% -1% -2%
Margin12
Needed
Needs 168 305 362 396 438 615 673 786 831 892
Capacity
Planned AES OK Cogen HSL 6 Tinker Units
Capacity Contract Contract Retirement Retirement
Reductions (320 MW) (120 MW) (167 MW) (65 MW)
B. Modeling Methodology
OG&E relies on the ABB PROMOD IV software to model hourly nodal LMPs. The PCI
GenTrader® software then uses these LMPs to determine production costs and market
revenues for the generators. A revenue requirement model combines all the cost
components into the estimated 30-year net present value of customer costs (NPVCC), as
illustrated in Figure 10.
12 Reserve Margin % = ((Total Net Capacity) - (Net System Demand)) / Net System Demand
102018 Integrated Resource Plan
Figure 10 – Customer Cost Components
Return on Rate Base Expenses Net Production Cost
Fuel
Capital Investment Depreciation Variable O&M
Emissions
Accumulated Customer
Depreciation Ad Valorem Energy Cost
Purchased for
Accumulated Load
Deferred Income Fixed O&M Less: Market
Tax Sales Revenue
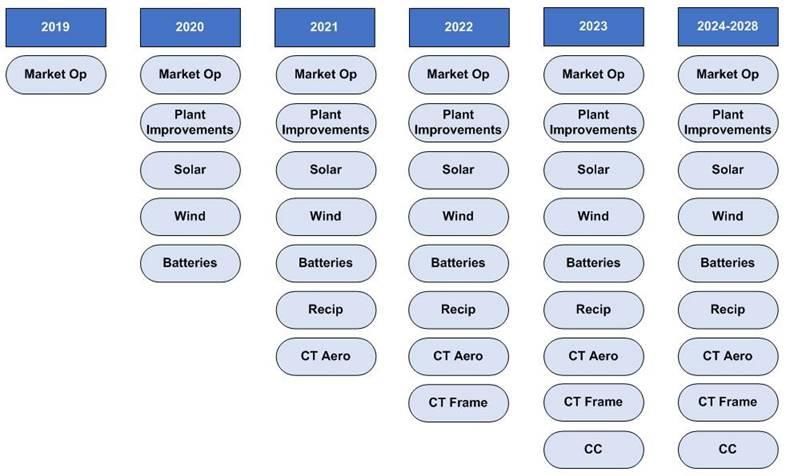
C. Portfolio Development
Developing portfolios considers the construction time of the resource options to determine
the earliest possible in-service date for each resource type. Figure 11 reflects the
resource availability schedule.
Figure 11 – Resource Option Availability
These resources are then arranged into portfolios to meet the needed capacity per the
SPP planning reserve requirements. OG&E analyzed more than 300,000 portfolios.
Table 9 shows the overall least cost portfolio along with the least cost portfolio for each
112018 Integrated Resource Plan
of the resource options. The table also provides the incremental 30-year NPVCC of each
portfolio under the base case assumptions. OG&E’s 2019 capacity need can likely only
be met by a market opportunity. OG&E plans to explore and analyze market
opportunities13 through an RFP process. For analysis purposes, the market opportunity
in all portfolios includes 320 MW of replacement capacity at zero cost.
Table 9 – Portfolios with Base Case NPVCC in Million $
Portfolio
2019 2020 2021 2022 2023 2024 2025 2026 2027 2028 NPVCC
Name
Market
Solar, PI Solar PI Solar Solar Solar $261
Op. 80 MW 44 MW 240 MW 160 MW 80 MW
320 MW
Market
Solar Solar Solar Solar Solar Solar Solar Solar $270
Op. 80 MW 80 MW 160 MW 80 MW 80 MW 80 MW 80 MW
320 MW
Solar, CT Market CT
Solar Solar Solar Solar Solar $278
Aero Op. 80 MW Aero 160 MW 80 MW 160 MW 80 MW
320 MW 57 MW
Solar, CT Market CT
Solar Solar Solar Solar $292
Frame Op. 80 MW Frame 80 MW 160 MW 80 MW
320 MW 222 MW
Solar, Market
Solar Recip Solar Solar Solar $317
Recip Op. 80 MW 49 MW 240 MW 160 MW 80 MW
320 MW
PI, CT Market CT CT CT
Aero, CT PI PI $339
Op. 44 MW Aero 28 MW Frame Frame
Frame 320 MW 57 MW 222 MW 222 MW
PI, CT Market CT CT CT
PI PI $387
Frame Op. 44 MW 42 MW Frame Frame Frame
320 MW 222 MW 222 MW 78 MW
Market
Solar, CC Solar CC $434
Op. 80 MW 571 MW
320 MW
Solar, Market
Battery Solar Bat Solar Solar Solar Solar Solar $457
Op. 80 MW 100 MW 160 MW 80 MW 80 MW 80 MW 80 MW
(Bat) 320 MW
Solar, Market
Solar Wind Solar Solar Solar $466
Wind Op. 80 MW 50 MW 240 MW 160 MW 80 MW
320 MW
D. Portfolio Analysis
Each portfolio is assessed under the base case assumptions and projections while also
considering the sensitivity of NPVCC related to uncertain future fuel, emissions prices
and solar prices. Scenario analysis changes multiple assumptions in the base case.
OG&E used the 2018 Annual Energy Outlook’s Low and High Oil and Gas Resource and
Technology cases which adjusted commodity prices along with load projections. Testing
13 Market opportunity could include any capacity resource type: coal, natural gas, wind, solar etc.
122018 Integrated Resource Plan
the performance of each portfolio in these scenarios offers insights to which technologies
respond to various conditions and the value of portfolio diversity.
Table 10 – Scenario 30-year NPVCC in Million $
Portfolio Name Base High Tech Low Tech
Solar, PI $261 $378 -$8
Solar $270 $406 -$35
Solar, CT Aero $278 $396 $12
Solar, CT Frame $292 $374 $105
Solar, Recip $317 $436 $47
PI, CT Aero, CT Frame $339 $334 $333
PI, CT Frame $387 $382 $380
Solar, CC $434 $409 $367
Solar, Battery (Bat) $457 $585 $166
Solar, Wind $466 $627 $113
Sensitivity analysis involves changing a single input variable of the base case and
measures the impact on the NPVCC. The variables changed in the sensitivity analyses
are the natural gas prices, adding a CO2 price and solar capital cost.
Table 11 – Sensitivity 30-year NPVCC in Million $
Low High
Low High
Portfolio Name Base CO2 Solar Solar
Gas Gas
Cost Cost
Solar, PI $261 $451 $42 $65 $130 $629
Solar $270 $492 $22 $58 $119 $690
Solar, CT Aero $278 $469 $61 $91 $146 $644
Solar, CT Frame $292 $419 $139 $162 $199 $548
Solar, Recip $317 $511 $98 $130 $185 $684
PI, CT Aero, CT Frame $339 $313 $331 $323 $339 $339
PI, CT Frame $387 $362 $378 $368 $387 $387
Solar, CC $434 $330 $374 $241 $417 $489
Solar, Battery (Bat) $457 $662 $219 $280 $326 $821
Solar, Wind $466 $730 $186 $151 $334 $833
As shown in the Fuel Projections and LMP Assumptions sections, LMPs are largely
influenced by changes in natural gas prices. Risks related to changes in natural gas
prices and therefore, LMPs, are more pronounced for portfolios with a high level of
renewable resources as compared to portfolios primarily consisting of natural gas-fired
resources. Customers realize a benefit from renewable resources through LMPs and a
large difference in LMPs in the sensitivity analysis produces a large risk range due to
these prices. The risk range of the capital cost of solar only impacts the portfolios with
solar. The risk ranges from Table 11 are presented in Figure 12.
132018 Integrated Resource Plan
Figure 12 – Sensitivity Analysis NPVCC
Natural Gas NPVCC in Million $
$- $100 $200 $300 $400 $500 $600 $700 $800 $900
Solar, PI
Solar
Solar, CT Aero
Solar, CT Frame
Solar, Recip
PI, CT Aero, CT Frame
PI, CT Frame
Solar, CC
Solar, Battery (Bat)
Solar, Wind
High Gas Base Low Gas
CO2 $- $100 $200 $300 $400 $500 $600 $700 $800 $900
Solar, PI
Solar
Solar, CT Aero
Solar, CT Frame
Solar, Recip
PI, CT Aero, CT Frame
PI, CT Frame
Solar, CC
Solar, Battery (Bat)
Solar, Wind
CO2 Base
Solar Cost $- $100 $200 $300 $400 $500 $600 $700 $800 $900
Solar, PI
Solar
Solar, CT Aero
Solar, CT Frame
Solar, Recip
PI, CT Aero, CT Frame
PI, CT Frame
Solar, CC
Solar, Battery (Bat)
Solar, Wind
Low Solar Cost Base High Solar Cost
142018 Integrated Resource Plan
Risks related to changes in natural gas prices are less pronounced when the NPVCC of
each portfolio is combined with the NPVCC of OG&E’s existing generation units as shown
in Figure 13.
Figure 13 – Natural Gas Sensitivity NPVCC with Existing Assets
NPVCC in Million $
$12,000 $14,000 $16,000 $18,000 $20,000 $22,000
Solar, PI
Solar
Solar, CT Aero
Solar, CT Frame
Solar, Recip
PI, CT Aero, CT Frame
PI, CT Frame
Solar, CC
Solar, Battery (Bat)
Solar, Wind
High Gas Base Low Gas
E. Conclusion
OG&E will have capacity needs beginning in 2019 due to exercising its option on the AES
Shady Point power purchase agreement. OG&E plans to replace the capacity and provide
customer savings by conducting an RFP process. After OG&E replaces the capacity
through a market opportunity the next capacity need will be in 2021.
To determine the best portfolio of assets OG&E analyzed of a wide variety of potential
new resources to meet its future capacity needs and plans to issue an RFP for new or
existing resources. The portfolio analysis shows that the most likely new resource
providing the lowest cost would be solar resources and implementing improvements to
OG&E’s existing combined cycle units result in the lowest customer cost under the base
case assumptions. The risk analysis presented in this 2018 IRP indicates that certain
future market conditions related to fuel prices, electricity prices and resource capital costs
have the potential to impact customer costs. This plan addresses OG&E’s future
requirements in the lowest reasonable cost manner and provides the opportunity to
mitigate customer risks by further diversifying OG&E’s portfolio.
152018 Integrated Resource Plan
V. Action Plan
The Five-Year Action Plan outlined below identifies the steps OG&E will take to address
its capacity needs from 2019-2023.
1) OG&E will issue an RFP for capacity resources, including fossil fuel-fired
resources, solar resources and energy storage resources with a delivery date
beginning in 2019, 2020 and/or 2021.
2) Complete the RFP analysis, select capacity and satisfy the capacity need.
162018 Integrated Resource Plan
VI. Schedules
This section is intended to provide a summary of each section as described in the OCC’s
Electric Utility Rules, Subchapter 37 of Chapter 35, section 4 (c).
A. Electric Demand and Energy Forecast
The retail energy forecast is based on retail sector-level econometric models representing
weather, growth and economic conditions in OG&E’s Oklahoma and Arkansas service
territories. The peak demand forecast relies on an hourly econometric model. Historical
and forecast weather-adjusted retail energy sales are the main driver for the peak
demand forecast projections. The peak demand forecast is reduced by planned OG&E
DSM programs to determine the net demand used for planning purposes as shown in the
figure below.
OG&E DSM Impact on Demand Forecast
6,800
6,600
6,400
MW
6,200
6,000
5,800
2019 2020 2021 2022 2023 2024 2025 2026 2027 2028
OGE DSM Programs Demand Forecast Net Demand Forecast
Energy Sales Forecast (GWh)
2019 2020 2021 2022 2023 2024 2025 2026 2027 2028
14,15
Energy Forecast 29,528 29,799 30,090 30,396 30,744 31,096 31,407 31,719 32,036 32,368
OG&E DSM16,17 497 658 825 944 1,055 1,169 1,280 1,387 1,482 1,513
Net Energy 29,032 29,141 29,264 29,452 29,689 29,927 30,127 30,332 30,555 30,855
Peak Demand Forecast (MW)
2019 2020 2021 2022 2023 2024 2025 2026 2027 2028
Demand Forecast14,15 6,237 6,283 6,366 6,423 6,484 6,519 6,595 6,661 6,723 6,785
OG&E DSM16,17 303 334 366 391 416 442 466 489 511 518
Net Demand 5,934 5,949 6,001 6,031 6,069 6,077 6,129 6,172 6,212 6,266
14 SmartHours, Historical Demand Program Rider programs, installed IVVC and the Mustang Solar facility
are already included in the Energy and Demand forecasts.
15 Competitive new load larger than 1 MW outside of OG&E service territory is included.
16 Represents estimates for incremental energy efficiency programs in Oklahoma and Arkansas,
incremental IVVC and the Load Reduction Program.
17 DSM incorporates the proposed 2019-2021 Demand Program Rider Portfolio
172018 Integrated Resource Plan
B. Existing Generation Resources
This schedule provides a summary of existing resources.
OG&E Existing Thermal Resources
First Year In Summer
Unit Type Unit Name
Service Capacity (MW)
Muskogee 6 1984 518
Coal Fired Steam
Sooner 1 1979 505
(1,528 MW)
Sooner 2 1980 505
Muskogee 4 1977 490
Muskogee 5 1978 490
Horseshoe Lake 6 1958 167
Gas Fired Steam Horseshoe Lake 7 1963 214
(3,195 MW) Horseshoe Lake 8 1969 397
Seminole 1 1971 475
Seminole 2 1973 480
Seminole 3 1975 482
Combined Cycle18 McClain 2001 380
(994 MW) Redbud 2002 614
Horseshoe Lake 9 2000 44
Horseshoe Lake 10 2000 43
Tinker (Mustang 5A) 1971 33
Tinker (Mustang 5B) 1971 32
Combustion Mustang 6 2018 57
Turbine Mustang 7 2018 57
(551 MW) Mustang 8 2018 57
Mustang 9 2018 57
Mustang 10 2018 57
Mustang 11 2018 57
Mustang 12 2018 57
OG&E Existing Renewable Resources
Summer
First Year Nameplate
Unit Type Unit Name Capacity
In Service Capacity (MW)
(MW)
Centennial 2006 120 16
Wind
OU Spirit 2009 101 9
(56 MW)
Crossroads 2012 228 31
Solar Mustang 2015 3 3
(12 MW)19 Covington 2018 9 9
18 Represents OG&E owned interest: 77% of McClain and 51% of Redbud.
19 Solar is connected to distribution and is embedded in the Net Demand Forecast.
182018 Integrated Resource Plan
OG&E Existing Power Purchase Contracts
First Nameplate Summer
Unit Name Year In Capacity Capacity
Service (MW) (MW)
Power Keenan 2010 152 18
Purchase Taloga 2011 130 7
(155 MW) Blackwell 2012 60 10
Oklahoma Cogen 1989 120 120
C. Transmission Capability and Needs
OG&E’s transmission system is directly interconnected to seven other utilities’
transmission systems at over 50 interconnection points. Indirectly, OG&E is connected to
the entire Eastern interconnection through the SPP regional transmission organization.
The SPP footprint covers 546,000 square miles, serves over 18 million customers and
has members in 14 states across all of Kansas and Oklahoma and parts of Arkansas,
Iowa, Louisiana, Minnesota, Missouri, Nebraska, New Mexico, North Dakota, South
Dakota, Texas and Wyoming. In compliance with FERC Order 890 for transmission
planning, SPP performs annual expansion planning for the entire SPP footprint. OG&E
provides input to the SPP planning process, and SPP is ultimately responsible for the
planning of the OG&E system.
The 2018 SPP Transmission Expansion Plan20 (STEP) summarizes Integrated
Transmission Planning (ITP) efforts including regional reliability, local reliability,
generation interconnection, and long-term tariff studies due to transmission service
requests. The purpose of the ITP process is to maintain reliability, provide economic
benefits and meet public policy needs in both the near and long-term to create a cost-
effective, flexible and robust transmission grid with improved access to the SPP region’s
diverse resources. The ITP is a three-phase iterative three-year process that includes a
long-term 20-year assessment, ITP20, a 10-year assessment, ITP10 and a near-term
assessment, ITPNT. The future major 345 kV projects embedded in these plans that will
be owned by OG&E are shown in the next table.
20
2018 STEP http://www.spp.org/publications/2018_STEP_Report.pdf
192018 Integrated Resource Plan
Major 345 kV Transmission Projects
Facility
Project Type Description Year
Owner
Regional Build new Degrasse 345 kV Substation on Woodward 2019 OGE
Reliability District EHV to Thistle (ITC) 345 kV double-circuit line
Transmission 8 miles of 345 kV line from Arcadia to Redbud (3rd line) 2019 OGE
Service in central Oklahoma
Generation New Windfarm at Border – 345 kV line terminal including 2020 OGE
Interconnection one 345 kV circuit breaker, line relaying, disconnect
switches and associated equipment for GEN-2011-049
Addition
Generation New Windfarm at Beaver County – 345 kV line terminal 2020 OGE
Interconnection including one 345 kV circuit breaker, line relaying,
disconnect switches and associated equipment for GEN-
2013-030
D. Needs Assessment
This schedule provides the needs assessment for new generating resources for the next
10 years assuming OG&E exercises any portion of its existing power purchase agreement
options.
Planning Margin (MW unless noted)
2019 2020 2021 2022 2023 2024 2025 2026 2027 2028
Owned
6,324 6,324 6,324 6,324 6,324 6,157 6,157 6,092 6,092 6,092
Capacity
Purchase
Capacity 155 35 35 35 35 35 35 35 35 35
Contracts
Total
6,479 6,359 6,359 6,359 6,359 6,192 6,192 6,127 6,127 6,127
Capacity
Demand
6,237 6,283 6,366 6,423 6,484 6,519 6,595 6,661 6,723 6,785
Forecast
OG&E
Demand 303 334 366 391 416 442 466 489 511 518
DSM
Net
5,934 5,949 6,001 6,031 6,069 6,077 6,129 6,172 6,212 6,266
Demand
Reserve
Margin 9% 7% 6% 5% 5% 2% 1% -1% -1% -2%
Margin21
Needed
Needs 168 305 362 396 438 615 673 786 831 892
Capacity
Planned AES OK Cogen HSL 6 Tinker Units
Capacity Contract Contract Retirement Retirement
Reductions (320 MW) (120 MW) (167 MW) (65 MW)
21 Reserve Margin % = ((Total Net Capacity) - (Net System Demand)) / Net System Demand
202018 Integrated Resource Plan
E. Resource Options
This schedule provides a description of the resource options available to OG&E to
address the needs identified in Schedule D.
New Generation Resources (2018 Dollars)
Nameplate Summer Fixed Variable
Nameplate Overnight Peak O&M O&M
Capacity Capital Cost Capacity Cost Cost
Technology Description (MW) ($/kW) (MW) ($/kW) ($/MWh)
Wind22 250 $1,640 50 $33.50 N/A
Batteries Lithium Ion 100 $2,190 100 $36.30 N/A
Solar23 Photovoltaic Single Axis 100 $1,460 80 $20.50 N/A
Conversion Horseshoe Lake CC 80 $2,510 80 $8.40 -$1.10
Plant Improve- McClain 42 $880 42 $1.70 N/A
ment (PI) Redbud 60 $800 60 $1.80 N/A
Reciprocating Recip Engine Single 6 $2,130 6 $18.10 $5.30
Engine Recip Engine Multiple 49 $1,540 49 $17.30 $4.10
LMS100 105 $1,400 93 $2.90 $1.80
CT Aero
Trent 60 SCGT 66 $780 57 $4.50 $1.10
5000F SCGT 245 $560 222 $3.00 $0.90
CT Frame
G/H Class 268 $730 244 $3.50 $1.50
7EA 96 $1,060 78 $6.60 $0.90
2x1 8000H 1,066 $680 989 $2.50 $1.90
Combined 1x1 HA.02 Fired 610 $840 571 $3.80 $2.00
Cycle (CC) 1x1 HA.02 497 $950 462 $3.80 $2.00
2X1 GE 7FA.05 Fired 885 $740 845 $2.40 $1.90
2X1 GE 7FA.05 714 $850 684 $2.40 $1.90
F. Fuel Procurement and Risk Management Plan
On May 15, 2018, OG&E filed its annual Fuel Supply Portfolio and Risk Management
Plan with the OCC as part of Cause No. PUD 200100095. The filed document can be
found at the OCC.
G. Action Plan
1) OG&E will issue an RFP for capacity resources, including fossil fuel-fired
resources, solar resources and energy storage resources with a delivery date
beginning in 2019, 2020 and/or 2021.
2) Complete the RFP analysis, select capacity and satisfy the capacity need.
22 Wind accredited peak capacity is assumed to be 20% of nameplate capacity
23 Solar accredited peak capacity is assumed to be 80% of nameplate capacity
212018 Integrated Resource Plan
H. Requests for Proposals
As noted in the Action plan, OG&E will prepare an RFP for capacity in 2019, 2020 and
2021. The RFP will be issued subsequent to the final IRP, pursuant to the Oklahoma
Corporation Commission’s (OCC) Electric Utility Rules OAC 165:35-37.
I. Modeling Methodology and Assumptions
This schedule is a technical appendix for the data, assumptions, and descriptions of
models needed to understand the derivation of the resource plan. The table below
explains the source of each assumption and provides a reference for where this
information is found in the IRP.
Assumption Source Reference
Electric Demand and Energy Forecast OG&E Page 3
Existing Generation Resources OG&E Page 4
New Generation Resource Options Burns & McDonnell, NREL, EIA Page 5
Natural Gas Price Projections EIA Page 6
Coal Price Projections EIA Page 6
CO2 Price Sensitivity OG&E Page 8
Market Prices OG&E Page 8
OG&E utilizes two software programs for production cost modeling:
1. PROMOD IV® - Fundamental Electric Market Simulation software from ABB that
incorporates generating unit operating characteristics, transmission grid topology
and constraints, unit commitment/operating conditions, and market system
operations. PROMOD IV® is used to model the SPP Integrated Marketplace.
2. GenTrader® - Power Costs, Inc. software designed to model complex portfolios
of power and fuel resources, including generators, contracts, options, and
ancillary services in great detail. Some of the functionalities include: multiple and
concurrent fuel and emission limits, multi-stage combined-cycle modeling,
ancillary services like regulations and spinning reserve as well as energy limited
contracts. GenTrader® is used to simulate OG&E’s net production costs within
the SPP IM.
J. Transmission System Adequacy
This schedule is a description of the transmission system adequacy over the next 10
years. SPP evaluates system adequacy and develops a transmission expansion plan to
determine what improvements are necessary to ensure reliable transmission service. The
2018 SPP Transmission Expansion Plan24 describes improvements necessary for
regional reliability, local reliability, generation interconnection, long-term tariff studies due
to transmission service requests and transmission owner sponsored improvements.
Included in the table below is a subset of the 2018 STEP, which OG&E has committed to
construct.
24 2018 STEP http://www.spp.org/publications/2018_STEP_Report.pdf
222018 Integrated Resource Plan
Estimated Capital Expenditures for OG&E Committed Projects
Type of Cost
Year Description Cost Allocation NTC ID
Upgrade ($M)
New
2019 DeGrasse 345 kV Substation Regional Reliability $7.70 200418
Substation
New
2019 DeGrasse 138 kV Substation Regional Reliability $3.60 200418
Substation
2019 Knob Hill to DeGrasse 138 kV New Line Regional Reliability $8.38 200418
DeGrasse to WFEC Mooreland 138
2019 New Line Regional Reliability $7.72 200418
kV
Transmission
2019 Redbud to Arcadia Line 3 345 kV New Line $18.00 20110
Service
Install New
2019 Stillwater Substation 138/69 kV Regional Reliability $2.79 200319
Transformer
Substation
2019 Stillwater Substation Regional Reliability $0.61 200319
Upgrade
Substation
2020 Lula 138 kV Substation Economic $0.02 200434
Upgrade
New Windfarm at Border 345 kV
Substation Generation
2020 Substation for GEN-2011-049 $3.65
Upgrade Interconnection
Addition
New Windfarm at Beaver County 345 Substation Generation
2020 $5.05
kV Substation for GEN-2013-030 Upgrade Interconnection
Substation
2021 Muskogee 161 kV Substation Regional Reliability $0.04 200423
Upgrade
Transmission system expansion provides benefits to members throughout the SPP;
therefore, the costs of all projects constructed in the SPP are shared through various cost
allocation methods, depending on the type of project.
K. Resource Plan Assessment
This IRP assessed the need for additional resources to meet reliability, cost and price,
environmental, and other criteria established by the OCC, the State of Oklahoma, the
APSC, SPP, NERC, and FERC. All criteria were met by all portfolios considered in this
IRP, in the base line condition. These criteria were also met in scenarios and uncertainties
which included variations in load growth, fuel prices, emissions prices, environmental
regulations, technology improvements, demand side resources, and fuel supply, among
others. This plan provides a comprehensive analysis of the proposed options.
L. Proposed Resource Plan Analysis
This IRP demonstrates that all proposed alternatives meet all planning criteria as outlined
in Schedules D and K. The proposed action plan outlined in Schedule G best meets these
criteria. Documentation of the planning analysis and assumptions used in preparing this
analysis are described in Schedule I.
232018 Integrated Resource Plan
M. Physical and Financial Hedging
OG&E’s Fuel Cost Adjustment tariff and OG&E’s diverse mix of generation assets provide
OG&E customers’ effective protection against fuel price volatility. Section IV illustrates
the advantages of generation diversity and the impact of the fuel volatility.
Financial Hedging of a commodity such as power plant fuel is aimed at reducing the
volatility in price. Financial hedging comes at a cost in the form of transaction costs,
margin calls and premiums required to lock in pricing. OG&E’s customers have been
protected to a large extent from the historic volatility in natural gas prices by OG&E’s
portfolio approach to fuel and purchased power. As a result, the Company does not
believe it to be prudent at this time to incur the additional costs associated with financial
hedging.
On May 15, 2018, OG&E filed its annual Fuel Supply Portfolio and Risk Management
Plan with the OCC as part of Cause No. PUD 200100095. The filed document can be
found at the OCC
242018 Integrated Resource Plan
VII. Appendices
252018 Integrated Resource Plan Appendix A – Demand Forecast Range and Energy by Class
2018 Integrated Resource Plan

PEAK DEMAND FORECAST

OG&E’s load forecasting framework relies on independently produced forecasts of service
area economic and population growth, actual and normal weather data, and projections of
OG&E electricity prices for price-sensitive customer classes. The peak demand forecast is
based on an hourly econometric model of weather and economic effects on OG&E’s hourly
load responsibility series. A probabilistic range of outcomes is produced to show how often
peak demands could reach each level. The 1 out of 2 years or “expected” forecast shows the
peak demand level given the 50th percentile of the load forecast distribution, using all available
historical weather data. In this case, there is a 50% probability the peak load will reach this
load level or higher. OG&E is required by SPP to plan for this 50% probability in the reserve
margin calculation.

     Peak Demand (MW) Forecasts by Weather Probability before OG&E DSM
   Event of             Occurrence
                                      2019    2020     2021    2022    2023     2024    2025    2026    2027    2028
   Occurrence           Probability
   1 out of 30 Years        3%        6,947   6,990    7,076   7,129   7,191    7,223   7,304   7,369   7,429   7,497
   1 out of 10 Years       10%        6,617   6,665    6,747   6,802   6,865    6,900   6,977   7,041   7,106   7,171
   1 out of 4 Years        25%        6,403   6,451    6,536   6,595   6,659    6,694   6,773   6,843   6,905   6,968
   1 out of 2 Years        50%        6,237   6,283    6,366   6,423   6,484    6,519   6,595   6,661   6,723   6,785
   3 out of 4 Years        75%        6,101   6,151    6,231   6,288   6,351    6,388   6,462   6,526   6,592   6,653
   9 out of 10 Years       90%        5,990   6,040    6,120   6,177   6,240    6,277   6,350   6,415   6,481   6,540
   29 out of 30 Years      97%        5,928   5,976    6,057   6,114   6,176    6,212   6,286   6,354   6,415   6,474

ENERGY FORECAST

The energy forecast is generated from a regression analysis of historical energy, economic
growth patterns and annual weather. OG&E’s energy is divided into six market segments
(Residential, Commercial, Industrial, Oil Field, Street Lighting and Public Authority). Within
each segment, a variety of different models is prepared and tested against actual historical
sales to determine which model provides the highest quality forecast for that market segment.

           Energy Forecast by Customer Revenue Class before OG&E DSM
   GWH                   2019    2020     2021        2022     2023     2024      2025   2026   2027   2028
   Residential           9,199   9,238    9,337       9,464    9,623    9,807     9,975 10,148 10,329 10,432
   Commercial            7,886   7,985    8,070       8,156    8,234    8,305     8,378 8,478 8,571 8,656
   Industrial            3,672   3,690    3,666       3,641    3,615    3,586     3,556 3,526 3,494 3,529
   Petroleum             3,671   3,753    3,843       3,922    4,016    4,102     4,167 4,205 4,248 4,290
   Street Lighting          56      53       50          47       43       40        37     34     31     31
   Public Authority      3,125   3,143    3,168       3,192    3,214    3,235     3,253 3,268 3,282 3,314
   Total Retail Sales   27,609 27,863 28,134 28,421 28,746 29,076 29,366 29,658 29,954 30,253
   Losses                1,919 1,936 1,955 1,975 1,998 2,021 2,041 2,061 2,082 2,115
   Energy Forecast      29,528 29,799 30,090 30,396 30,744 31,096 31,407 31,719 32,036 32,368

                                                        A-1
You can also read