International Journal of Applied Earth Observation and Geoinformation
←
→
Page content transcription
If your browser does not render page correctly, please read the page content below
International Journal of Applied Earth Observation and Geoinformation 118 (2023) 103251
Contents lists available at ScienceDirect
International Journal of Applied Earth
Observation and Geoinformation
journal homepage: www.elsevier.com/locate/jag
The use of dual-wavelength airborne laser scanning for estimating tree
species composition and species-specific stem volumes in a boreal forest
Christoffer R. Axelsson *, Eva Lindberg, Henrik J. Persson, Johan Holmgren
Department of Forest Resource Management, Swedish University of Agricultural Sciences (SLU), 901 83 Umeå, Sweden
A R T I C L E I N F O A B S T R A C T
Keywords: The estimation of species composition and species-specific stem volumes are critical components of many forest
Multispectral LiDAR inventories. The use of airborne laser scanning with multiple spectral channels may prove instrumental for the
Species classification cost-efficient retrieval of these forest variables. In this study, we scanned a boreal forest using two channels: 532
Stem volume
nm (green) and 1064 nm (near infrared). The data was used in a two-step methodology to (1) classify species,
Individual tree crowns
and (2) estimate species-specific stem volume at the level of individual tree crowns. The classification of pines,
spruces and broadleaves involved linear discriminant analysis (LDA) and resulted in an overall accuracy of 91.1
% at the level of individual trees. For the estimation of stem volume, we employed species-specific k-nearest
neighbors models and evaluated the performance at the plot level for 256 field plots located in central Sweden.
This resulted in root-mean-square errors (RMSE) of 36 m3/ha (16 %) for total volume, 40 m3/ha (27 %) for pine
volume, 32 m3/ha (48 %) for spruce volume, and 13 m3/ha (87 %) for broadleaf volume. We also simulated the
use of a monospectral near infrared (NIR) scanner by excluding features based on the green channel. This
resulted in lower overall accuracy for the species classification (86.8 %) and an RMSE of 41 m3/ha (18 %) for the
estimation of total stem volume. The largest difference when only the NIR channel was used was the difficulty to
accurately identify broadleaves and estimate broadleaf stem volume. When excluding the green channel, RMSE
for broadleaved volume increased from 13 to 26 m3/ha. The study thus demonstrates the added benefit of the
green channel for the estimation of both species composition and species-specific stem volumes. In addition, we
investigated how tree height influences the results where shorter trees were found to be more difficult to classify
correctly.
1. Introduction species mapping is more difficult, and often seen as a bottleneck in forest
inventories using remote sensing (Michałowska & Rapiński, 2021).
Species-specific stem volume is a commonly requested forest attri Species classification is commonly conducted using multi- or hyper
bute of high importance for both timber estimations and biodiversity spectral imagery, sometimes in combination with ALS (Fassnacht et al.,
monitoring. From an industry standpoint, it contains crucial information 2016; Shi et al., 2020). For example, Sentinel-2 imagery combined with
for estimating the forest value, its potential use, and for what manage ALS were utilized for the nationwide mapping of land cover including
ment decisions to take. Ecologists can use species-specific volumes to forest types in Sweden at a cell size of 10 × 10 m2 (Ahlcrona et al.,
assess biodiversity and map wildlife habitats (Löfstrand et al., 2003). 2019). Passive optical sensors can capture differences in foliage reflec
Airborne laser scanning (ALS) captures the 3-dimensional structure tance across multiple wavelengths, as well as differences in phenology in
of trees and is now used as a standard technology for retrieving forest the case of multi-temporal imagery (Axelsson et al., 2021).
variables in the Nordic countries. The National Land Survey in Sweden The emergence of multispectral laser scanners brings the possibility
has scanned most of the country from high altitude resulting in point to capture both the geometry and reflectance features of the scanned
densities of 0.5–1.0 pulses/m2. These data have been used to produce trees from a single platform. This technology could prove ideal for
raster maps (12.5 × 12.5 m2 cell size) of mean tree height, basal area, retrieving species-specific stem volumes of the scanned forest. Several
stem volume, and above ground tree biomass (Nilsson et al., 2017). Tree studies have shown promising results for species detection using
* Corresponding author.
E-mail addresses: christoffer.axelsson@slu.se (C.R. Axelsson), eva.lindberg@slu.se (E. Lindberg), henrik.persson@slu.se (H.J. Persson), johan.holmgren@slu.se
(J. Holmgren).
https://doi.org/10.1016/j.jag.2023.103251
Received 5 December 2022; Received in revised form 4 February 2023; Accepted 27 February 2023
Available online 9 March 2023
1569-8432/© 2023 Published by Elsevier B.V. This is an open access article under the CC BY-NC-ND license (http://creativecommons.org/licenses/by-nc-nd/4.0/).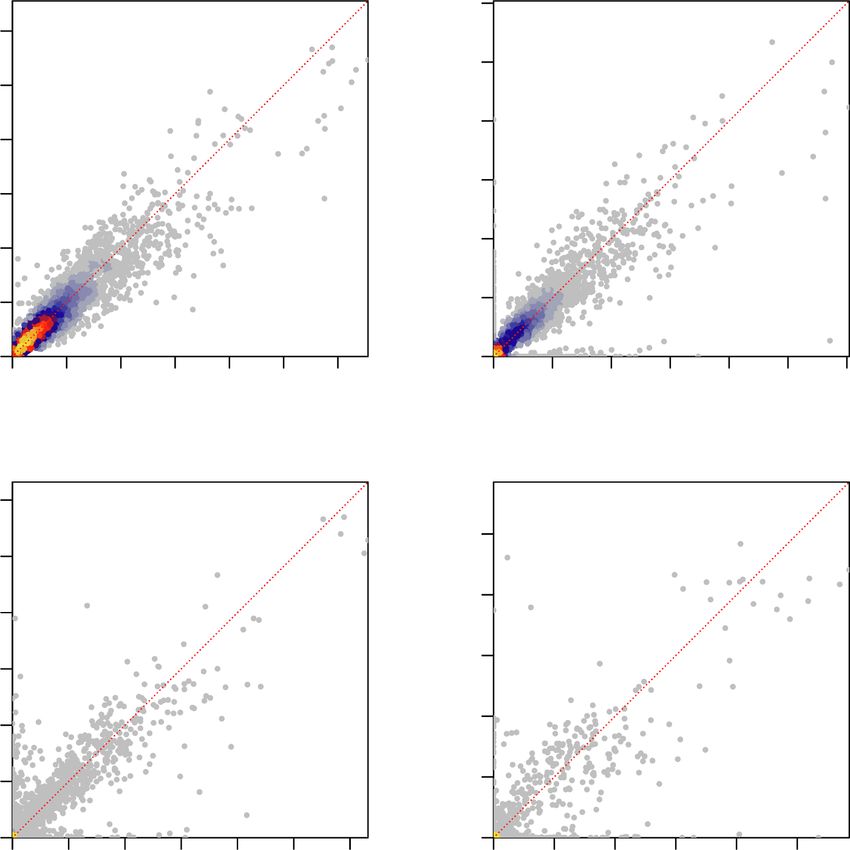
C.R. Axelsson et al.                                                                     International Journal of Applied Earth Observation and Geoinformation 118 (2023) 103251

                       Fig. 1. Workflow of the main steps in the analysis. White boxes represent processing steps and gray boxes represent datasets.

                  Fig. 2. Map of the Siljansfors experimental forest in central Sweden with the 291 sample plots distributed in a systematic pattern.

                                                                                     2
C.R. Axelsson et al. International Journal of Applied Earth Observation and Geoinformation 118 (2023) 103251
et al. (2008) showed that the crown base height was useful for detecting
Field plot Scots pine, and treetop sharpness contributed to distinguishing between
Segments Scots pine, Norway spruce and broadleaved trees. The intensity of the
backscattered signal depends on the reflectance, density, and orienta
tion of the foliage (Korpela et al., 2010), and has proven valuable for
distinguishing between species. In addition, multispectral ALS enables
the creation of intensity features from the combination of intensities in
multiple channels. Budei et al. (2018) found that spectral vegetation
indices based on backscattered intensities in the green and infrared
channels were the most important predictors of species in a Canadian
forest.
While species-detection from multispectral ALS can be conducted
using area-based approaches (Lindberg et al., 2021), it is often carried
out at the level of individual tree crowns (ITC). ITC also necessitates
higher point densities. While the cost of high point densities can be
inhibitory, technological improvements in laser scanners have led to
higher pulse repetition frequency. This development has enabled scan
ning with high point densities from increasingly higher altitudes and
over larger areas. Analysis at the level of individual trees is preceded by
a segmentation step that partitions the canopy into individual crown
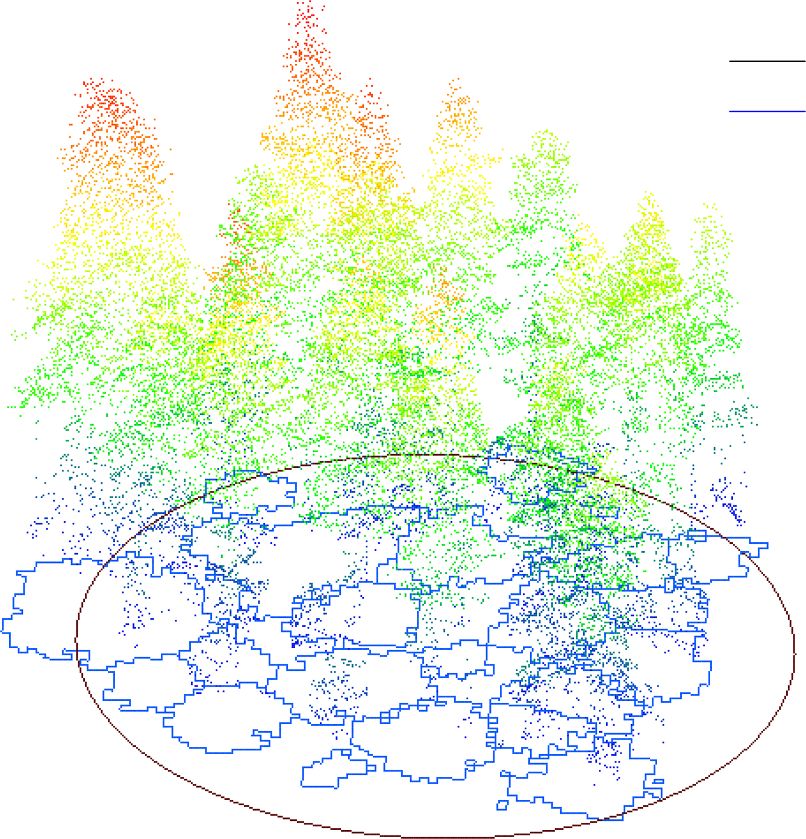
Fig. 3. ALS data and segments for one of the field plots. The colors of the ALS segments. This usually results in some level of systematic over- or under-
point cloud represent height. segmentation. Since the tree crown structure varies with species, a
segmentation algorithm may over-segment some species while under-
segmenting others. This could potentially lead to biased results (Peuh
Table 1 kurinen et al., 2011), where systematic errors at the level of individual
The reference segments (n = 5,163) divided into species groups. trees propagate as trees are aggregated to larger areas. It is therefore
important to use methods that do not assume that crowns are segmented
Group Pine Spruce Broadleaf
correctly and are insensitive to these errors. In this context, Breidenbach
Species Scots pine Norway spruce Birch Other broadleaf et al. (2010) proposed the semi-ITC method where segments may
Number 3,506 1,269 371 17 contain any number of trees. To predict the content of target segments,
the method imputes ground truth data from the most similar reference
segments. The semi-ITC method has proved to reduce biases when
compared to traditional ITC, and has also outperformed area-based
multispectral ALS (Axelsson et al., 2018; Budei et al., 2018; Leclère models for species-specific volume (Kandare et al., 2017).
et al., 2022; Yu et al., 2017). The potential to detect tree species accu The main objective of this study was to investigate the utility of dual-
rately depends on the heterogeneity of the forest and whether some wavelength ALS using green and near infrared (NIR) channels for esti
species are grouped together. In general, conifers have proven easier to mating species-specific stem volumes in a boreal forest in central Swe
classify than distinguishing between a mixture of broadleaf species den. A second objective was to determine the additional contribution of
(Prieur et al., 2022). Boreal forests in the Nordic countries are relatively the green wavelength, and thus the benefit of using a dual-wavelength
homogenous with a high dominance of Scots pine and Norway spruce. scanner.
These two species also hold the highest commercial value from a forest
industry standpoint. Species detection in these forests often focuses on 2. Materials and methods
separating between pines, spruces, and a general category of broad
leaves (Kukkonen et al., 2019). Both the geometry and reflectance of the An overview of the main steps in the methodology is presented in
tree crowns contain important species-related information. Holmgren Fig. 1. We employed a two-step modelling approach: (1) linear
(a) (b)
1.0
1.0
0.8
0.8
Producer's accuracy
User's accuracy
0.6
0.6
Pine (DW)
0.4
0.4
Spruce (DW)
Broadleaf (DW)
0.2
0.2
Pine (NIR)
Spruce (NIR)
0.0
Broadleaf (NIR)
0.0
5 10 15 20 5 10 15 20
Number of features Number of features
Fig. 4. Producer’s accuracy (left) and user’s accuracy (right) for the three species groups in relation to the number of features used during classification. Dashed lines
represent results from only using features based on the NIR channel. Based on these results, 10 features were used in the species modelling.
3
C.R. Axelsson et al. International Journal of Applied Earth Observation and Geoinformation 118 (2023) 103251
0.15
Stem volume rmse (m3)
0.10
MSN (DW)
Euclidean (DW)
0.05
Random forest (DW)
MSN (NIR)
Euclidean (NIR)
Random forest (NIR)
0.00
5 10 15 20
Number of features
Fig. 5. Variation in stem volume RMSE in relation to the number of features used in the imputation. We compared three methods for finding the nearest neighbors:
MSN, Euclidean and random forest distance. The estimations were made on the individual tree segments after classification of species. The reason for the marginally
lower error when using the full dual-wavelength (DW) dataset was the more accurate species classification that also improved the estimation of stem volume.
Table 2 Table 3
Features used as predictors during the species classification for the predictions Features used as predictors for the estimation of stem volume. The numbers to
based on dual-wavelength data (DW) or only the NIR channel data. The numbers the right show at which position the features were selected and thus their
to the right show in which order the features were selected and thus their importance. For both DW and NIR, the profile area was the most important
relative importance. feature for modelling stem volume.
Geometric features DW NIR
Geometric features DW NIR
Standard deviation of the number of points in 20 cm voxels in the (7)
Maximum height. (4) (4)
crown top1.
Volume of an alpha shape created from the crown top1. (2) (2)
Standard deviation of the number of points in 40 cm voxels in the (9)
Profile area of the crown top1. The mean area of convex hulls around (1) (1)
crown top1.
the x and z coordinates and the y and z coordinates.
L-transformed Ripley’s K at 20 cm calculated on the profile (x and z (4)
Coefficient of variation of the z coordinates. (5) (5)
coordinates) of the crown top1.
The height at which 50 % of the points fall below divided by the (2) (2)
maximum height. Return type and intensity based features DW NIR
The height at which 80 % of the points fall below divided by the (10) Mean NumberOfReturns2 of all infrared points. (3) (3)
maximum height. 1
Crown height divided by crown width of the crown top1, where the (8)
Crown top refers to all points that were located above the maximum height/
width was calculated as the diameter of the smallest enclosing 2.
2
circle. NumberOfReturns refers to the number of returns that were registered for a
Skewness of the z coordinates in the crown top1. (9) single emitted pulse.
Skewness of the z coordinates in the top 2 m of the crown. (10) (7)
Return type and intensity based features DW NIR 2.1. Study area and field data
Proportion of single returns among first returns in the NIR data. (6) (5)
Proportion of points with NumberOfReturns2 above two among all (8) (6)
NIR points. The Siljansfors experimental forest is situated in central Sweden
The summarized intensity of single returns divided by the (5) (3) (60◦ 53́ N, 14◦ 24́ E) and covers an area of 1520 ha. It is dominated by
summarized intensity of all first returns in the NIR data. Scots pine (60 %) and Norway spruce (35 %) mixed with some broadleaf
The summarized intensity of first returns divided by the summarized (4)
species (5 %), of which most are birches. The field work was carried out
intensity of all returns in the green data.
Mean intensity among NIR points. (1) between September 2019 and June 2020. Field data were collected at
Standard deviation of the intensity among both green and NIR points. (1) 291 circular plots distributed in a systematic sampling pattern (Fig. 2).
Ratio between the mean intensity per emitted pulse in the NIR and (3) Most of these had a radius of 10 m, but in some cases with dense young
green channels. The mean intensity per emitted pulse was forest they were given a smaller radius. At each field plot center, the
calculated as the summarized intensity of all points divided by the
number of first returns.
position was recorded using an R8 GNSS receiver (Trimble, USA) that
used corrections from permanent reference stations to improve the ac
1
Crown top refers to points located above half of the maximum height. curacy. The accuracy, as reported by the receiver, was often in the cm
2
NumberOfReturns refers to the number of returns that were registered for a
range and in all cases less than 50 cm. Stem diameters at 1.3 m above
single emitted pulse.
ground (DBH) and stem positions relative the plot center were measured
using a DP II caliper with the DP PosTex add-on (Haglöf, Sweden). Tree
species, DBH, and stem position were recorded for all trees with a DBH
discriminant analysis (LDA) to classify segments into dominant species, of at least 4 cm. In addition, the height of some of the trees were
and (2) species-specific k-nearest neighbors models for the estimation of measured with a Vertex Laser Geo range finder (Haglöf, Sweden). Of the
stem volumes. The estimated species-specific stem volumes were vali original 291 plots, we used data from 256. Plots were excluded where
dated at the plot level for 256 field plots. The analysis followed the semi- the plot radius was less than 10 m (for consistency), contained lodgepole
ITC method where each segment may contain any number of trees pines or larch trees (which are normally very rare in Swedish forests),
(Breidenbach et al., 2010).
4C.R. Axelsson et al. International Journal of Applied Earth Observation and Geoinformation 118 (2023) 103251
Table 4
Confusion matrices for species classification using 10 features and evaluated on the reference trees using leave one plot out cross-validation. The results are calculated
for the full dual-wavelength dataset (top), and only the NIR channel data (bottom). We also added results for balanced sample sizes where each tree species had 388
samples (right). PA is producer’s accuracy and UA is user’s accuracy.
Dual-wavelength Dual-wavelength, balanced sample sizes
Pine Spruce Broadleaf UA (%) Pine Spruce Broadleaf UA (%)
Pine 3325 144 47 95 Pine 347 21 23 89
Spruce 157 1079 41 84 Spruce 30 346 24 86
Broadleaf 23 46 300 81 Broadleaf 11 21 341 91
PA (%) 95 85 77 91.1 PA (%) 89 89 88 88.8
NIR NIR, balanced sample sizes
Pine Spruce Broadleaf UA (%) Pine Spruce Broadleaf UA (%)
Pine 3330 197 219 89 Pine 323 18 58 81
Spruce 137 1040 59 84 Spruce 19 325 58 81
Broadleaf 38 31 110 61 Broadleaf 46 45 272 75
PA (%) 95 82 28 86.8 PA (%) 83 84 70 79.0
0.00 0.02 0.04 0.06 0.08 0.10
1.0
a) b)
Density distribution
Producer's accuracy
0.9
0.8
Pine
0.7
Spruce
Broadleaf
0.6
TotalC.R. Axelsson et al. International Journal of Applied Earth Observation and Geoinformation 118 (2023) 103251
3.0
R2 = 0.864 R2 = 0.73
3.0
rel. rmse = 38.2% rel. rmse = 70.2%
Total volume prediction (m3)
Pine volume prediction (m3)
rel. bias = −1.48% rel. bias = −3.28%
2.5
2.5
2.0
2.0
1.5
1.5
1.0
1.0
0.5
0.5
0.0
0.0
0.0 0.5 1.0 1.5 2.0 2.5 3.0 0.0 0.5 1.0 1.5 2.0 2.5 3.0
Total volume reference (m3) Pine volume reference (m3)
R2 = 0.748 R2 = 0.606
3.0
Broadleaf volume prediction (m3)
rel. rmse = 136% rel. rmse = 291%
Spruce volume prediction (m3)
1.0
rel. bias = 2.98% rel. bias = −3.12%
2.5
0.8
2.0
0.6
1.5
0.4
1.0
0.2
0.5
0.0
0.0
0.0 0.5 1.0 1.5 2.0 2.5 3.0 0.0 0.2 0.4 0.6 0.8 1.0
Spruce volume reference (m3) Broadleaf volume reference (m3)
Fig. 7. Volume predictions at the segment level using the full dual-wavelength dataset. Species misclassifications appear as points close to the x- and y-axes.
Table 6 volume estimation. The following descriptions provide examples of the
Results for stem volume estimations at the plot level. different types of features used in the analysis. They can be categorized
Data Channels RMSE (m3/ha) Bias (m3/ha) into geometric features (relating to spatial variation), intensity features
(radiometric variation), and return type features (based on proportions
Total DW 36.2 (15.9 %) 3.80 (1.67 %)
Pine DW 39.7 (27.2 %) 0.45 (0.31 %) of different return types). The geometric features were derived from the
Spruce DW 31.7 (47.8 %) 2.06 (3.11 %) combined point clouds of green and near infrared data points. Some
Broadleaf DW 13.1 (87.0 %) 0.66 (4.36 %) geometric features were used with the aim to capture the shape of the
Total NIR 40.7 (17.9 %) 6.81 (3.00 %) crown, for example relative height percentiles, vertical skewness, and
Pine NIR 56.4 (38.7 %) 10.21 (7.00 %)
Spruce NIR 30.5 (46.0 %) 2.96 (4.47 %)
height-to-width ratio of the crown. We also used geometric features that
Broadleaf NIR 25.7 (170.8 %) − 6.83 (− 45.34 %) captured variation inside the crown structure, such as the standard de
viation of the number of points in voxels. Other geometric features were
aimed at capturing tree size, e.g., maximum height, crown volume,
profile and footprint area of the crown. Intensity features included the
where it was clear which tree belonged to which segment. When several maximum and standard deviation of the intensity, and the ratio between
trees were linked to the same segment, the species of the segment was set the mean intensity in the near infrared channel and the mean intensity in
to that of the tree with the largest stem diameter. The mean number of the green channel. Features based on return number included the pro
tree stems per segment was 1.6. The linked tree segments (n = 5,163) portion of first returns among all returns and the proportion of single
constituted the training data during the modelling of tree species and returns among all first returns. There were also features using both in
volume. The tree population was composed of Scots pine, Norway tensity and return number, e.g. the summarized intensity of first returns
spruce, birch, and a small number of other broadleaf species. The divided by the summarized intensity of all returns. Before calculating
broadleaves were combined into a single category (Table 1) in order to any of the features, we removed all points below two meters from the
get a sufficient sample size for each species class. ground.
2.4. Feature extraction 2.5. Selection of features for modelling species and volume
Several features were extracted from the point cloud of the reference When extracting features from the reference segments, some smaller
segments and evaluated as predictors for species classification and stem segments contained too few points for the calculation of some features.
6C.R. Axelsson et al. International Journal of Applied Earth Observation and Geoinformation 118 (2023) 103251
400
R2 = 0.877 R2 = 0.789
600
Total volume prediction (m3/ha)
rel. rmse = 15.9% rel. rmse = 27.2%
Pine volume prediction (m3/ha)
rel. bias = 1.67% rel. bias = 0.309%
500
300
400
200
300
200
100
100
0
0
0 100 200 300 400 500 600 0 100 200 300 400
Total volume reference (m3/ha) Pine volume reference (m3/ha)
Broadleaf volume prediction (m3/ha)
R2 = 0.907 R2 = 0.873
Spruce volume prediction (m3/ha)
rel. rmse = 47.8% rel. rmse = 87%
rel. bias = 3.11% rel. bias = 4.36%
200
400
150
300
100
200
100
50
0
0
0 100 200 300 400 0 50 100 150 200
Spruce volume reference (m3/ha) Broadleaf volume reference (m3/ha)
Fig. 8. Species-specific stem volumes at the plot level using the full dual-wavelength dataset. When trees were aggregated to the plot level, the errors shrank and
there were few signs of misclassification.
Since robust features are preferable, we excluded those that could not be dominant tree, it may thus contain stem volumes of several species.
calculated for more than 1 ‰ of all reference segments. To identify the The distance to the neighbors can be calculated using different
most important features for classifying species, we employed stepwise methods. We compared results for Euclidean distance, most similar
feature selection for an LDA-model (stepLDA method in caret R pack neighbor (MSN) distance, and random forest distance to identify which
age). We excluded non-normalized geometric features, such as height method performed best. The Euclidean distance is calculated using the
and crown volume, since we wanted the species classification to be in normalized independent variables and the MSN distance is calculated in
dependent of tree size. Features that were important for modelling the a projected canonical space. Random forest distance depends on the
volume were identified using stepwise linear regression with forward proportion of random forest trees that contain both the target segment
selection (leapForward method in caret R package). and reference segment in the same leaf node.
In order to investigate the contribution of the green wavelength we
also created feature sets for species classification and volume estimation
that were solely based on the NIR wavelength. All features based on 2.7. Validation
intensity or return type of the green wavelength were excluded during
this selection process. These second feature sets represented the use of a The imputation was validated at the plot level for the 256 plots using
monospectral NIR scanner in the analysis. leave one plot out cross-validation. This approach was selected as it
maximizes the use of the available data for model training. Although we
did have many samples in total, the number of broadleaf reference trees
2.6. Classification of tree species and estimation of stem volume was relatively small. For a specific sample plot, an LDA model was
trained using reference data from all the other plots and applied to
Prediction of species-specific volume followed a two-step approach: predict the species of each segment. The procedure was then repeated
(1) classification of the dominant species of each segment using LDA for all sample plots. Species-specific knn models were applied to impute
(MASS R package), and (2) estimation of stem volume using species- the stem volumes using reference segments from all the other plots.
specific k nearest neighbors models (yaImpute R package). We set the Predictions were made for all segments with centroids inside the plot.
parameter k to 5, meaning the estimated tree volumes are a weighted The combined imputed species-specific volumes at each plot were then
mean of the five nearest neighbors. Both the total and species-specific compared to the volumes of all the field-measured trees within the plot
volumes were simultaneously imputed from the most similar neigh boundaries.
bors. While a segment was classified according to the species of the most The results of the species classification are presented in graphs and
7C.R. Axelsson et al. International Journal of Applied Earth Observation and Geoinformation 118 (2023) 103251
confusion matrices. We added confusion matrices for data sets with compared to the relative errors of predictions of the individual tree
balanced sample sizes for a better comparison between the species. segments. There were only a few indications of misclassifications. The
Here, we used all 388 broadleaf samples and added the same number of estimates of species-specific volumes thus improved as trees were
randomly selected pine and spruce samples. All the other results are, aggregated to larger areas.
however, based on the full dataset with imbalanced sample sizes. To Estimation errors for total stem volume from only using features
quantify the accuracy of the volume estimates we used root-mean- based on the infrared channel (Tables 5 and 6) were marginally higher
square error (RMSE) and bias (estimated volume minus observed vol but comparable to using both channels. The largest difference when
ume). Relative RMSE and relative bias were calculated through division excluding the green channel was related to the inferior estimation of
by the mean of the observations. broadleaf volumes, which reflected the poor classification accuracy of
broadleaves.
3. Results
4. Discussion
3.1. Feature selection
This study demonstrates the use of dual-wavelength ALS for classi
To evaluate how many features to use we ran the models with an fying species and estimating species-specific stem volumes. To the best
increasing number of features and plotted the results (Figs. 4 and 5). For of our knowledge, this is the first study to utilize dual- or multi-
species classification (Fig. 4), we chose to use 10 features as there was wavelength ALS to estimate species-specific stem volumes for individ
only a minor accuracy improvement with additional features. De ual tree crown segments. One novelty was the two-step approach with
scriptions of the selected features and their selection order are detailed an initial segment level species classification followed by species-
in Table 2. The high number of pines meant that the model was more specific stem volume estimations using the MSN method. We tested a
inclined to classify uncertain cases as pine (Graves et al., 2016), and variety of ALS features for their ability to classify species, including
producer’s accuracy for pines stayed at a high level throughout the geometric, intensity-based, and features using the return number and
range of features. total number of backscattered returns. All these types of features proved
In the case of stem volume estimation (Fig. 5), we chose to use five useful for separating between pines, spruces, and broadleaves. The
features. These five features were the same whether utilizing the green intensity-based features were the most important for identifying species
wavelength or not (Table 3), and additional features provided only small with four of the first five features making use of the intensity (Table 2,
improvements in stem volume estimations. There was only a small dif DW case).
ference in performance between the three methods for calculating the The classification model using both channels resulted in producer’s
distance to the neighboring reference segments. We decided to continue accuracies of 95 %, 85 % and 77 % for pines, spruces and broadleaves,
with the MSN method, which performed equally well or better than respectively (Table 4). These results reflected the varying number of
Euclidean distance and random forest distance. One drawback with the samples for the species. When we used a dataset with balanced sample
random forest method was the longer model training time, which can sizes, there was little difference in user’s and producer’s accuracies
become an issue due to the many iterations of leave one plot out cross- between the three species. For the NIR dataset, the broadleaf user’s and
validation. producer’s accuracies were however clearly lower also in the case of
balanced sample sizes.
3.2. Species classification of individual tree crown segments The estimation of species-specific volumes was based on the com
plete imbalanced dataset and resulted in lower relative errors for pines
The overall classification accuracy for the DW dataset when using 10 than for spruces and broadleaves. Similar to the study by Breidenbach
features was 91.1 %. Pines had the highest user’s and producer’s accu et al. (2010), we achieved low levels of bias which might be due to the
racies, followed by spruces and broadleaves (Table 4). However, the use of the semi-ITC method. The relative errors were lower when trees
balanced dataset with the same number of samples per species resulted were aggregated to the plot level, and the low levels of bias were key for
in similar accuracies for the three species. Classification results from accurate estimates at larger areas.
using 10 features and only information in the infrared channel resulted Models created using data only from the NIR channel produced good
in an overall accuracy of 86.8 %. In relation to using both channels, the results for total, pine, and spruce volumes, but underestimated broadleaf
largest difference was the significantly lower accuracy for broadleaves. volumes due to difficulties in separating them from the coniferous spe
(Table 4). The green wavelength is thus especially important for sepa cies. This resulted in negative biases for the estimation of broadleaf
rating broadleaf trees from coniferous trees. The lower classification volumes (− 48 % and − 45 % at the segment and plot level respectively).
accuracies when excluding the green channel also negatively affected Features based on the green wavelength thus proved especially impor
the estimation of stem volume, which used species-specific models that tant for the identification of broadleaves and estimation of broadleaf
relied on the initial species classification (Fig. 5). stem volumes in the forest.
Fig. 6 shows the relationship between tree height and classification Similar results were observed in Kukkonen et al. (2019) which
accuracy. In general, shorter trees (C.R. Axelsson et al. International Journal of Applied Earth Observation and Geoinformation 118 (2023) 103251
correctly and a height distribution skewed towards smaller trees can Axelsson, A., Lindberg, E., Reese, H., Olsson, H., 2021. Tree species classification using
Sentinel-2 imagery and Bayesian inference. Int. J. Appl. Earth Obs. Geoinf. 100
negatively affect classification results. While the overall classification
https://doi.org/10.1016/j.jag.2021.102318.
accuracies were lowest for the short trees (less than10 m), pines had Brandel, G., 1990. Volume functions for individual trees, 26, (Garpenberg Report 26, Issue).
reduced accuracy for the tallest trees (greater than20 m). This may be a Breidenbach, J., Næsset, E., Lien, V., Gobakken, T., Solberg, S., 2010. Prediction of
result of the lower proportion of pines in that range. Most of the refer species specific forest inventory attributes using a nonparametric semi-individual
tree crown approach based on fused airborne laser scanning and multispectral data.
ence trees were between 10 and 20 m and the models were optimally Remote Sens. Environ. 114 (4), 911–924.
tuned for classifying trees of that size. Budei, B.C., St-Onge, B., Hopkinson, C., Audet, F.-A., 2018. Identifying the genus or
In this study, we extracted a large number of features from an ALS species of individual trees using a three-wavelength airborne lidar system. Remote
Sens. Environ. 204, 632–647.
point cloud and tested them for their ability to predict species-specific Fassnacht, F.E., Latifi, H., Stereńczak, K., Modzelewska, A., Lefsky, M., Waser, L.T.,
stem volumes in a relatively small study area. A greater goal, howev Straub, C., Ghosh, A., 2016. Review of studies on tree species classification from
er, is to apply the methodology in operational forest inventories over remotely sensed data. Remote Sens. Environ. 186, 64–87.
Graves, S.J., Asner, G.P., Martin, R.E., Anderson, C.B., Colgan, M.S., Kalantari, L.,
larger areas. This requires the utilization of robust features that are Bohlman, S.A., 2016. Tree species abundance predictions in a tropical agricultural
transferable between different acquisitions and over varied forest con landscape with a supervised classification model and imbalanced data. Remote Sens.
ditions (Navarro et al., 2020; Rana et al., 2022). In future research, we (Basel) 8 (2), 161. https://www.mdpi.com/2072-4292/8/2/161.
Holmgren, J., Persson, Å., Söderman, U., 2008. Species identification of individual trees
therefore aim to combine and compare data from multiple geographi by combining high resolution LiDAR data with multi-spectral images. Int. J. Remote
cally distant sites. Sens. 29 (5), 1537–1552.
Holmgren, J., Lindberg, E., Olofsson, K., Persson, H.J., 2022. Tree crown segmentation in
three dimensions using density models derived from airborne laser scanning. Int. J.
5. Conclusions Remote Sens. 43 (1), 299–329. https://doi.org/10.1080/01431161.2021.2018149.
Kandare, K., Dalponte, M., Ørka, H.O., Frizzera, L., Næsset, E., 2017. Prediction of
This paper demonstrates the estimation of species composition and species-specific volume using different inventory approaches by fusing airborne laser
scanning and hyperspectral data. Remote Sens. (Basel) 9 (5), 400.
species-specific volumes from dual-wavelength ALS data at the level of Korpela, I., Ørka, H.O., Hyyppä, J., Heikkinen, V., Tokola, T., 2010. Range and AGC
individual trees. We showed how ALS features from dual-wavelength normalization in airborne discrete-return LiDAR intensity data for forest canopies.
NIR and green channels improved the species classification compared ISPRS J. Photogram. Remote Sens. 65 (4), 369–379. https://doi.org/10.1016/j.
isprsjprs.2010.04.003.
to using a monospectral infrared scanner. The added use of the green
Kukkonen, M., Maltamo, M., Korhonen, L., Packalen, P., 2019. Multispectral airborne
channel proved especially important for the classification of broadleaf LiDAR data in the prediction of boreal tree species composition. IEEE Trans. Geosci.
trees, which in turn improved the estimation of broadleaf stem volumes Remote Sens. 57 (6), 3462–3471.
in the forest. Furthermore, we showed how tree height influences the Leclère, L., Lejeune, P., Bolyn, C., Latte, N., 2022. Estimating species-specific stem size
distributions of uneven-aged mixed deciduous forests using ALS data and neural
results with lower accuracies for the shorter trees. networks. Remote Sens. (Basel) 14 (6), 1362.
Lindberg, E., Holmgren, J., Olsson, H., 2021. Classification of tree species classes in a
hemi-boreal forest from multispectral airborne laser scanning data using a mini
Declaration of Competing Interest raster cell method. Int. J. Appl. Earth Obs. Geoinf. 100 https://doi.org/10.1016/j.
jag.2021.102334.
Löfstrand, R., Folving, S., Kennedy, P., Puumalainen, J., Coch, T., Kenter, B., Köhl, M.,
The authors declare that they have no known competing financial Lämås, T., Petersson, H., Tuominen, S., 2003. Habitat characterization and mapping
interests or personal relationships that could have appeared to influence for umbrella species—an integrated approach using satellite and field data. In:
the work reported in this paper. Advances in Forest Inventory for Sustainable Forest Management and Biodiversity
Monitoring. Springer, pp. 191–204.
Michałowska, M., Rapiński, J., 2021. A review of tree species classification based on
Data availability airborne LiDAR data and applied classifiers. Remote Sens. 13 (3), 353.
Navarro, J.A., Tomé, J.L., Marino, E., Guillén-Climent, M.L., Fernández-Landa, A., 2020.
Assessing the transferability of airborne laser scanning and digital aerial
The authors do not have permission to share data.
photogrammetry derived growing stock volume models. Int. J. Appl. Earth Obs.
Geoinf. 91 https://doi.org/10.1016/j.jag.2020.102135.
Acknowledgements Nilsson, M., Nordkvist, K., Jonzén, J., Lindgren, N., Axensten, P., Wallerman, J.,
Egberth, M., Larsson, S., Nilsson, L., Eriksson, J., 2017. A nationwide forest attribute
map of Sweden predicted using airborne laser scanning data and field data from the
This study was funded by Stora Enso AB, the Swedish University of National Forest Inventory. Remote Sens. Environ. 194, 447–454.
Agricultural Sciences (SLU), the Kempe Foundations (as part of the Persson, H.J., Fransson, J.E., 2017. Comparison between TanDEM-X-and ALS-based
estimation of aboveground biomass and tree height in boreal forests. Scand. J. For.
Tandem Forest Values research program), Mistra (the Swedish Foun
Res. 32 (4), 306–319.
dation for Strategic Environmental Research) as part of the Mistra Dig Peuhkurinen, J., Mehtätalo, L., Maltamo, M., 2011. Comparing individual tree detection
ital Forest research program (DIA 2017/4 #6), the Bo Rydin Foundation and the area-based statistical approach for the retrieval of forest stand characteristics
for Scientific Research (award no F06/21), and Formas - a Swedish using airborne laser scanning in Scots pine stands. Can. J. For. Res. 41 (3), 583–598.
Prieur, J.-F., St-Onge, B., Fournier, R.A., Woods, M.E., Rana, P., Kneeshaw, D., 2022.
Research Council for Sustainable Development (ref. 2018-01161). The A comparison of three airborne laser scanner types for species identification of
field work was carried out under the leadership of Ola Langvall (SLU) individual trees. Sensors 22 (1), 35.
and the aerial laser scanning was carried out by Opegieka Sp. z o.o. Rana, P., St-Onge, B., Prieur, J.-F., Budei, B.C., Tolvanen, A., Tokola, T., 2022. Effect of
feature standardization on reducing the requirements of field samples for individual
(Poland). tree species classification using ALS data. ISPRS J. Photogramm. Remote Sens. 184,
189–202.
References Shi, Y., Wang, T., Skidmore, A.K., Heurich, M., 2020. Improving LiDAR-based tree
species mapping in Central European mixed forests using multi-temporal digital
aerial colour-infrared photographs. Int. J. Appl. Earth Obs. Geoinf. 84.
Ahlcrona, E., Cristvall, C., Jönsson, C., Mattisson, A., Olsson, B., 2019. Nationell Yu, X., Hyyppä, J., Litkey, P., Kaartinen, H., Vastaranta, M., Holopainen, M., 2017.
Marktäckedata 2018 Basskikt. Gävle, Sweden, Metria, p. 58. Single-sensor solution to tree species classification using multispectral airborne laser
Axelsson, A., Lindberg, E., Olsson, H., 2018. Exploring multispectral ALS data for tree scanning. Remote Sens. (Basel) 9 (2), 108.
species classification. Remote Sens. (Basel) 10 (2), 183.
9You can also read