A Lightweight Approach for Skin Lesion Detection Through Optimal Features Fusion
←
→
Page content transcription
If your browser does not render page correctly, please read the page content below
Computers, Materials & Continua                                                               Tech Science Press
DOI:10.32604/cmc.2022.018621
Article

       A Lightweight Approach for Skin Lesion Detection Through Optimal
                                Features Fusion
        Khadija Manzoor1 , Fiaz Majeed2 , Ansar Siddique2 , Talha Meraj3 , Hafiz Tayyab Rauf 4, *
           Mohammed A. El-Meligy5 , Mohamed Sharaf 6 and Abd Elatty E. Abd Elgawad6

                 1
                    Department of Information Technology, University of Gujrat, Gujrat, 50700, Pakistan
                 2
                    Department of Software Engineering, University of Gujrat, Gujrat, 50700, Pakistan
    3
      Department of Computer Science, COMSATS University Islamabad - Wah Campus, Wah Cantt, 47040, Pakistan
             4
               Centre for Smart Systems, AI and Cybersecurity, Staffordshire University, Stoke-on-Trent, UK
                 5
                   Advanced Manufacturing Institute, King Saud University, Riyadh, 11421, Saudi Arabia
  6
    Department of Industrial Engineering, College of Engineering, King Saud University, Riyadh, 11421, Saudi Arabia
                    *
                      Corresponding Author: Hafiz Tayyab Rauf. Email: hafiztayyabrauf093@gmail.com
                                     Received: 14 March 2021; Accepted: 16 April 2021

                 Abstract: Skin diseases effectively influence all parts of life. Early and accurate
                 detection of skin cancer is necessary to avoid significant loss. The manual
                 detection of skin diseases by dermatologists leads to misclassification due to
                 the same intensity and color levels. Therefore, an automated system to identify
                 these skin diseases is required. Few studies on skin disease classification using
                 different techniques have been found. However, previous techniques failed to
                 identify multi-class skin disease images due to their similar appearance. In
                 the proposed study, a computer-aided framework for automatic skin disease
                 detection is presented. In the proposed research, we collected and normalized
                 the datasets from two databases (ISIC archive, Mendeley) based on six Basal
                 Cell Carcinoma (BCC), Actinic Keratosis (AK), Seborrheic Keratosis (SK),
                 Nevus (N), Squamous Cell Carcinoma (SCC), and Melanoma (M) common
                 skin diseases. Besides, segmentation is performed using deep Convolutional
                 Neural Networks (CNN). Furthermore, three types of features are extracted
                 from segmented skin lesions: ABCD rule, GLCM, and in-depth features.
                 AlexNet transfer learning is used for deep feature extraction, while a support
                 vector machine (SVM) is used for classification. Experimental results show
                 that SVM outperformed other studies in terms of accuracy, as AK disease
                 achieved 100% accuracy, BCC 92.7%, M 95.1%, N 97.8%, SK 93.1%, SCC
                 91.4% with a global accuracy of 95.4%.

                 Keywords: AlexNet; CNN; GLCM; SVMs; skin disease

1 Introduction
    The skin is the most significant organ of the human figure, as it accommodates all body
elements, such as bones and tissues. Nearly 1.79% of the global diseases are skin diseases [1].
Skin diseases can be germs, cancerous, or provocative, affecting different kinds of people, such as

                      This work is licensed under a Creative Commons Attribution 4.0 International License,
                      which permits unrestricted use, distribution, and reproduction in any medium, provided
                      the original work is properly cited.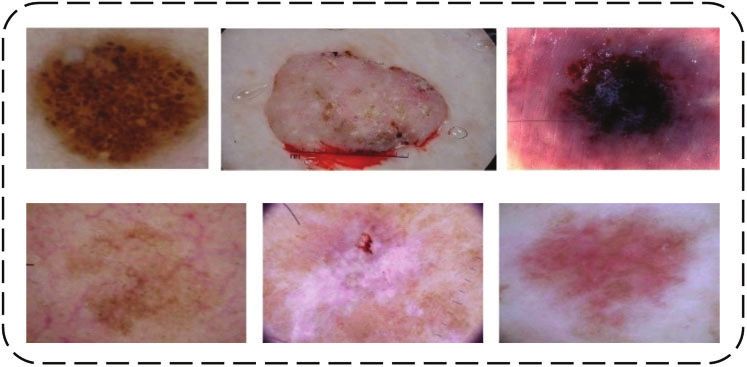
1618                                                                        CMC, 2022, vol.70, no.1

children, young and older adults [2]. Many people suffer from skin problems, which eventually
lead to skin cancer. Skin diseases are the fourth driving reason for nonfatal illness problems on
the planet, and the three most common diseases in the world [3]. Skin diseases caused substantial
economic burdens in high and low-income countries. Skin disease can affect all parts of life, such
as personal relationships, workplace, social environment, physical movement, and emotional well-
being of each other. Suicidal attempts are more in patients having skin diseases [4]. However,
making an automated diagnostic system can improve the early detection of this disease. For
automated diagnosis, many inventions in the medical image processing field, particularly magnetic
resonance imaging (MRI), computed tomography (CT) scan, and digital subtraction angiography
(DSA), which determined high-resolution features, was produced for automated diagnosis [5].
Similarly, many public datasets on skin diseases are available for research, and International Skin
Imaging Collaboration (ISIC) and Mendeley are used for the proposed study.
     Skin cancer is the most well-known type of cancer. Skin cancer can be an abnormal injury
of cells. There are four skin cancer classes: Actinic Keratosis, Basal cell carcinoma, Squamous
cell carcinoma, and Melanoma. Early detection of cancer assists in treating it effectively. Cancer
spread to other body organs due to late diagnosis, can no longer be treated [6]. According to
research in the USA, at least one person dies from Melanoma every hour. Also, every year, 9730
patients lose their lives, and 87,110 Melanoma cases were reported [7]. Furthermore, in 2016, there
were 6800 Melanoma patients in Canada, where 1150 patients died [8].
     SK disease occurs due to benign epidermal cells based on delayed maturation. Melanocytic
nevus (MN) and Basal cell carcinoma (BCC) have more profound injuries, which can be dif-
ferentiated accurately and adequately [9]. BCC is the most common skin cancer and it mainly
affects aged people. Epidemiological studies showed that the proportion of BCC is rising every
year, and the new generation rate shows a continuously higher trend [10]. Moreover, there is no
noticeable difference between Actinic keratosis (AK) and Squamous cell carcinoma (SCC) they
are very similar.
    Due to the severity of skin infections, several conditions happened in a patient’s life like
impairment of daily actions, unemployment, loss of confidence, disturbance, suicidal attempt, loss
of internal organs, and death in deadly skin cancers such as melanoma, etc. If the detection
of these diseases is delayed or incorrect, it may lead to treatment delays, no treatment, or even
improper treatment. In the literature, several machines and deep learning algorithms are used to
segregate target classes [11,12]. To reduce the morbidity rate, cost, and mortality, skin diseases
should be treated in the early stages to overcome these consequences [13]. All the above-described
diseases were misclassified due to the same color or intensity level, and another reason for
misclassification is an imbalanced dataset. The proposed framework includes
    • An improved deep learning-based Lesion semantic segmentation is proposed.
    • Multi-type features regarding Deep, GLCM, and ABCD rules are extracted.
    • Improved results in terms of accuracy and false-positive reduction.
    The rest of the article is divided into Related Work-2, Proposed Methodology-3, Results, and
Discussion-4, and Conclusion-5.

2 Related Work
    This part summarizes the most advanced and past work in which we can see the skin
disease classification at single, binary, or multi-level using different features. With the help of
ABCD rule implementation, an automated system is developed for the most common skin cancer,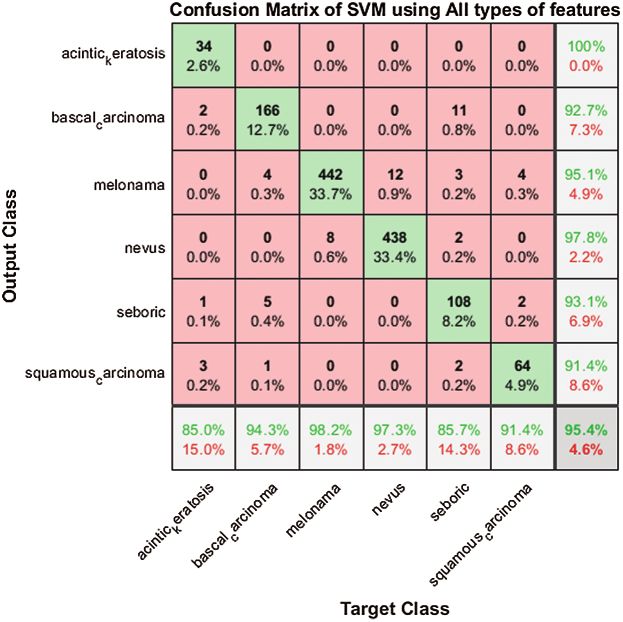
CMC, 2022, vol.70, no.1                                                                          1619

melanoma, which identifies either it is malignant or benign. After implementing the ABCD rule,
dermatologists confirm the phase of melanoma and, according to this phase, proposed possible
treatments [14]. A computerized smartphone application is used to detect melanoma skin cancer
using the ABCD rule. Image capture capabilities, combined with segmentation and preprocessing,
are used to extract ABCD features for each skin lesion image, to identify the disease uniquely [15].
    The ABCD rule and texture features are combined to provide an automatic diagnosis of
melanoma cancer. In this study, a computational method using dermoscopic images is devel-
oped to help dermatologists differentiate between non-melanoma and melanoma skin lesions [16].
A novel approach is introduced to identify melanoma using the ABCD rule based on mobile
devices. Different sensor-based mobile devices are used to input images and accurately detect
melanoma cancer from input images [17]. A study was conducted to discriminate benign lesions
and malignant melanoma using the ABCD rule to separate benign lesions from malignant [18].
    Melanoma skin cancer is a dangerous type of cancer that kills more people each year
than other types of skin cancer. Based on non-linear and linear features, the proposed system
automatically diagnosed melanoma. Different features extracted from melanoma images, such as
texture features and ABCD rule, distinguish between malignant melanoma and benign lesion [19].
Effective medication for melanoma is critical at the initial stage. According to all the above
studies is about melanoma is the most vulnerable form of skin cancer. As a result, more death
occurs every year. Thresholding-based techniques are used for segmentation and statistical feature
extraction. GLCM (Gray Level Co-occurrence Matrix), Color, Asymmetry, Diameter, and Bor-
der features are extracted from collected images [20]. Based on specific characteristics (Energy,
Autocorrelation, Homogeneity, Contrast, Entropy), an automated system is introduced to help
physicians or doctors to easily classify or detect skin cancer types (AK, BCC, SCC, M) [21].
     Deep learning techniques were used to classify six significant diseases as (AK, rosacea (ROS),
BCC, SCC, lupus erythematosus (LE), and SK) [22]. Skin cancer is still a challenging task in
deep and machine learning fields. The proposed method classifies two disease classes: melanoma
and seborrheic keratosis using deep neural networks [23]. Using a deep neural network with
human expertise, this algorithm classifies four common skin diseases: MN, BCC, SK, and psoriasis
(P) [24].

3 Proposed Methodology
     The proposed framework steps with CNN-based Segmentation and Fused Features based
classification is shown in Fig. 1. First, the dataset is normalized using six classes of skin disease.
Data is then fed to CNN Network for Segmentation, which returns the lesion areas, which are
later segmented using size filter operation. After that, the Deep features using AlexNet, GLCM
features, and ABCD rules are extracted from segmented lesions. These features are later given to
SVM for classification.
     The ISIC and Mendeley dataset is used that is publicly available. The 4363 images were col-
lected based on six common skin diseases. The targeted six classes are Nevus (N), SK, Melanoma
(M), SCC, AK, and BCC.
    The melanoma and nevus images gathered from Mendeley [25], and the other four types of
diseases (SK, BCC, SCC, AK) images were collected from the ISIC archive [26]. The proposed
study will focus on the above-mentioned diseases for two reasons: First, diseases that appear on
the face, such as BSS, SCC, M, and N. Second, AK and SK disease commonly transition from
benign to malignant due to inappropriate medication.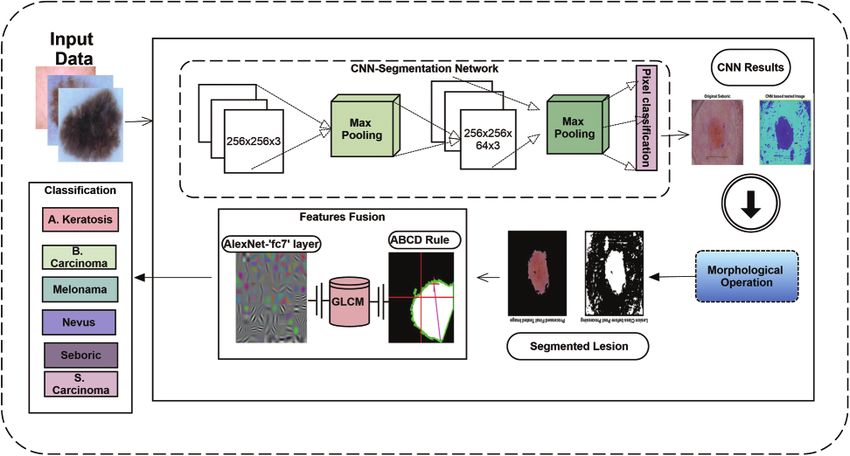
1620                                                                        CMC, 2022, vol.70, no.1

                             Figure 1: Proposed framework flowchart

     The input image is the first and essential step to begin the proposed framework. After the
collection of images, labels are prepared using ground-truth values by annotating rectangular or
irregular-shaped polygons, and it finally generates ground-truth values in the form of image masks.
The originally collected and normalized input images of target diseases are presented in Fig. 2.

 Figure 2: 1st row represents without normalization and 2nd row represents normalized images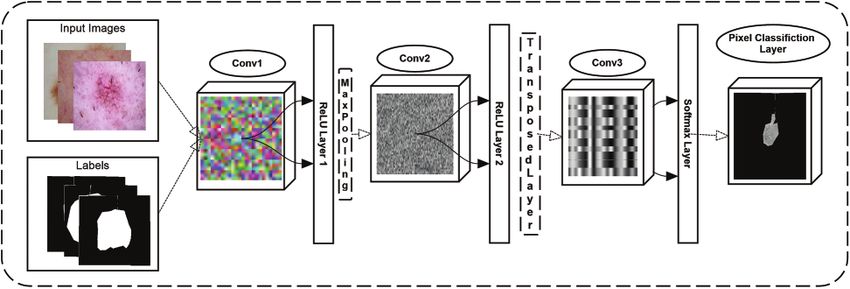
CMC, 2022, vol.70, no.1 1621
3.1 Data Normalization
Data augmentation techniques were used to resize collected images because the dataset col-
lected from two databases with images contain different sizes for different types of diseases. In
this process, Eq. (1). is used to resize the images.
1
m, n
MSE = I(i, j)K(i, j) (1)
mn
i, j=0
The calculated MSE value is further passed to the PSNR value, where all operations are
performed using the nearest neighbor interpolation method.
3.2 Semantic Segmentation Using CNN
In the proposed technique, segmentation is performed for the background and lesion areas
using a CNN model. The size of the input is crucial because it forms the basic structure of CNN.
The image 256 × 256 × 3 with “zero centers” normalization input size is given to the input layer
of the CNN. The convolution layer of CNN takes images from the input layer and applies 64
filters with sizes based on 3 × 3, [1 1] convolution stride, and [1 1 1 1] padding on the selected
images. The ReLU activation function is used as a decision-making function on the convolution
layer.
Following that, size 2 × 2 max pooling is performed using [2 2] stride and [0 0 0 0] padding.
Then, with the same customization, two more convolutional blocks are added. Finally, two fully
connected layers are introduced: one is a pixel classification layer, and the other is a SoftMax
layer, which is performed after three convolution layers.
The SoftMax layer calculates the probability of the predicted classes, and other layers classify
target images into lesions and backgrounds. The proposed architecture of CNN is shown in
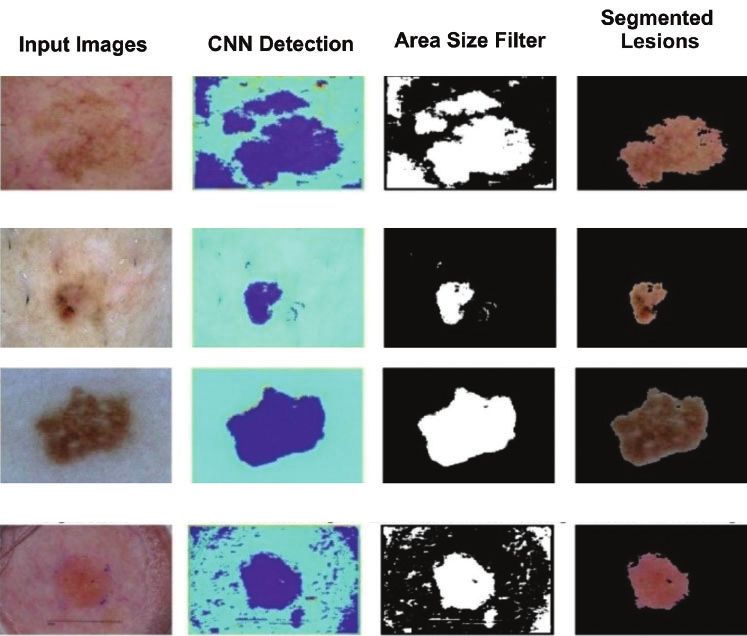
Fig. 3. and a sample of segmented images of skin diseases using CNN is shown in Fig. 4.
Figure 3: Proposed CNN architect for skin lesion segmentation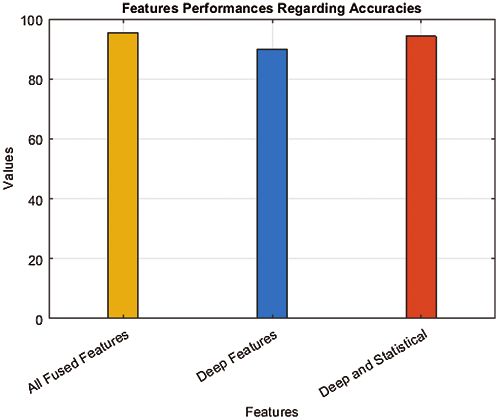
1622                                                                           CMC, 2022, vol.70, no.1

                           Figure 4: Proposed framework segmentation results

3.3 Size Filter
     After applying CNN to testing data, some noise had to be removed before moving on to the
lesion class. We use component labeling operations to remove them where noise has less connected
components than lesion area. In the proposed study, an area selection threshold greater than 50
value removes all noise from the images and makes the lesion a final segmented component.
I = max(|xi − xj |, |yi − yj |                                                                     (2)

    The binary image considers I, x, and y as digital lattice coordinates, then the 8-connectedness
of pair of pixels leads to specific metrics that can be used to find objects based on shape or size.
These calculations are shown in Eq. (2) [27].

3.4 Feature Extraction
    After the segmentation process, skin lesions’ features are extracted and used to overcome the
problem of misclassification. Different types of features, such as the ABCD rule, GLCM features,
and in-depth learning-based features are extracted from segmented images. Principal component
analysis (PCA) is used to get gray co-matrix to calculate GLCM features. The explanation of
these mentioned features is defined below.
CMC, 2022, vol.70, no.1 1623
3.4.1 ABCD Rule
One of the most commonly used methods for accurate skin lesion detection is ABCD (asym-
metry, border, color, diameter) parameters. Because these multi-class do not classify uniquely,
the collected images have similarities, which is why the ABCD rule is used in the proposed
approach and provides good classification accuracy. The acronym of ABCD categorizes clinical
and morphological features of skin lesions or mole. The “symmetry” feature used lesion images,
which are not symmetric, with the images’ principal x–y and lesion axes aligned (if there is any
asymmetry) on the images of significant axes. An irregular border is a notched, ragged, or blurred
edge of skin lesion image. The border is translating with peaks in the function, which shows the
irregularity of the border.
The color feature indicates various colors in collected images such as white, blue, black,
brown, red, etc. The diameter feature described the size of the lesion in a particular image, and
each target disease diameter is different.
3.4.2 GLCM Features
After ABCD feature extraction, different statistical parameters such as Correlation, Homo-
geneity, Contrast, Energy are computed.
Statistical analysis is used for skin lesion detection analysis. The PCA algorithm is used to
extract these types of features. To obtain statistical parameters, images are converted to grey level.
By creating GLCM and its features; statistical measures are extracted [28]. Statistics measures
provide information about the texture of the image. Detailed information about statistical features
is given below.
Homogeneity This feature shows the Regularity of the calculated region because it computes
the distribution of elements in the GLCM to the GLCM diagonal. The following Eq. (3) is used
to calculate homogeneity.
p(i, j)
Homogeneity = (3)
1 + |i − j|
i, j
Energy Energy feature is used to calculate uniformity for different images. It is also known
as the angular second moment or uniformity of the image. The constant energy of an image is
defined as 1 because its range starts from 0 to 1 as shown in Eq. (4).
Energy = p(i, j)2 (4)
i, j
Correlation The correlation feature is used to calculate the correlation between the pixels of
different skin images. Eq. (5) shows how much a pixel of an image is correlated with its neighbor,
and its range starts from −1 to 1.
(i − μi)(j − μj)p(i, j)
Correlation = (5)
σ iσ j
i, j1624 CMC, 2022, vol.70, no.1
Contrast Contrast is used to show the difference in brightness and color of the selected lesion’s
object. It can be calculated using the following formula as shown in Eq. (6).
g
Contrast = wi μ i (6)
i=1
3.4.3 Deep Features
The AlexNet algorithm is used to perform deep feature extraction on images [29]. For this
process, the images were resized to 227 × 227 × 3. The workspace is loaded with the pre-trained
model, and a fully connected layer named “fc7” is used for transfer learning. Activations were
performed on training and testing images using “fc7” layer. A total of 4363 images were activated,
with 3053 images (70%) used for training and 1310 images (30%) used for testing, which creates
vectors of size 4096.
3.5 Classification
Support Vector Machine (SVM) is a machine learning algorithm [30]. The SVM is a
supervised learning algorithm that is used for classification problems. The best optimal path is
determined using SVM between possible outcomes. In the classification process, the SVM achieves
the highest accuracy than other classifiers. SVM only relies on the support vectors, which are the
training samples that lay precisely on the hyperplanes used to define margin. We used the SVM
as a multi-class classifier by splitting data into a 70–30 ratio of training and testing.
4 Results and Discussion
This study’s main goal is to classify multiple skin disease images using a deep convolutional
neural network. A total of 4363 skin disease images were collected from (ISIC Archive, Mendeley)
based on six types of different widespread diseases. The description of the dataset is mentioned
in table Tab. 1.
Table 1: Normalized dataset description
Classes Abbreviations Numbers Property Description
Nevus N 1500 Format JPG
Melanoma M 1500 Coloring model RGB
Seborrheic Keratosis SK 419 Dimension 256 × 256 × 3
Actinic Keratosis AK 132 Dataset 1 ISIC
Basal Cell Carcinoma BCC 586 Dataset 2 Mendely
Squamous Cell Carcinoma SCC 226 New dataset Dataset 1 + Dataset 2
Total 4363
The collected images are of different sizes, which is incapable of training the CNN model.
The resize function is performed on the dataset so that images convert in the same size—the image
256 × 256 × 3 with “zero centers” normalization input size given to the CNN input layer. A total
of 3053 images are used to train, and the other 1310 images are used for testing.CMC, 2022, vol.70, no.1 1625
4.1 Evaluation of CNN
A CNN for semantic segmentation is inspired by recent papers [31,32], which is trained on
lesion and background class images and evaluated on data that return a global mean accuracy of
0.80313, regardless of global class accuracy, which is a ratio of correctly classified pixels of each
image. IoU is a segmentation metric that tells us about the predicted and ground-truth areas. The
proposed CNN achieves 0.44409 for Mean IoU. Tab. 2 shows evaluation metrics of CNN:
Table 2: CNN evaluation results
Global accuracy Mean accuracy Mean IoU Weighted IoU Mean BF score
0.80313 0.72863 0.44409 0.70404 0.26686
4.2 Evaluation of Classification Approaches
After the segmentation process, different features (ABCD, Statistical, and Deep based features)
were extracted to help the classification process. We extracted and evaluated the testing data with
in-depth features on SVM. Tab. 3 showing the evaluation metrics.
Table 3: Deep features classification results using SVM
Total accuracy 89.77%
Classes Accuracy (%) Specificity Precision F1-score
A. Keratosis 55.0 0.995 0.785 0.647
B. Carcinoma 87.5 0.972 0.832 0.853
Melonama 98.0 0.968 0.942 0.960
Nevus 97.33 0.983 0.969 0.971
Seboric 69.84 0.977 0.765 0.730
S. Carcinoma 48.52 0.976 0.532 0.507
The above table shows that Melonama and Nevus’s results are good, whereas other classes
need more accuracy improvement. However, we added and concatenated the Deep Features with
GLCM and other statistical features to improve the results using more features. We then con-
catenated the in-depth feature vector with the GLCM features vector, and the SVM classifier was
created again and tested on testing data. The results are shown in Tab. 4.
The below table shows improved results in less accurate classified classes and improved
accuracy for already improved classes, where it also increases the overall accuracy of all classes
from 89.8% to 94.2%.
Finally, we concatenated all three features to get more improved results for all classes. How-
ever, it improved results with overall accuracy and less accurate classes. The results are shown in
Tab. 5.1626 CMC, 2022, vol.70, no.1
Table 4: Deep and statistical features fusion classification results using SVM
Total accuracy 94.20%
Classes Accuracy (%) Specificity Precision F1-score
A. Keratosis 80.0 0.999 0.969 0.876
B. Carcinoma 88.0 0.983 0.890 0.885
Melonama 98.0 0.977 0.958 0.969
Nevus 100 0.987 0.976 0.987
Seboric 83.33 0.986 0.867 0.850
S. Carcinoma 75.0 0.991 0.836 0.790
Table 5: Deep, ABCD, and statistical features fusion classification results using SVM
Total accuracy 95.42%
Classes Accuracy (%) Specificity Precision F1-score
A. Keratosis 85.0 1.00 1.00 0.918
B. Carcinoma 94.3 0.988 0.927 0.935
Melonama 98.2 0.973 0.950 0.966
Nevus 97.33 0.988 0.977 0.975
Seboric 85.71 0.993 0.931 0.892
S. Carcinoma 91.4 0.995 0.914 0.914
Figure 5: Confusion matrix on testing data using SVMCMC, 2022, vol.70, no.1 1627
The above table shows the proposed study results, which improved the results compared
to single or double-type feature fusion. The accuracy, specificity, precision, and F1-Score are
improved overall, where the proposed study’s Confusion Matrix is shown in Fig. 5. The graphical
representation of all feature approaches using SVM is shown in Fig. 6.
Figure 6: Accuracies of proposed features approaches using SVM
The SVM achieved 95.4% accuracy with a 4.6 error rate, which is higher than previous studies.
The proposed method classifies multiple skin diseases accurately using a combination of features
mentioned above.
Table 6: Comparison of existing relevant approaches
Authors Single/ ABCD Statistical Accuracy Classifiers
multi-class features features (%)
disease
[15] Single Yes No 90 SVM
[16] Single Yes No 92.1 CNN, AlexNet, VGG, SVM
[22] Multi No No 67 CNN, ResNet DenseNet
[23] Multi No No 90.69 VGG16, AlexNet, ResNet-18, SVM
[24] Multi No No 87.25 GoogleNet
[27] Multi No No 86.21 CNN, SVM
[28] Multi No No 0.89 CNN, ResNet, SVM
[29] Multi No No 81.8 AlexNet, CNN
Proposed Multi Yes Yes 95.4 CNN, ABCD, GLCM AlexNet, SVM1628 CMC, 2022, vol.70, no.1
4.3 Comparison of Proposed Study
For experimentation, our method overall results are significantly better than the previously
reported works as 90% [15], 92.1% [16], 67% [22], 90.69% [23], 87.25% [24], 86.21% [33], and
89.0% [34] are some studies that are compared with the proposed framework. The proposed study,
significantly achieves better accuracy results as shown in Tab. 6.
5 Conclusion
This paper discussed the analysis and classification of multi-level skin disease images using
a combination of features for accurate detection. Segmentation was performed on images using
the CNN to achieve 0.80313% accuracy. After segmentation, the segmented images were obtained
to a size filter operation to remove noise. Statistical features are extracted using the PCA and
GLCM algorithms, and Deep features are extracted using the AlexNet transfer-learning method.
The ABCD rule features are also extracted. These features are concatenated one by one for
classification. In terms of sensitivity, specificity, accuracy, and error rate, the SVM algorithm
outperforms other methods. The proposed framework achieves 91% sensitivity, 98% specificity,
94% precision, 95.4% accuracy, and an error rate of 0.04, which is better than other compared
approaches.
The proposed method achieves higher accuracy using ABCD; statistical and deep features
than other methods compared in research work. However, the proposed framework uses 4363
images for six types of skin diseases. The dataset size and number of diseases can be increased,
which can affect the performance of the proposed study.
5.1 Future Work
In the future, more datasets of ISIC challenges regarding skin diseases can be added where
more diseases can be used for identification. Moreover, more of images can improve the semantic
segmentation results.
Acknowledgement: We would like to thank the anonymous reviewers for their help in improving
the quality of the manuscript.
Funding Statement: The authors extend their appreciation to the Deanship of Scientific Research
at King Saud University for funding this work through research group number RG-1440-048.
Conflicts of Interest: The authors declare that they have no conflicts of interest to report regarding
the present study.
References
[1] R. J. Hay and L. C. Fuller, “Global burden of skin disease in the elderly: A grand challenge to skin
health,” G Ital. Dermatol. Venereol., vol. 150, no. 6, pp. 693–698, 2015.
[2] K. Montgomery and A. R. Thompson, “Developing sensitivity to the psychological burden associated
with skin conditions: A call for training,” British Journal of Dermatology, vol. 179, no. 2, pp. 237–
238, 2018.
[3] R. J. Hay, N. E. Johns, H. C. Williams, I. W. Bolliger, R. P. Dellavalle et al., “The global burden of
skin disease in 2010: An analysis of the prevalence and impact of skin conditions,” J. Invest. Dermatol.,
vol. 134, no. 6, pp. 1527–1534, 2017.
[4] A. Picardi, I. Lega and E. Tarolla, “Suicide risk in skin disorders,” Clinics in Dermatology, vol. 31,
no. 1, pp. 47–56, 2013.CMC, 2022, vol.70, no.1 1629
[5] U. O. Dorj, K. K. Lee, J. Y. Choi and M. Lee, “The skin cancer classification using deep convolutional
neural network,” Multimedia Tools and Applications, vol. 77, no. 8, pp. 9909–9924, 2018.
[6] R. L. Siegel, K. D. Miller, S. A. Fedewa, D. J. Ahnen, R. G. Meester et al., “Colorectal cancer statistics,
2017,” CA: A Cancer Journal for Clinicians, vol. 67, no. 3, pp. 177–193, 2017.
[7] R. L. Siegel, K. D. Miller and A. Jemal, “Cancer statistics,” CA: A Cancer Journal for Clinicians, vol. 66,
no. 1, pp. 7–30, 2016.
[8] R. P. Braun, S. Ludwig and A. A. Marghoob, “Differential diagnosis of seborrheic keratosis: Clinical
and dermoscopic features,” Journal of Drugs in Dermatology, vol. 16, no. 9, pp. 835, 2017.
[9] M. Scalvenzi, S. Lembo, M. G. Francia and A. Balato, “Dermoscopic patterns of superficial basal cell
carcinoma,” International Journal of Dermatology, vol. 47, no. 10, pp. 1015–1018, 2008.
[10] A. Lalji and M. Lalji, “Actinic keratosis and squamous cell carcinoma,” Clin. Res. Dermatol. Open,
vol. 1, no. 1, pp. 1–3, 2014.
[11] J. Gao, H. Wang and H. Shen, “Smartly handling renewable energy instability in supporting a cloud
datacenter,” in IEEE Int. Parallel and Distributed Processing Sym., New Orleans, Louisiana, United
States, 2020.
[12] J. Gao, H. Wang and H. Shen, “Task failure prediction in cloud data centers using deep learning,” in
IEEE Int. Conf. on Big Data (Big Data), Los Angeles, CA, USA, 2019.
[13] T. T. K. Munia, M. N. Alam, J. Neubert and R. Fazel-Rezai, “Automatic diagnosis of melanoma using
linear and nonlinear features from digital image,” in Annu. Int. Conf. IEEE Eng. Med. Biol. Soc., Jeju
Island, Korea, pp. 4281–4284, 2017.
[14] V. Rajinikanth, N. S. M. Raja and S. Arunmozhi, “ABCD rule implementation for the skin
melanoma assesment—A study,” in IEEE Int. Conf. on System, Computation, Automation and Networking,
Pondicherry, India, pp. 1–4, 2019.
[15] U. Kalwa, C. Legner, T. Kong and S. Pandey, “Skin cancer diagnostics with an all-inclusive smartphone
application,” Symmetry, vol. 11, no. 6, pp. 790, 2019.
[16] N. Moura, R. Veras, K. Aires, V. Machado, R. Silva et al., “Combining abcd rule, texture fea-
tures and transfer learning in automatic diagnosis of melanoma,” in IEEE Sym. on Computers and
Communications, Natal, Brazil, pp. 508–513, 2018.
[17] H. R. Firmansyah, E. M. Kusumaningtyas and F. F. Hardiansyah, “Detection melanoma cancer
using abcd rule based on mobile device,” in Int. Electronics Sym. on Knowledge Creation and Intelligent
Computing, Surabaya, Indonesia, pp. 127–131, 2017.
[18] R. Kasmi and K. Mokrani, “Classification of malignant melanoma and benign skin lesions: Imple-
mentation of automatic abcd rule,” IET Image Processing, vol. 10, no. 6, pp. 448–455, 2016.
[19] T. T. K. Munia, M. N. Alam, J. Neubert and R. F. Rezai, “Automatic diagnosis of melanoma using
linear and nonlinear features from digital image,” in 39th Annual Int. Conf. of the IEEE Engineering in
Medicine and Biology Society, Seogwipo, South Korea, pp. 4281–4284, 2017.
[20] R. J. Hay, N. E. Johns, H. C. Williams, I. W. Bolliger, R. P.Dellavalle et al., “The global burden of skin
disease in 2010: An analysis of the prevalence and impact of skin conditions,” Journal of Investigative
Dermatology, vol. 134, no. 6, pp. 1527–1534, 2014.
[21] R. Maurya, S. K. Singh, A. K. Maurya and A. Kumar, “GLCM and multi class support vector
machine based automated skin cancer classification,” in Int. Conf. on Computing for Sustainable Global
Development (INDIACom), New Delhi, India, pp. 444–447, 2014.
[22] Z. Wu, S. Zhao, Y. Peng, X. He, X. Zhao et al., “Studies on different CNN algorithms for face skin
disease classification based on clinical images,” IEEE Access, vol. 7, pp. 66505–66511, 2019.
[23] A. Mahbod, G. Schaefer, C. Wang, R. Ecker and I. Ellinge, “Skin lesion classification using hybrid
deep neural networks,” in IEEE Int. Conf. on Acoustics, Speech and Signal Processing, Brighton, United
Kingdom, pp. 1229–1233, 2019.
[24] X. Zhang, S. Wang, J. Liu and C. Tao, “Towards improving diagnosis of skin diseases by combining
deep neural network and human knowledge,” BMC Medical Informatics and Decision Making, vol. 18,
no. 2, pp. 59, 2018.1630 CMC, 2022, vol.70, no.1
[25] M. Goyal, “Natural data-augmentation for skin lesions (ISIC-2017 challenge dataset),” vol. 1, 2017.
[Online]. Available: https://data.mendeley.com/datasets/9fckvw84z8/1.
[26] “The international skin imaging colaboration (ISIC),” 2020. [Online]. Available: https://www.isic-archive.
com/#!/topWithHeader/onlyHeaderTop/gallery.
[27] E. R. Davies. “Chapter 8—binary shape analysis,” in Computer Vision, 5th ed., Cambridge, Mas-
sachusetts, United States: Academic Press, Elsevier, pp. 203–238, 2018.
[28] E. K. Sharma, E. Priyanka, E. A. Kalsh and E. K. Saini, “GLCM and its features,” International
Journal of Advanced Research in Electronics and Communication Engineering, vol. 4, no. 8, 2015.
[29] A. Krizhevsky, I. Sutskever and G. E. Hinton, “Imagenet classification with deep convolutional neural
networks,” in Proc. of the 25th Int. Conf. on Neural Information Processing Systems, Lake Tahoe, Nevada,
pp. 1097–1105, 2012.
[30] S. Escalera, O. Pujol and P. Radeva, “On the decoding process in ternary error-eorrecting output
codes,” IEEE Transactions on Pattern Analysis and Machine Intelligence, vol. 32, no. 1, pp. 120–134, 2010.
[31] T. Meraj, H. T. Rauf, S. Zahoor, A. Hassan, M. I. Lali et al. “Lung nodules detection using semantic
segmentation and classification with optimal features,” Neural Computing and Applications, 2020.
[32] M. A. Anjum, J. Amin, M. Sharif, H. U. Khan, M. S. A. Malik et al., “Deep semantic segmentation
and multi-class skin lesion classification based on nonvolutional neural network,” IEEE Access, vol. 8,
pp. 129668–129678, 2020.
[33] N. Hameed, A. M. Shabut and M. A. Hossain, “Multi-class skin diseases classification using deep
convolutional neural network and support vector machine,” in 12th Int. Conf. on Software, Knowledge,
Information Management & Applications, Phnom Penh, Cambodia, pp. 1–7, 2018.
[34] S. S. Han, M. S. Kim, W. Lim, G. H. Park, I. Park et al., “Classification of the clinical images
for benign and malignant cutaneous tumors using a deep learning algorithm,” Journal of Investigative
Dermatology, vol. 138, no. 7, pp. 1529–1538, 2018.You can also read