Using Decision Tree Classification Model to Predict Payment Type in NYC Yellow Taxi
←
→
Page content transcription
If your browser does not render page correctly, please read the page content below

(IJACSA) International Journal of Advanced Computer Science and Applications,
                                                                                                                      Vol. 13, No. 3, 2022

  Using Decision Tree Classification Model to Predict
         Payment Type in NYC Yellow Taxi
                                       Hadeer Ismaeil, Sherif Kholeif, Manal A.Abdel-Fattah
                          Information Systems Department, Faculty of Computers and Artificial Intelligence
                                                Helwan University, Cairo, Egypt

    Abstract—The taxi services are growing rapidly as reliable               When talking about machine learning, Spark has two types
services. The demand and competition between service providers          of machine learning libraries: Spark MLlib, and Spark ML.
is so high. A billion trip records need to be analyzed to raise the     Spark MLlib is the original API and it is based on RDD API,
spirit of competition, understand the service users, and improve        so it has more features than the new API (Spark ML). Spark
the business. Although decision tree classification is a common         ML provides high-level API, and it is based on data frames and
algorithm which generates rules that are easy to understand,            dataset; it supports pipeline and easier to construct. Spark
there is no implementation for classification on taxi dataset. This     MLlib focuses on the basics of the algorithm leaving data
research applies the decision tree classification model on taxi         preparation and pipelines to the user, but Spark ML works on
dataset to classify instances correctly, build a decision tree, and
                                                                        all those aspects from data preparation to model training. Spark
calculate accuracy. This experiment collected decision tree
                                                                        MLlib is the best choice when dealing with a stream of data.
algorithm with Spark framework to present the good
performance and high accuracy when predicting payment type.             The new features will be added to Spark ML and this why this
Applied decision tree algorithm with different aspects on NYC           research will use Spark ML. [4].
taxi dataset results in high accuracy.                                      Spark ML is based on pipeline concept which uses different
                                                                        stages to perform separate tasks from data cleaning to feature
    Keywords—Big data analytics; apache spark; decision tree            selection and applying machine learning algorithm. Pipeline
classification; taxi trips; machine learning
                                                                        stages consist of two basics transformers and estimators.
                         I.   INTRODUCTION                              Transformers use transform method which takes a data set as
                                                                        input and returns an enhanced dataset as a result. Estimators,
     Big data describes the large volume of data, but there’s no        when fit, returns a transform, it uses the fit method on data set
rule strictly defines the size of data. What really determines          to produce a model. A decision tree is an estimator that trains
that the data is big, is the need for multiple physical or virtual      dataset to produce a model [4].
devices to process this data as fast as possible. In [1], this data
is generated by everything around us like systems, digital                  Classification is an important technique for assigning a data
devices, and remote sensors. Big data is used for collecting and        object to predefined class or category. One of the most
analyzing large and complex data sets to produce knowledge.             commonly used algorithms, used to apply a classification
In the past, storing, processing, and analyzing this volume of          technique, is the Decision tree algorithm. Decision tree one of
data were a problem; but new technologies solved this problem           the important algorithms in Classification technique. It builds a
[2].                                                                    tree model. Decision tree algorithm is popular because it’s easy
                                                                        to implement and understand. In addition, it is simple and fast
    One of the tools that are used to analyze data is Apache            to construct compared to other classification algorithms.
Spark, which is open-source data analytics tools. Spark is
based on MapReduce, but it’s faster as it stores the data in the            Decision tree algorithms extract knowledge from data,
memory into RDD (Resilient Distributed Databases) [3]. Fig. 1           present it graphically and produce a clear and understandable
represents the difference between Spark and Hadoop                      rule. It is one of the most powerful and popular algorithms that
performance.                                                            can handle continuous and categorical variables using less
                                                                        computation. The most common used decision tree algorithms
                                                                        are ID3, C4.5, and CART. C4.5 is an improved version of ID3.
                                                                        [5][6].
                                                                            Transportation plays a vital role in human life especially
                                                                        Taxi and Car services. As a business, it is a huge industry.
                                                                        Every minute there is a hundred of trips from just a single
                                                                        zone, which create a huge amount of data [7] [8]. NYC Taxi
                                                                        and Limousine commission provides an open Dataset that
                                                                        includes detailed trip record from NYC yellow taxi through
                                                                        2017. Predicting payment method is considered important to
                                                                        business. Customers add their credit card only in trusted
                                                                        services. The greater the number of registered or used credit
              Fig. 1. Spark and Hadoop Performance. [3].                cards, the higher the service reliability is. It is also important to

                                                                                                                              238 | P a g e
                                                           www.ijacsa.thesai.org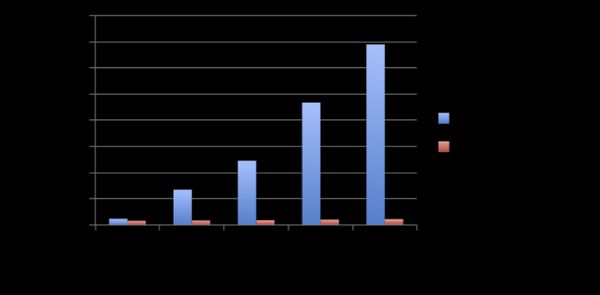
(IJACSA) International Journal of Advanced Computer Science and Applications,
                                                                                                                  Vol. 13, No. 3, 2022

the driver to know the payment method as some drivers prefer        big data processing, although they differ in important ways.
cash and others prefer credit for guaranteed payment. This          Hadoop processes data using MapReduce, whereas Spark
dataset can be used to predict a lot of things like passenger       employs resilient distributed datasets (RDDs). Hadoop uses a
count, Hotspot to reduce peak factor, Rush hour for extra           distributed file system (HDFS), which allows data files to be
charges and high demand at a specific time.                         stored on several machines. Because servers and machines may
                                                                    be added to accommodate increasing data quantities, the file
                       II. BACKGROUND                               system is scalable. Because Spark lacks a distributed file
A. Big Data Analytics                                               storage system, it is mostly utilized for computation on top of
                                                                    Hadoop. Spark does not require Hadoop to run, although it can
    The concept of big data has been around for years, and          be used with Hadoop because it can construct distributed
most firms now realize that if they capture all the data that       datasets from HDFS files. Spark does not provide a distributed
flows into their operations, they can use analytics to extract      file storage system; it is mostly utilized for computation on top
tremendous value. Big data analytics assists businesses in          of Hadoop. Spark does not require Hadoop to run, although it
harnessing their data and identifying new opportunities. As a       can be used with Hadoop because it can construct distributed
result, smarter business decisions, more effective operations,      datasets from HDFS files. The performance gap between
higher profits, and happier consumers are the result. Big data      Hadoop and Spark is significant. UC Berkeley researchers
analytics is the often-difficult process of analyzing large         noticed that Hadoop is wonderful for batch processing but
amounts of data to identify information such as hidden              inefficient for iterative processing, so they invented Spark to
patterns, correlations, market trends, and customer preferences     address this. Spark program iteratively run 100 times quicker
that can assist businesses in making better decisions. Data         in memory than Hadoop and 10 times faster on disc. Spark's
analytics tools and approaches provide organizations with a         quickness is attributed to its in-memory processing. Instead,
way to evaluate data sets and obtain new information on a large     Hadoop MapReduce sends data to disc, which is read on the
scale. Basic questions regarding business operations and            next iteration. It is substantially slower than Spark because data
performance are answered by business intelligence (BI)              is reloaded from disc after each iteration [11].
queries. Big data analytics is a type of advanced analytics that
entails complicated applications that use analytics systems to      C. Apache Spark MLlib
power aspects like predictive models, statistical algorithms,           MLlib, an Apache Spark machine learning library, covers
and what-if analyses [9].                                           the major machine learning methods such as classification,
    Without the right tools, methods, and techniques, big data      clustering, regression, dimensionality reduction, transformers,
analytics    can     be    time-consuming,      difficult,   and    and collaborative filtering. Some machine learning techniques
computationally demanding. When the amount of data is too           can be applied to streaming data, which is useful for Spark
large to analyze and analyze on a single machine, Apache            Streaming applications [12].
Spark and Apache Hadoop can help by using parallel and              D. Classification
distributed processing. It is critical to first comprehend the
                                                                        Classification is a method of locating models that describe
concept of "big data" to comprehend the significance of
                                                                    multiple data classes or concepts. By performing analysis, The
parallel and distributed processing. The fast rate at which big
                                                                    class labels that are known for a set of training data or data
data is generated necessitates that it be processed quickly, and
the variety of big data implies that it contains several data       objects during this model can be obtained. The primary goal of
kinds, including structured, semi-structured, and unstructured      this model is to properly anticipate an unknown object's class
data. Because of the amount, velocity, and variety of big data,     label. The classification problem should include some input
new, novel methodologies, and frameworks for collecting,            that is regarded as training data with class labels and is utilized
storing, and analyzing the data were developed, which is why        to determine the class label for unlabeled test data or instances.
Apache Hadoop and Apache Spark were formed.[10].                        The primary challenge for categorization is data
                                                                    preparation. This procedure includes the following steps:
B. Big Data Analytics Tools
                                                                    selecting, pre-processing, data cleaning, data integration and
    Understanding parallel and distributed processing helps in      transforming.
understanding big data analytics tools and how they are used.
Because both parallel processing and distributed processing             Decision Trees are the most common classification
entail breaking down computation into smaller sections, the         algorithms. A decision tree is described as a flow chart with a
two can be confused. The memory architecture distinguishes          tree structure that includes a root node, non-leaf nodes, and leaf
parallel computing from distributed computing. Parallel             nodes. Each non-leaf node describes a test attribute, each
computing is the use of several processors to solve a problem       branch describes a test outcome, and each leaf node retains the
at the same time. Distributed computing is the use of multiple      class label. The basic idea behind the decision tree is to divide
computers to solve a problem at the same time. Because              the data recursively into subsets with the final goal of having
distributed computing is disk-based rather than memory-based,       each subset contain nearly homogeneous states of the target
parallel computing processes have access to the same memory         variable. The attribute selection measure must choose a
space as distributed computing workloads. Some distributed          splitting criterion that "best" separates the given dataset. Some
computing operations are performed on a single computer,            well-known decision tree algorithms include ID3, C4.5, and
while others are performed on multiple computers. Apache            CART, which use the Information Gain, Gain Ratio, and Gini
Hadoop and Apache Spark are both open-source systems for            Index as attribute selection measures, respectively. C5 is also a
                                                                    decision tree-based algorithm that is an improved version of

                                                                                                                        239 | P a g e
                                                       www.ijacsa.thesai.org
(IJACSA) International Journal of Advanced Computer Science and Applications,
Vol. 13, No. 3, 2022
C4.5. When the decision tree is built, it is used to categorize In [17], S. Salloum, et. al. presented the importance of big
another new instance by traversing from the root node to the data analytics, Spark framework, and how Spark was initiated.
leaf node and applying the test criteria at each non-leaf node. They also presented the core features of Spark, Spark
Each instance's class is the class of the leaf node [6]. Components, how Apache Spark is perfect when dealing with
iterative analysis and algorithms, and Apache Spark case
III. RELATED WORK studies in industry. They described Spark API’s and Libraries
In [6], B. Charbuty, et. al. studied and compared the most and compared different libraries, compared machine learning
popular decision tree algorithms, ID3, C4.5, CART, CHAID, packages (spark.ml and spark. MLlib), and the use of each of
and QUEST as the most common data classifier. Literature them. Other features and packages were introduced like Graph
review related to Decision Tree was presented. The literature analysis, stream processing, batch streaming, and interactive
review compared different research papers work in terms of analytics.
year of study, dataset, techniques, or algorithms used on the
predefined dataset, and the resulted accuracy. The literature IV. DATASET
reviews the most recent research papers applied in different The dataset describes yellow taxi trips throughout January
areas/datasets like medical, text classification, user 2017. NYC Taxi and Limousine Commission (TLC) shares a
smartphones classification, etc. this study proves the efficiency billion of data through their website [18].
of decision tree in creating efficient and understandable rules
and achieving high accuracy. This data was collected by technology providers authorized
under the Taxicab & Livery Passenger Enhancement Programs
In [13] B. Roy, et. Al. applied a set of machine learning (TPEP/LPEP) and provided to NYC Taxi and Limousine
algorithm to predict trip duration between two locations. One Commission. This data was not generated but collected from
of the algorithms used in this research was Decision tree real life. This dataset contains 1048575 trip records. Each trip
Regression Model with varying max depth parameter and record contains a timestamp for pickup and drop-off, the id of
default values for other hyperparameters. Decision tree the vendor that provided the record, pickup and drop-off
regression model with the biggest max depth achieved the best location, passenger count, trip distance, payment type and
accuracy compared to the lower max depth. But other detailed information about the amount paid by the passengers.
regression achieved better accuracy than decision tree Data dictionary was illustrated in Table I.
regression model with different max depth.
TABLE I. DATA DICTIONARY
In [14], S. Singh, et. al. studied and compared the most
popular decision tree algorithms, ID3, C4.5, and CART. The Attribute Name Description
survey described the advantage and disadvantage of each A code indicating the TPEP provider that provided
algorithm. The survey also contains a comparison between the record.
Vendor ID
characteristics of each algorithm like the type of data suitable 1= Creative Mobile Technologies, LLC.
for each algorithm, speed, dealing with missing values and 2= VeriFone Inc.
splitting formula. It also shows some application of decision The date and time when the meter were engaged, it
tree such as business, industry, medicine and so on. Common was categorized based on hour interval
pickup Date Time
datasets, tools, and problems of decision tree were introduced. 0:3 = a; 4:7=b; 8:11=c; 12:15=d; 16:19=e;
20:23=f.
The final observation of the survey was the dependency of
The date and time when the meter were disengaged,
splitting formula and dataset feature with the performance of it was categorized based on hour interval
the algorithm. Dropoff Date Time
0:3 = a; 4:7=b; 8:11=c; 12:15=d; 16:19=e;
In [15], H. Sun, et. al. described how taxi data was 20:23=f.
collected through sensors and GPS. They analyzed taxi data to The number of passengers in the vehicle.
Passenger Count
The driver enters this value.
extract and filter data to get a valuable information and results.
The elapsed trip distance in miles reported by the
The results from analysis helped them propose a new Trip Distance
taximeter.
application that adds new benefits to the taxi passengers and
drivers. They described data attributes and how they used big- PULocation ID TLC Taxi Zone in which the taximeter was engaged
data tools to extract useful information, so they can notice DOLocation ID
TLC Taxi Zone in which the taximeter was
relations between attributes. The analysis steps were described disengaged
briefly to produce analysis results and patterns that was helpful The final rate code in effect at the end of the trip.
to their mobile service. 1= Standard rate
2=JFK
In [16], X. Meng, et. al. discussed MLlib (machine learning Rate Code ID 3=Newark
4=Nassau or Westchester
library) and the need of this library to benefit from the great
5=Negotiated fare
wealth of data nowadays. They described how spark is efficient 6=Group ride
with machine learning algorithms as it is iterative in nature. This flag indicates whether the trip record was held
They also discussed other advantages of integrating MLlib in vehicle
with Spark. They presented the history of spark and MLlib memory before it is sent to the vendor, aka “store
development. They discussed briefly core features, Store and Fwd. Flag and forward,”
performance, Scalability, and continuous improvements of because the vehicle did not have a connection to the
server.
MLlib library. Y= store and forward trip
240 | P a g e
www.ijacsa.thesai.org(IJACSA) International Journal of Advanced Computer Science and Applications,
Vol. 13, No. 3, 2022
N= not a store and forward trip
A numeric code signifying how the passenger paid
for the trip.
1= Credit card
2= Cash
Payment Type
3= No charge
4= Dispute
5= Unknown
6= Voided trip
Fare Amount The time-and-distance fare calculated by the meter.
Miscellaneous extras and surcharges. Currently, this
Extra only includes the $0.50 and $1 rush hour and
overnight charges.
$0.50 MTA tax that is automatically triggered based
MTA Tax
on the metered rate in use
$0.30 improvement surcharge assessed trips at the
Improvement
flag drop. The improvement surcharge began being
Surcharge
levied in 2015
Tip amount – This field is automatically populated
for credit card tips. Cash tips are not included, this
Tip Amount
column was categorized:
0.0 = no tips; 1.0 = tips
Fig. 3. The Framework of Applying Decision Tree Algorithm on Taxi Data.
Tolls Amount Total amount of all tolls paid in trip.
Total Amount
The total amount charged to passengers (Does not VI. CLASSIFICATION ON SPARK
include cash tips).
In [19] K. Zhao, et. al. they analyzed Uber and yellow taxi
In Fig. 2, a 2D correlation matrix was presented to declare samples in NYC using three predictors: Neural Network,
the relations between the data variables. Markov predictor, and Lempel-Ziv-Welch predictors. They
calculated accuracy based on different features; Neural
Network was the only machine learning based method used in
this comparison. Until now, there are not enough research
papers applied in this dataset. Although Classification achieved
good accuracy when applied in different applications like
healthcare and business [20] [21] [22], and also decision tree
was used in different applications and achieved high accuracy
[5] [23], decision tree classification was not applied on taxi
dataset yet. Based on those previous researches, decision tree
classification was used with Apache Spark tool to calculate the
accuracy of prediction. This research used Java language to
apply classification algorithm on Apache Spark. This research
used Spark version 2.2.1. When applying classification
algorithm on taxi dataset, some issues appeared; some are
related to the data as it needs some preparation before
executing the algorithm and the others are related to the
algorithm. After data preparation, the following steps were
Fig. 2. Covariance Heatmap.
taken to apply the classification algorithm to NYC taxi dataset:
V. DATA PREPARATION 1) Load the data stored in JSON format.
In the dataset, first, the total amount column was removed 2) Use “String Indexer Model” to index labels and add
because this column has a high correlation with other columns. metadata to the label column.
Second, The Improvement surcharge column were removed 3) Identify and index categorical feature.
because it has a constant value. Third, pickup-Date-Time and 4) Split the data into training and test sets of data.
drop-off-Date-Time is timestamp column with thousands of 5) Set Decision tree model.
unique instances, so dividing it into categories was the best
6) Convert Indexed Labels to original labels.
solution for this research and each category has a range of
hours. Fig. 3 introduces the framework of applying decision 7) Use Pipeline to chain indexer and tree.
tree algorithm on taxi dataset. 8) Start training model and make prediction.
9) Compute test errors and accuracy.
241 | P a g e
www.ijacsa.thesai.org(IJACSA) International Journal of Advanced Computer Science and Applications,
Vol. 13, No. 3, 2022
VII. RESULTS testing set. In the first case, 10% of data was held for testing. In
This model was executed in 5 minutes and 7.823 seconds. the Second case, 20% of data was held for testing and so on.
The algorithm was applied on 8GB Ram and 2 GHz processor The decision tree is a gradual algorithm which performs a
core i7. The resulted accuracy of this model is 96.5%. recursive partitioning for the feature. Each partition is selected
This research will use another evaluation metrics to gradually by selecting the best split from several possible splits
evaluate this algorithm. There are four main categories that are to maximize the information gain of a tree node. The node
used to calculate these metrics. In a supervised classification impurity is a measure of dividing the training data of the labels
problem, there exists a true output and a predicted or model at the node into relatively homogenous subsets. There are two
generated output. Therefore, the result of each data point will impurity measures for classification: Gini impurity and
be assigned to one of the following categories: Entropy. Next Graphs compares evaluation metrics in terms of
different node impurity. The node impurity measures the labels
True Positive (TP): label is positive, and prediction is homogeneity at the node with two main impurity measures for
positive. classification. Table III illustrates the Gini impurity and
Entropy formulas.
True Negative (TN): label is negative, and prediction is
negative. This research will use splitting criteria (0.8, 0.2) 80% for
the training set and 20% held for the testing set as it gets the
False Positive (FP): label is negative, but prediction is best results compared to other splitting criteria in Table II.
positive. Table IV compare time and number of evaluation metrics when
False negative (FN): label is positive, but prediction is using different impurity measures. Fig. 4, Visualize the
negative. difference between accuracy of Gini impurity and accuracy of
Entropy, Entropy achieves the best Accuracy. Fig. 5, Visualize
These four categories are the basics for most classification the difference between precision of Gini impurity and precision
evaluation metrics. Metrics like precision and recall consider of Entropy, Gini impurity achieves highest precision with a
the type of error, while F-measure captures the balance slight difference of 0.03. Fig. 6, Visualize the difference
between precision and recall and combine them to calculate F- between recall of Gini impurity and recall of Entropy, Entropy
measure. Precision (Positive Predictive Value) measures how achieves the highest recall. Fig. 7, Visualize the difference
many selected items from the dataset are relevant, while recall between f-measure of Gini impurity and f-measure of Entropy,
(True Positive Rate) measure how many relevant items are Entropy achieves the highest f-measure.
selected. For Example, if dataset contains 100 taxi trips
containing 75 trips that were paid by credit cards and 25 trips TABLE II. EVALUATION METRICS FOR DIFFERENT SPLITTING CRITERIA
were paid in cash. And let’s suppose an algorithm for detecting
Splitting Splitting Splitting
credit card payment type identifies 60 trips paid with credit criteria criteria criteria
card, 55 were actually paid with a credit card (true positive) [0.9,0.1] [0.8,0.2] [0.7,0.3]
while the rest was paid in cash (false positive). Using the Accuracy 96.5% 96.6% 96.6%
following formula, precision could be calculated as (PPV = Test error 3.5% 3.4% 3.4%
55/60 = 0.92) and recall (TPR = 60/75 = 0.8). High precision Weighted precision 96.47% 96.57% 96.52%
means that the algorithm returned relevant results more than Weighted recall 96.53% 96.6% 96.56%
irrelevant ones (from 60 trips the returned 55 that are really
Weighted F-measure 96.3% 96.4% 96.3%
paid with credit card). High recall means that the algorithm
returns most of the relevant results (there were 75 trips paid
TABLE III. NODE IMPURITY FORMULAS
with a credit card in the dataset, but the algorithm identified
only 55 trips). Impurity Formula Description
(1) Gini impurity ∑ ( )
is the frequency of label
at a node and is the number
(2) of unique labels.
Entropy ∑ ( )
(3)
In binary classification, there are only two possible class TABLE IV. EVALUATION METRICS FOR NODE IMPURITY
labels. However, in Multiclass classification there are many Gini impurity Entropy
class labels as in this research dataset, payment type are
Time 5:45s 5:58s
classified from 1 to 6 digits having 6 possible classes. Precision
and recall were calculated for each class label then weighted Accuracy 96.53% 96.6%
precision, recall, and F-measure were calculated. The Test error 3.5% 3.4%
following table compares accuracy, test error, weighted Weighted precision 96.55% 96.52%
precision, weighted recall, and weighted F-measure when Weighted recall 96.52% 96.57%
changing the splitting criteria of the data into training and Weighted F-measure 96.29% 96.34%
242 | P a g e
www.ijacsa.thesai.org(IJACSA) International Journal of Advanced Computer Science and Applications,
Vol. 13, No. 3, 2022
payment type with varying hyperparameters. The dataset
Accuracy contains detailed taxi trips, and each trip record describes the
vendor of the data record, passenger count, pickup and drop-off
96.65% 96.60% location and timestamp and detailed receipt. Accuracy,
96.60% precision, recall and f-measure were calculated with different
96.53% splitting criteria and different node impurity. The experiment
96.55%
96.50% shows a promising result as the accuracy and other evaluation
96.45% metrics is higher than 96%. For future work, the Decision tree
Gini impurity Entropy
classification model can be applied to the same dataset to
predict passenger count, rush hour to predict extra charges, and
Accuracy high demand in a specific time zone. Also, this model can be
applied to car services in Egypt like Uber and Careem. An
application of Grid search cross validation can be applied too
Fig. 4. Accuracy for Node Impurity.
to get the best hyperparameters for this dataset.
REFERENCES
Weighted precision [1] An introduction to big data", Opensource.com, 2018. [Online].
Available: https://opensource.com/resources/big-data. [Accessed: 13-
96.56% 96.55% Sep- 2018].
[2] Che, D., Safran, M. and Peng, Z. (2013). From Big Data to Big Data
96.54% Mining: Challenges, Issues, and Opportunities. Database Systems for
96.52% Advanced Applications. 7827, 1-15.
96.52% [3] L. Joseji, "6 Sparkling Features of Apache Spark! - DZone Big Data",
dzone.com, 2014. [Online]. Available: https://dzone.com/articles/6-
96.50% sparkling-features-apache. [Accessed: 24- Sep- 2018].
Gini Impurity Entropy [4] H. Karau and R. Warren, High performance Spark. O’Reilly Media,
2017, pp. 219 - 251.
Weighted precision [5] H. Sharma and S. Kumar, "A Survey on Decision Tree Algorithms of
Classification in Data Mining", International Journal of Science and
Research (IJSR), vol. 5, no. 4, pp. 2094-2097, 2016.
Fig. 5. Precision for Node Impurity.
[6] B. Charbuty and A. Abdulazeez, "Classification Based on Decision Tree
Algorithm for Machine Learning", Journal of Applied Science and
Technology Trends, vol. 2, no. 01, pp. 20-28, 2021.
Weighted Recall [7] F. Wang, "Analysis of NYC Yellow Taxi data", NYC Data Science
Academy Blog, 2016. [Online]. Available:
96.60% 96.57% https://nycdatascience.com/blog/student-works/analysis-of-nyc-yellow-
96.52% taxi-data/. [Accessed: 11- Nov- 2018].
96.55%
[8] M. Yazici, C. Kamga and A. Singhal, "A Big Data Driven Model for
96.50% Taxi Drivers’ Airport Pick-up Decisions in New York City", 2013 IEEE
International Conference on Big Data, pp. 37-44, 2013.
96.45%
[9] A. Kushwaha, A. Kar and Y. Dwivedi, "Applications of big data in
Gini Impurity Entropy
emerging management disciplines: A literature review using text
mining", International Journal of Information Management Data
Weighted Recall Insights, vol. 1, no. 2, p. 100017, 2021.
[10] J. Wang, C. Xu, J. Zhang and R. Zhong, "Big data analytics for
Fig. 6. Recall for Node Impurity. intelligent manufacturing systems: A review", Journal of Manufacturing
Systems, 2021.
[11] S. Kumar and M. Singh, "Big data analytics for healthcare industry:
Weighted F-measure impact, applications, and tools", Big Data Mining and Analytics, vol. 2,
no. 1, pp. 48-57, 2019.
96.34% [12] M. Juez-Gil, Á. Arnaiz-González, J. Rodríguez, C. López-Nozal and C.
96.35%
García-Osorio, "Approx-SMOTE: Fast SMOTE for Big Data on Apache
96.29% Spark", Neurocomputing, vol. 464, pp. 432-437, 2021.
96.30% [13] B. Roy and D. Rout, "Predicting Taxi Travel Time Using Machine
Learning Techniques Considering Weekend and Holidays", Proceedings
96.25% of the 13th International Conference on Soft Computing and Pattern
Gini Impurity Entropy Recognition (SoCPaR 2021), pp. 258-267, 2022.
[14] S. Singh and M. Giri, "Comparative Study Id3, Cart and C4.5 Decision
Weighted F-measure Tree Algorithm: A Survey", International Journal of Advanced
Information Science and Technology (IJAIST), vol. 3, no. 7, pp. 47-52,
2014.
Fig. 7. F-measure for Node Impurity. [15] H. Sun and S. McIntosh, "Big Data Mobile Services for New York City
Taxi Riders and Drivers", IEEE International Conference on Mobile
VIII. CONCLUSION Services, pp. 57-64, 2016.
This research applied a decision tree classification model [16] X. Meng, J. Bradley, B. Yavuz, E. Sparks, S. Venkataraman, D. Liu, J.
Freeman, D. Tsai, M. Amde, S. Owen, D. Xin, R. Xin, M. J. Franklin, R.
on NYC Taxi and Limousine Commission dataset to predict
243 | P a g e
www.ijacsa.thesai.org(IJACSA) International Journal of Advanced Computer Science and Applications,
Vol. 13, No. 3, 2022
Zadeh, M. Zaharia and A. Talwalkar, "MLlib: Machine Learning in [20] V. Chaurasia and S. Pal, "A Novel Approach for Breast Cancer
Apache Spark", Journal of Machine Learning Research, vol. 17, pp. Detection using Data Mining Techniques", International Journal of
1235-1241, 2016. Innovative Research in Computer and Communication Engineering, vol.
[17] S. Salloum, R. Dautov, X. Chen, P. Peng and J. Huang, "Big data 2, no. 1, pp. 2456 - 2465, 2014.
analytics on Apache Spark", International Journal of Data Science and [21] A. Linden and P. Yarnold, "Using data mining techniques to
Analytics, vol. 1, no. 3-4, pp. 145-164, 2016. characterize participation in observational studies", Journal of
[18] [Dataset] "NYC Taxi & Limousine Commission - Trip Record Data", Evaluation in Clinical Practice, vol. 22, no. 6, pp. 839-847, 2016.
Nyc.gov, 2018. [Online]. Available: http://www.nyc.gov/html/tlc/html/ [22] T. Bahari and M. Elayidom, "An Efficient CRM-Data Mining
about/trip_record_data.shtml. [Accessed: 22- Sep- 2018]. Framework for the Prediction of Customer Behaviour", International
[19] K. Zhao, D. Khryashchev, J. Freire, C. Silva and H. Vo, "Predicting Conference on Information and Communication Technologies, vol. 46,
Taxi Demand at High Spatial Resolution: Approaching the Limit of pp. 725-731, 2015.
Predictability", IEEE International Conference on Big Data (Big Data), [23] Y. SONG and Y. LU, "Decision tree methods: applications for
pp. 833-842, 2016. classification and prediction", Shanghai Arch Psychiatry., pp. 130-135,
2015.
244 | P a g e
www.ijacsa.thesai.orgYou can also read