Investigating microplastics and potentially toxic elements contamination in canned Tuna, Salmon, and Sardine fishes from Taif markets, KSA
←
→
Page content transcription
If your browser does not render page correctly, please read the page content below
Open Life Sciences 2021; 16: 827–837
Research Article
Nahed Ahmed Hussien*, Amaal Mohammadein, Ehab M. Tantawy, Yassir Khattab,
Jamila S. Al Malki
Investigating microplastics and potentially toxic
elements contamination in canned Tuna, Salmon,
and Sardine fishes from Taif markets, KSA
https://doi.org/10.1515/biol-2021-0086 Keywords: microplastics, toxic elements, canned fish,
received April 17, 2021; accepted August 05, 2021 Tuna, Salmon, Sardine, Taif, KSA
Abstract: Microplastics (MPs) have been documented
in different foodstuffs and beverages, that could affect
human health due to their ingestion. Furthermore, seafood
contamination with MPs puts pillars of food availability 1 Introduction
and utilization at risk. The present study investigates
MPs and toxic elements pollution in commercially Fish represent a good source of unsaturated fatty acids
canned fishes from Taif governorate markets. Seven dif- (including Omega-3), fat-soluble vitamins, proteins (including
ferent canned fishes’ brands were used in the present essential amino acids), and different elements (calcium,
study from different manufacturer countries and pur- fluorine, iodine, and phosphorus) [1]. Therefore, fish and
chased from Taif markets. Tissue samples were digested other seafood are considered as healthy and balanced
by 10% of KOH; then, dry filters were analyzed by Fourier- meals for humans [2]. Canned fish is widely consumed
transform infrared spectroscopy to detect MPs. Filtrates in various countries of different continents, including the
were used to detect any potentially toxic elements by Kingdom of Saudi Arabia (KSA), Libya, Turkey, Iran, USA,
inductively coupled plasma. Different MPs were detected and Portugal [3]. It was reported that Tuna, Salmon, and
in edible tissue, such as canned Tuna contaminated with Sardine are the most consumed canned fishes in KSA [4].
nylon, 1,2-polybutadiene, and ethylene vinyl alcohol. Fishes are constantly exposed to different pollutants
Sardines contain ethylene vinyl alcohol and poly(vinyl in contaminated waters. However, fish represents the
stearate), but Salmon does not have any MPs. Different final link in the aquatic food chain; therefore, detecting
elements were present in the selected samples in the any contaminant in fish tissue must be related to marine
decreasing order of Al > Se > Zn and traces of As and environmental pollution [5].
Sb. Canned fishes were contaminated with MPs and poten- Plastics have been found everywhere in terrestrial
tially toxic elements. This contamination could be a warning and aquatic ecosystems, that has increased rapidly world-
of the potential health risks with the long-term exposure. wide. It was assessed that about 4.8–12.7 million metric
Therefore, it is recommended to include micro-, meso-, tons of plastics entered the oceans by 2010 [6]. Large dis-
and even nanoplastics in the guidelines of testing food safety posable plastics in the aquatic ecosystem were subjected
management systems. to continuous degradation (mechanical, chemical, and
photolytic), leading to smaller particles such as mesoplas-
tics, microplastics (MPs), and nanoplastics [7–10].
Recently, different studies have reported the presence
* Corresponding author: Nahed Ahmed Hussien, Department of of micro- (0.001–1 mm) and mesoplastics (1–10 mm) in the
Biology, College of Science, Taif University, P.O. Box 11099, alimentary canal of a few fish species [11–13]. Ingested
Taif 21944, Saudi Arabia, e-mail: nahed199@gmail.com micro/mesoplastics could be mistaken for food or could
Amaal Mohammadein, Yassir Khattab, Jamila S. Al Malki: be found in other pelagic and benthic marine biotas as a
Department of Biology, College of Science, Taif University, P.O. Box
meal for other fishes [14]. However, few studies report
11099, Taif 21944, Saudi Arabia
Ehab M. Tantawy: Research and Development Sector, EGYVAC,
MPs’ ability to translocate from the digestive canal to
VACSERA, Giza 12311, Egypt other organs [15], leading to fish toxicity [8,16,17]. In our
ORCID: Nahed Ahmed Hussien 0000-0001-7019-9682 peer knowledge, rare research studies are focused on
Open Access. © 2021 Nahed Ahmed Hussien et al., published by De Gruyter. This work is licensed under the Creative Commons Attribution
4.0 International License.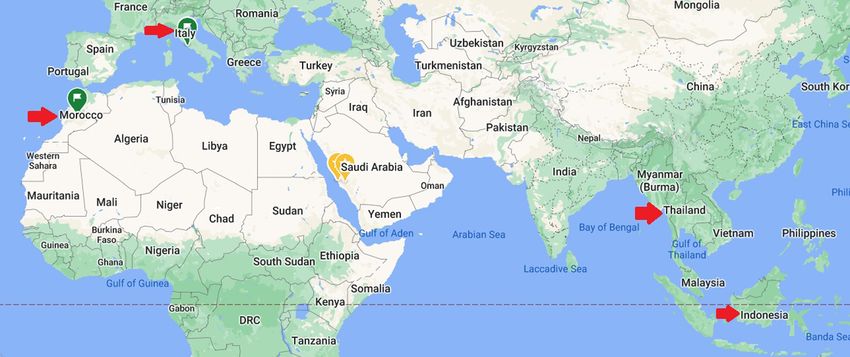
828 Nahed Ahmed Hussien et al.
micro/mesoplastic estimation in edible fish tissues [18]. 2 Materials and methods
Their potential risks on biotic fauna or humans have not
been well studied until now. However, MPs accumulation
2.1 Sample collection
in aquatic biota, especially edible tissues, may put the
health of seafood consumers at risk due to hazardous com-
Seven different canned brands (triplicates) were used in
pounds [9,19]. During the last two decades, MPs have been
this study: Canned Tuna, Salmon, and Sardine fishes were
considered an ecotoxicological risk due to their physical
purchased from Taif governorate, KSA markets. They were
damage, oxidative stress, genotoxicity, growth inhibition,
manufactured in different countries: Tuna from Indonesia,
metabolism disorders, and liver metastasis [20–23].
Italy, and Thailand; Salmon from Indonesia and Thailand;
Canned fish as a processed seafood product is directly
Sardine from Indonesia and Morocco. Figure 1 shows the
consumed without any further cleaning process, and there
collected canned fish and Figure 2 refers to the countries of
is no information on micro/mesoplastic loads found in this
their manufacturer (map according to google map 2020). All
product. Therefore, it is essential to evaluate the presence
data on the cans were recorded to know all the constituents
of MPs in those products from a human health perspective.
found in them other than fish tissue (Table 1). It shows dif-
However, investigating plastic particulates in foodstuffs
ferent concentrations of protein (g), total, saturated, and trans
is not included in any end product’s quality and safety
fats (g), sodium (mg), total carbohydrates (g), total sugar (g),
assessment as per the International Standardization
cholesterol (mg), dietary fibers (g), and any other constituents
Organization rules (ISO) [24].
(Nutrition facts/100 g) present in the cans. In addition, it refers
MPs can be chemically inert, small-sized, and with
to total weight (g), fish species, and manufacturer country.
large surface areas facilitating the adsorption of toxic
materials [25,26], although they could enhance the bio-
accumulation of other pollutants present in water, includ-
ing organic [27] and inorganic (potentially toxic elements) 2.2 Minimization of contamination with MPs
pollutants [28–30].
The present study aims to estimate MPs and element The working area was cleaned with ethanol before starting
contamination in commercially canned fishes (Tuna, Salmon, any treatment. Any plastic tools were prohibited from
and Sardine), frequently consumed in KSA. Fourier-transform being used in this work. All glass tools were washed
infrared spectroscopy (FTIR) and inductively Coupled with autoclaved deionized water and then with ethanol
Plasma-Mass Spectrometry (ICP-MS) were used to detect before their use in this experiment. Any prepared solutions
MPs and metallic elements contamination, respectively. and incubated samples were kept in glasses and capped
Figure 1: Different canned fishes that were used in the present study.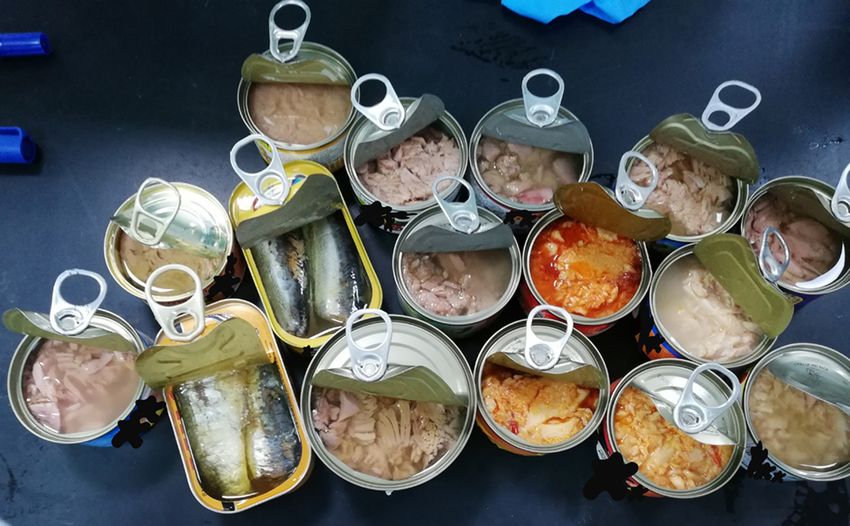
Investigating MPs and toxic elements contamination in canned fishes 829
Figure 2: Map refers to the countries of selected canned fishes (Red arrows), according to google map 2020.
with aluminum foil to prevent plastic contamination. Gloves 2.5 FTIR polymer identification
and cotton lab coats were worn during the experiment.
FTIR was used to characterize the collected particles.
FTIR was extensively used for different particle identifi-
2.3 Sample preparation and MPs extraction
cation, although it represents a fingerprinting technique.
Organic and inorganic particles could be easily differen-
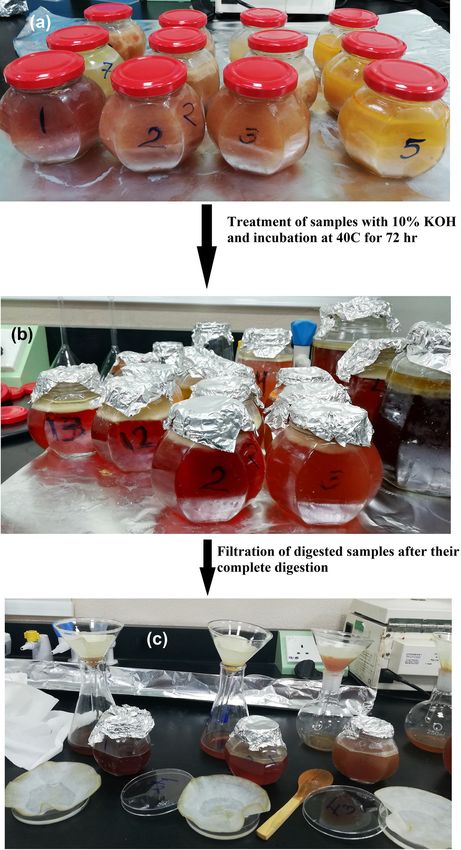
Figure 3 shows treatment steps for MPs’ extraction in brief.
tiated by yielding a unique spectrum by FTIR [32]. The
About 40 g of canned fish (a separate can per brand) was
FTIR spectra of samples were determined by an Agilent
used in treatment according to Rochman et al. [31] method
FTIR spectrometer at wavelength range 4,000–450 cm−1.
with few modifications. Salt solution or oil found in the can
OriginLab 2021 software was used to plot FTIR (absor-
with fish tissues were not discarded, and all were weighed
bance to wavelength, cm−1). The spectra were aligned
and used together in evaluation. Samples were incubated in
with the help of siMPle 2020 software (systematic identi-
10% of KOH (volume 3 times/weight) at 40°C for 72 h until
fication of MPs in the environment, https://simple-plastics.
complete tissue digestion. After complete digestion, NaI
eu/) against the reference spectra in its database to detect
(4.4 M) was added to aid in MPs’ floating for its filtration.
the type of particle.
At the end of incubation time, the color of KOH turned from
colorless to transparent red in all the samples except Sar-
dine samples which appeared light brown in color, with
successful digestion of the whole sample with no organic
2.6 Potentially toxic elements
residues. Each sample was filtered separately through 8 μm
cellulose filters (Whatman® Grade 2). Then, filters were determination
rinsed with autoclaved ultrapure water in Petri dishes, dried
overnight at 60°C, and finally re-weighed to record MPs Filtrates of all samples were used to detect different ele-
recovery weight per sample. Samples of the same brand ments that could be accompanied by MPs contamina-
were pooled and collected for further evaluation. tion. Inductively Coupled Plasma-Mass Spectrometry
(ICP-MS) was used for quantitative analysis of 20 dif-
ferent elements (Silver (Ag), Aluminum (Al), Arsenic
2.4 Microplastic visual identification (As), Barium (Ba), Beryllium (Be), Cadmium (Cd),
Chromium (Cr), Cobalt (Co), Copper (Cu), Iron (Fe),
Collected dried filters of each sample were examined Lead (Pb), Manganese (Mn), Molybdenum (Mo), Nickel (Ni),
under a dissected microscope to help visualize MPs for Antimony (Sb), Selenium (Se), Strontium (Sr), Titanium
further analysis by FTIR. (Ti), Vanadium (V), and Zinc (Zn)) present in the samples.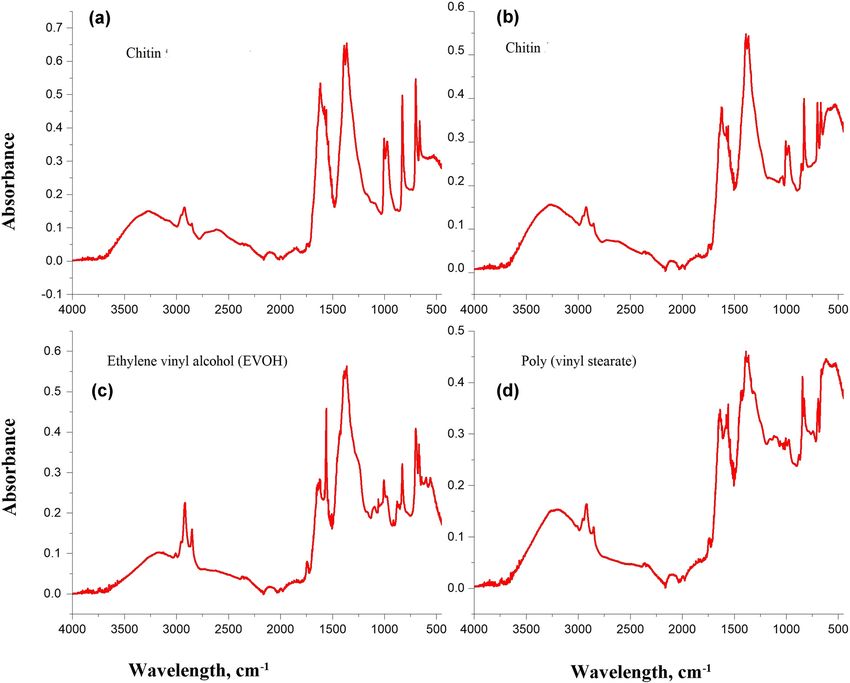
830 Nahed Ahmed Hussien et al.
2.7 Statistical analysis
Soya oil, salt, omega
Water/vegetable oil,
Vegetable oil, chili,
salt, sugar, natural
Other constituents
Vegetable oil, salt
Omega 3 (g) = 1.1
Data were expressed as the mean value ± standard devia-
Vegetable oil,
Olive oil, salt
salt solution
tion (M ± SD). Statistical analysis was conducted to dif-
3 (g) = 1.1
chili, salt
solution
ferentiate between all the groups and between the same
colors
canned fishes from different manufacturer countries using
One-way ANOVA using GraphPad software (GraphPad,
2017)®. In which, *** indicates P ≤ 0.001, ** indicates
fiber (g)
Dietary
P ≤ 0.01, * indicates P ≤ 0.05 and ns (non-significant)
—
—
—
means P > 0.05.
0
0
0
0
Cholesterol
46–50
47–57
0.035
sugar (g) (mg)
3 Results and discussion
42
—
—
—
Different brands of canned fish from different manufac-
Total
0.5
1.6
turer countries were used to determine any MPs and
—
—
0
0
0
adsorbed elements pollution. Canned Tuna, Salmon, and
carbohydrate (g)
Sardine are the most consumed seafood products found in
KSA markets. All samples were digested entirely in 10%
of KOH at the end of the treatment time and gave clear
Total
color, except for sardine samples because most of the fish
2.2
0.5
—
—
0
0
0
body, including bones and skin, were found inside the
can. It was reported that 10% of KOH is the most efficient,
218–390
156–360
Sodium
high-performing, low-cost digestion solution used in MPs
(mg)
448
240
315
—
—
extraction. The whole organic tissue was fully digested at
40°C in 48–72 h without negatively affecting the integrity
fat (g)
0–0.1
Trans
of the plastic polymers. In addition, any other fragments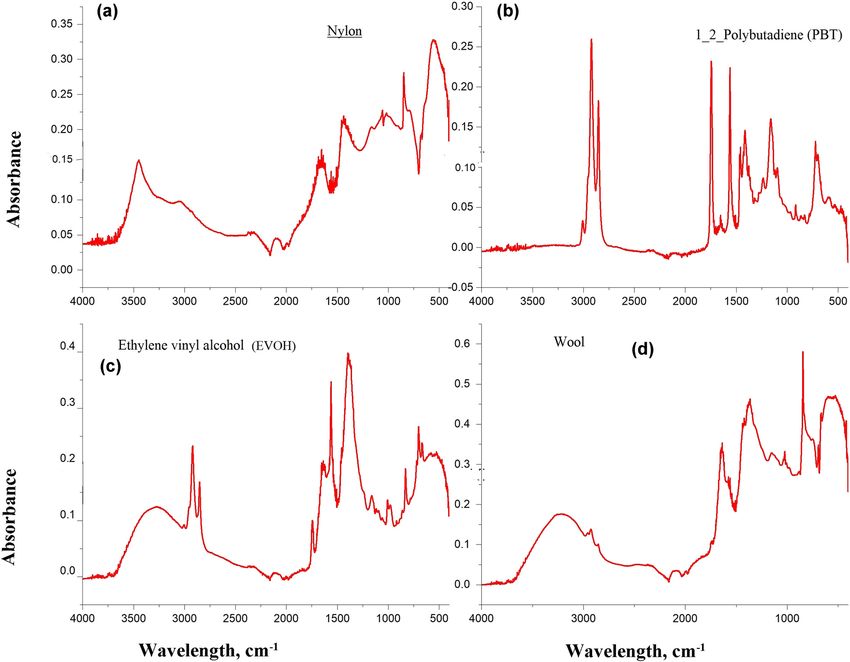
Investigating MPs and toxic elements contamination in canned fishes 831 Figure 3: Steps of treatment: (a) treatment of fishes’ tissues with 10% of KOH and incubation for 72 h at 40°C, (b) the color of KOH becomes clear indicating complete digestion, and (c) filtration of the digested samples and filter papers soaked in Petri dishes. software to report their type. Based on the report, most of manufacturer countries appeared to be synthetic poly- the particles chosen from Tuna tissues from different mers such as nylon, 1,2-polybutadiene (PBT), ethylene
832 Nahed Ahmed Hussien et al. vinyl alcohol (EVOH, thermoplastics), and other natural could concentrate large amounts of various pollutants polymers such as wool (Figure 4). All the selected parti- [36], including MPs and heavy metals. In addition, Sar- cles from sardine filters are EVOH and poly(vinyl stea- dine fishes live in coastal waters [37] where different rate) (Figure 5). However, none of the particles chosen plastic particles (micro-, meso-, and macroplastics) are from Salmon canned tissues from different manufacturer commonly dumped and can accumulate in their tissue countries are MPs. As the spectra have shown, particles [38,39]. In addition, Karami et al. [24] reported MPs, extracted from Salmon tissues consisted of chitin, as especially PP and PET, isolated from the canned Sardines referred to in Figure 5. Few studies were found that and Sprats. They concluded that this contamination could reported MP particles in edible tissues of canned fishes. be due to translocation of MPs into the edible tissues, Canned Tuna and sardine tissues have MPs of different improper gutting, or contamination from the canneries. types, but Salmon tissue does not have any. The present In addition, contact materials during the cleaning and result was consistent with Akhbarizadeh et al. [35]. They canning process and food additives could be possible have recorded MP particles and fibers in canned tuna and sources of MPs contamination [35]. mackerel fishes using light, fluorescence, micro-Raman The present results were in agreement with Akhbarizadeh microscopy, and scanning electron microscopy coupled et al. [18], in which they reported the MPs bioaccumulation with a dispersive energy X-ray. This could be due to dif- in gills and edible tissues of five different marine species: ferent feeding habitats and the distribution of different prawns (Penaeus semisulcatus), crabs (Portunus armatus), species. It was reported that Tuna is a migratory fish and and fishes (Epinephelus coioides, Platycephalus indicus, Figure 4: FTIR spectra of Nylon (a), 1,2-polybutadiene (PBT) (b), ethylene vinyl alcohol (EVOH) (c), and wool (d) that are present in samples.
Investigating MPs and toxic elements contamination in canned fishes 833
Figure 5: FTIR spectra of chitin protein (a and b), ethylene vinyl alcohol (EVOH) (c), and poly(vinyl stearate) (d) that are present in samples.
and Liza klunzingeri). They have recorded different MP easily adsorbed on their surfaces, including heavy metals,
concentrations within different species, and it is found organochlorine pesticides, polychlorinated biphenyls, poly-
highly concentrated in gills more than the edible muscles. cyclic aromatic hydrocarbons, and pharmaceuticals [30,49–51].
They concluded that motile, benthic, and deposit feeder The filtrate was used to detect any trace toxic elements
species are more susceptible to deposited plastic particles found in the canned fishes accompanied by MPs contam-
on seabed sediments [40,41]. In addition, the MPs inges- ination. There are about fourteen different elements that
tion rate by aquatic biota depends on the MPs’ size, color, are absent in the present study: Ba, Be, Cd, Cr, Co, Cu,
and organism’s size, vertical distribution, and feeding Pb, Mn, Mo, Ni, Ag, Sr, Ti, and V. The highest Al concen-
behavior [12,42–45]. Therefore, different hypotheses were tration is significantly present in the Sardine Morocco
expected regarding the passage of MPs to edible muscles (18.5701 ± 0.05) sample in comparison to other samples. Within
that could transfer through the skin, gill, eye, blood circu- the same fish species, Tuna Indonesia (5.0092 ± 0.001) signifi-
lation, and gut epithelium [9,21,47]. In addition, Collard cantly represents the highest Al concentration than other
et al. [46] suggested the passage of agglomerated MPs Tuna samples (other manufacturer countries). There is
through microfold cells of the intestinal barrier and larger a non-significant difference between Salmon Indonesia
particles (110 μm) pass between cells in a paracellular and Thailand of Al concentration. However, Salmon Thai-
manner [48]. land significantly shows the highest Se concentration
Due to MPs’ small size and large surface area, dif- (3.1736 ± 0.004) in comparison to other groups’ samples.
ferent chemical pollutants in trace concentrations are Within the same fish species, Tuna Indonesia (1.6269 ± 0.002)834 Nahed Ahmed Hussien et al.
Sardine Morocco
significantly represents the highest Se concentration than
2.6943 ± 0.002
18.5701 ± 0.05
0.1277 ± 0.00
other Tuna groups. There is a non-significant difference
between Se concentration for Sardine samples from
Indonesia (1.8025 ± 0.001) and Morocco (2.6943 ± 0.002)
0.00
0.00
0.00
(Table 2, Figure 6a and b).
The Tuna Italy group shows the highest significant
Sardine Indonesia
concentration of Zn (1.0733 ± 0.003) in comparison to the
1.8025 ± 0.001
0.4511 ± 0.001
0.8268 ± 0.00
other groups. Sardines from Indonesia show a low con-
centration of Zn (0.4511 ± 0.001), but the rest of the
groups do not contain Zn (Table 2, Figure 6c). Tuna Italy
0.00
0.00
0.00
is the only group that has a low concentration of As
(0.4087 ± 0.001). In addition, Sb was found in three
Salmon Thailand
2.7924 ± 0.001
3.1736 ± 0.004
1.7192 ± 0.001
groups only: Tuna Italy (1.8476 ± 0.001), Salmon Thai-
land (1.7192 ± 0.001), and Sardine Morocco (0.1277 ±
0.00) (Table 2). It was known that metals are classified
0.00
0.00
0.00
as essential (Cu, Zn, and Se), probably essential (Ni, V,
and Co), and toxic (Al, As, Cd, Pd, and Hg) [52]. Although
Salmon Indonesia
low concentrations of those elements are essential in sea-
0.8572 ± 0.002
2.8861 ± 0.00
food, high concentrations could be toxic [53,54]. It was
reported that the metal concentrations in canned fish
tissues were in the decreasing order of Al > Se > Zn,
0.00
0.00
0.00
0.00
and only traces of As and Sb were detected in the selected
0.2768 ± 0.001
sample groups from the Taif governorate market.
Tuna Thailand
2.9435 ± 0.00
Different studies reported the presence of heavy
metals in canned fishes, such as Hg, Zn, Cd, and others
Table 2: Concentration of different elements present in filtrate of different canned fishes in ppm
0.00
0.00
0.00
0.00
that could be within or out of the guidelines of the
Food and Agriculture Organization (FAO)/World Health
Organization (WHO). Ashraf et al. [4] reported different
0.4087 ± 0.001
1.0733 ± 0.003
1.8476 ± 0.001
4.0514 ± 0.001
0.4118 ± 0.001
heavy metals in canned Salmon, Sardine, and Tuna fish
Tuna Italy
muscles purchased in KSA (Zn = 3.80–23.9046 ppm, Pb =
0.00
0.03–1.97 ppm, and Cd = 0.01–0.69 ppm). According to
the FAO, the present results estimate Zn concentration
1.6269 ± 0.002
Tuna Indonesia
5.0092 ± 0.001
lower than the maximum permitted level of Zn in fish,
0.7155 ± 0.001
which is 40–50 μg/g [55]. In agreement with the present
results, Al Ghoul et al. [56] detected Zn, Al, and Sn in
0.00
0.00
0.00
canned tuna fish commercialized in Lebanon within a
limited range. In the present study, Al concentration in
Ba, Be, Cd, Cr, Co, Cu, Pb, Mn, Mo, Ni, Ag, Sr, Ti, V
all the samples from different manufacturer countries
(ranges from 0.8268 ± 0.00 to 5.0092 ± 0.001 ppm),
except Sardine Morocco, are within the permissible limits
for Al set by FAO/WHO as 60 mg/day. In agreement with
previous studies, they record Al in canned tuna samples
from Lebanon (Al = 4.756 μg/g), Indian (Al = 3.161 μg/g),
and Canadian (1.806 μg/g) markets [5,56]. An increase in
Al concentration in Sardine Morocco might be due to
marine source Al contamination, leaching Al from the
metal can, or from can coating liquid containing Al-based
Element (ppm)
additives [57]. Salmon tissue has the highest essential
Se element, low concentration of Al, a trace of Sb,
the absence of other elements, and the lack of MPs
Sb
Se
Zn
As
contamination.
AlInvestigating MPs and toxic elements contamination in canned fishes 835
Figure 6: Assessment of different elements aluminum (a), selenium (b), and zinc (c) present in the filtrate of different canned fishes in ppm.
In which, *** indicates P ≤ 0.001, ** indicates P ≤ 0.01, ns (non-significant) means P > 0.05 comparing related samples with each other.
Generally, canned Salmon appears to be the safest we suggest the investigation and quantification of MPs to
processed seafood due to the absence of MPs contamina- be included as one of the components of food safety
tion, toxic elements, and is rich in essential Se elements management systems.
and Omega 3. However, microplastics were reported in
canned Tuna, sardine and also as noted before in other Acknowledgments: This work was supported by Taif
foodstuffs, including canned Sprats, salt, and honey University Researchers Supporting Project number (TURSP-
[9,24,58]. The long-term exposure to MPs could be a 2020/299), Taif University, Taif, Saudi Arabia.
warning of the potential health risks. Annually, there is
an increase in the plastic debris entering marine environ- Funding information: The authors state no funding involved.
ments and constantly accumulates in the aquatic biota
and seafood products. The accumulation of plastic parti- Author contributions: All the authors participated in the
cles was accompanied by other potentially toxic elements study design, practical work, writing manuscript, and
such as Al or others. Although, concerning the current approved the final manuscript.
load of MPs in canned Tuna and Sardines that might
increase later, it is recommended to include micro-, Conflict of interest: The authors state no conflict of interest.
meso-, and even nanoplastics in guidelines of testing
food safety management systems. Data availability statement: The datasets generated during
and/or analyzed during the current study are available
from the corresponding author on reasonable request.
4 Conclusion
References
In our peer knowledge, it is the first time to report MPs
contamination in canned Tuna and Sardines from dif- [1] Ismail HM. The role of omega-3 fatty acids in cardiac protec-
tion: an overview. Front Biosci. 2005;10:1079–88.
ferent manufacturers in KSA markets. MPs reported are
[2] Sirot V, Dumas C, Leblanc JC, Margaritis I. Food and nutrient
nylon, PBT, EVOH, and poly(vinyl stearate). In addition,
intakes of French frequent seafood consumers with regard to
different elements were present in the selected samples fish consumption recommendations: results from the CALIPSO
in the decreasing order of Al > Se > Zn and only traces study. Br J Nutr. 2011;105(9):1369–80.
of As and Sb. However, Salmon tissue does not have [3] Hosseini SV, Aflaki F, Sobhanardakani S, Tayebi L, Babakhani
any MPs and contains a low concentration of potentially Lashkan A, Regenstein JM. Analysis of mercury, selenium and
tin concentrations in canned fish marketed in Iran. Environ
toxic elements with higher concentration of essential Se.
Monit Assess. 2013;185(8):6407–12.
Therefore, microplastic pollution in processed seafood [4] Ashraf W, Seddigi Z, Abulkibash A, Khalid M. Levels of selected
products that humans consume could be a potential metals in canned fish consumed in Kingdom of Saudi Arabia.
risk to human health. According to the present results, Environ Monit Assess. 2006;117:271–9.836 Nahed Ahmed Hussien et al.
[5] Mahalakshmi M, Balakrishnan S, Kalyanasundram I, [22] Granby K, Rainieri S, Rasmussen RR, Kotterman MJJ, Sloth JJ,
Muthukumarasamy S. Characteristic levels of heavy metals in Cederberg TL, et al. The influence of microplastics and halo-
canned tuna fish. J Toxic Environ Health Sci. 2012;4:43–5. genated contaminants in feed on toxicokinetics and gene
[6] Jambeck JR, Geyer R, Wilcox C, Siegler TR, Perryman M, expression in European seabass (Dicentrarchus labrax).
Andrady A, et al. Marine pollution. Plastic waste inputs from Environ Res. 2018;164:430–43.
land into the ocean. Science. 2015;347(6223):768–71. [23] Smith LE. Plastic ingestion by Scyliorhinus canicular trawl
[7] Cole M, Galloway TS. Ingestion of nanoplastics and micro- captured in the North Sea. Mar Pollut Bull. 2018;130:6–7.
plastics by Pacific oyster larvae. Environ Sci Technol. [24] Karami A, Golieskardi A, Choo CK, Larat V, Karbalaei S,
2015;49:14625–32. Salamatinia B. Microplastic and mesoplastic contamination
[8] Karami A, Romano N, Galloway T, Hamzah H. Virgin micro- in canned sardines and sprats. Sci Total Environ. 2018;612:1380–6.
plastics cause toxicity and modulate the impacts of phenan- [25] Teuten EL, Saquing JM, Knappe DRU, Barlaz MA, Jonsson S,
threne on biomarker responses in African catfish (Clarias Björn A, et al. Transport and release of chemicals from plastics
gariepinus). Environ Res. 2016;151:58–70. to the environment and to wildlife. Philos Trans R Soc B Biol
[9] Karami A, Golieskardi A, Ho YB, Larat V, Salamatinia B. Sci. 2009;364:2027–45.
Microplastics in eviscerated flesh and excised organs of dried [26] Lithner D, Larsson A, Dave G. Environmental and health hazard
fish. Sci Rep. 2017;7:5473. ranking and assessment of plastic polymers based on che-
[10] Imhof HK, Sigl R, Brauer E, Feyl S, Giesemann P, Klink S, et al. mical composition. Sci Total Environ. 2011;409:3309–24.
Spatial and temporal variation of macro-, meso- and micro- [27] Zhang S, Ding J, Razanajatovo RM, Jiang H, Zou H, Zhu W. Interactive
plastic abundance on a remote coral island of the Maldives, effects of polystyrene microplastics and roxithromycin on bioaccu-
Indian Ocean. Mar Pollut Bull. 2017;116:340–7. mulation and biochemical status in the freshwater fish red tilapia
[11] Tanaka K, Takada H. Microplastic fragments and microbeads in (Oreochromis niloticus). Sci Total Environ. 2019;648:1431–9.
digestive tracts of planktivorous fish from urban coastal [28] Holmes LA, Turner A, Thompson RC. Adsorption of trace metals
waters. Sci Rep. 2016;6:34351. to plastic resin pellets in the marine environment. Environ
[12] Jabeen K, Su L, Li J, Yang D, Tong C, Mu J, et al. Microplastics Pollut. 2012;160:42–8.
and mesoplastics in fish from coastal and fresh waters of [29] Holmes LA, Turner A, Thompson RC. Interactions between trace
China. Environ Pollut. 2017;221:141–9. metals and plastic production pellets under estuarine condi-
[13] Nunes LS, Silva AG, Espínola LA, Blettler MCM, Simões NR. tions. Mar Chem. 2014;167:25–32.
Intake of microplastics by commercial fish: a Bayesian [30] Rochman CM, Hentschel BT, Teh SJ. Long-term sorption of
approach. Environ Monit Assess. 2021;193:402. metals is similar among plastic types: implications for plastic
[14] Lusher AL, Hernandez-Milian G, Berrow S, Rogan E, O’Connor I. debris in aquatic environments. PLoS One. 2014;9:e85433.
Incidence of marine debris in cetaceans stranded and [31] Rochman CM, Tahir A, Williams SL, Baxa DV, Lam R, Miller JT,
bycaught in Ireland: recent findings and a review of historical et al. Anthropogenic debris in seafood: plastic debris and
knowledge. Environ Pollut. 2017;232:467–76. fibers from textiles in fish and bivalves sold for human con-
[15] Lu YF, Zhang Y, Deng YF, Jiang W, Zhao YP, Geng JJ, et al. sumption. Sci Rep. 2015;5:14340.
Uptake and accumulation of polystyrene microplastics in [32] Löder MGJ, Kuczera M, Mintenig S, Lorenz C, Gerdts G. Focal
zebrafish (Danio rerio) and toxic effects in liver. Environ Sci plane array detector-based micro-Fourier-transform infrared
Technol. 2016;50:4054–60. imaging for the analysis of microplastics in environmental
[16] Rochman CM, Hoh E, Kurobe T, Teh SJ. Ingested plastic samples. Environ Chem. 2015;12:563–81.
transfers hazardous chemicals to fish and induces hepatic [33] Eriksen M, Mason S, Wilson S, Box C, Zellers A, Edwards W,
stress. Sci Rep. 2013;3:3263. et al. Microplastic pollution in the surface waters of the
[17] Watts AJ, Urbina MA, Corr S, Lewis C, Galloway TS. Ingestion of Laurentian Great Lakes. Mar Pollut Bull. 2013;77(1–2):177–82.
plastic microfibers by the crab Carcinus maenas and its effect [34] Hidalgo-Ruz V, Gutow L, Thompson RC, Thiel M. Microplastics in the
on food consumption and energy balance. Environ Sci Technol. marine environment: a review of the methods used for identifica-
2015;49:14597–604. tion and quantification. Environ Sci Technol. 2012;46(6):3060–75.
[18] Akhbarizadeh R, Moore F, Keshavarzi B. Investigating micro- [35] Akhbarizadeh R, Dobaradaran S, Nabipour I, Tajbakhsh S,
plastics bioaccumulation and biomagnification in seafood Darabi AH, Spitz J. Abundance, composition, and potential
from the Persian Gulf: a threat to human health? Food Addit intake of microplastics in canned fish. Mar Pollut Bull.
Contam. 2019;36(11):1696–708. 2020;160:111633.
[19] Toussaint B, Raffael B, Angers-Loustau A, Gilliland D, [36] EU. Commission Regulation as regards heavy metals.
Kestens V, Petrillo M, et al. Review of micro- and nanoplastic Amending Regulation 466/2001. No: 78/2005; 2005.
contamination in the food chain. Food Addit Contam Part A. [37] Whitehead PJ. FAO species catalogue. Clupeoid fishes of the
2019;36:639–73. World (suborder Clupeoidei). An annotated and illustrated cata-
[20] Vendel AL, Bessa F, Alves VE, Amorim AL, Patricio J, Palma AR. logue of the herrings, sardines, pilchards, sprats, shads, ancho-
Widespread microplastic ingestion by fish assemblages in vies and wolf-herrings. Part 1. Chirocentridae, Clupeidae and
tropical estuaries subjected to anthropogenic pressures. Mar Pristigasteridae; 1985. FAO Fisheries Synopsis, no. 125, vol. 7,
Pollut Bull. 2017;117:448–55. pt. 1, p. 303.
[21] Choi JS, Jung YJ, Hong NH, Hong SH, Park JW. Toxicological [38] Moore CJ, Lattin GL, Zellers AF. Quantity and type of plastic
effects of irregularly shaped and spherical microplastics in a debris flowing from two urban rivers to coastal waters and
marine teleost, the sheepshead minnow (Cyprinodon varie- beaches of Southern California. J Integr Coast Zone Manag.
gatus). Mar Pollut Bull. 2018;129:231–40. 2011;11:65–73.Investigating MPs and toxic elements contamination in canned fishes 837
[39] Chae D-H, Kim I-S, Kim S-K, Song YK, Shim WJ. Abundance and [49] Brennecke D, Duarte B, Paiva F, Cacador I, Canning-Clode J.
distribution characteristics of microplastics in surface sea- Microplastics as vectors for heavy metal contamination from the
waters of the Incheon/Kyeonggi coastal region. Arch Environ marine environment. Estuar Coast Shelf Sci. 2016;178:189–95.
Contam Toxicol. 2015;69:269–78. [50] Li J, Zhang K, Zhang H. Adsorption of antibiotics on micro-
[40] Graham ER, Thompson JT. Deposit- and suspension-feeding plastics. Environ Pollut. 2018;237:460–7.
sea cucumbers (Echinodermata) ingest plastic fragments. [51] Camacho M, Herrera A, Go’mez M, Acosta-Dacal A, Martínez I,
J Exp Mar Bio Ecol. 2009;368:22–9. Henrı'quez-Herna’ndez L, et al. Organic pollutants in marine
[41] Van Cauwenberghe L, Devriese L, Galgani F, Robbens J, plastic debris from Canary Islands beaches. Sci Total Environ.
Janssen CR. Microplastics in sediments: a review of techni- 2019;662:22–31.
ques, occurrence and effects. Mar Environ Res. 2015;111:5–17. [52] Munoz-Olivas R, Camara C. Speciation related to human
[42] Wright SL, Thompson RC, Galloway TS. The physical impacts of health. In: Ebdon L, Pitts L, Cornelis R, Crews H, Donard OFX,
microplastics on marine organisms: a review. Environ Pollut. Quevauviller P, editors. Trace element speciation for environ-
2013;178:483–92. ment, food and health; 2001. 331–53
[43] Rocha-Santos T, Duarte AC. A critical overview of the analytical [53] Ray S. Kiceniuk JW, Ray S, editors. Analysis of contaminants in
approaches to the occurrence, the fate and the behavior of edible aquatic resources. New York: VCH Publishers, Inc; 1994.
microplastics in the environment. TrAC Trends Anal Chem. p. 91–113.
2015;65:47–53. [54] Oehlenschlager J. Identifying heavy metals in fish. In:
[44] Auta HS, Emenike CU, Fauziah SH. Distribution and importance Bremmer HA, editor. Safety and quality issues in fish proces-
of microplastics in the marine environment: a review of the sing. Cambridge: Woodhead Publishing Limited and CRC Press
sources, fate, effects, and potential solutions. Environ Int. LLC; 2002. p. 95–113.
2017;102:165–76. [55] Hosseini SV, Sobhanardakani S, Miandare HK, Harsij M,
[45] Bessa F, Barria P, Neto JM, Frias J, Otero V, Sobral P, et al. Regenstein JM. Determination of toxic (Pb, Cd) and essential
Occurrence of microplastics in commercial fish from a natural (Zn, Mn) metals in canned tuna fish produced in Iran. J Environ
estuarine environment. Mar Pollut Bull. 2018;128:575–84. Health Sci Eng. 2015;13:59.
[46] Collard F, Gilbert B, Compere P, Eppe G, Das K, Jauniaux T, [56] Al Ghoul L, Abiad MG, Jammoul A, Matta J, El Darra N. Zinc,
et al. Microplastics in livers of European anchovies (Engraulis aluminium, tin and Bis-phenol a in canned tuna fish com-
encrasicolus, L.). Environ Pollut. 2017;229:1000–5. mercialized in Lebanon and its human health risk assessment.
[47] Ding J, Zhang S, Razanajatovo RM, Zou H, Zhu W. Heliyon. 2020;6(9):e04995.
Accumulation, tissue distribution, and biochemical effects of [57] Kontominas MG, Prodromidis MI, Paleologos EK, Badeka AV,
polystyrene microplastics in the freshwater fish red tilapia Georgantelis D. Investigation of fish product–metal container
(Oreochromis niloticus). Environ Pollut. 2018;238:1–9. interaction using scanning electron microscopy–X-ray micro-
[48] Volkheimer G. Hematogenous dissemination of ingested analysis. Food Chem. 2006;98(2):225–30.
polyvinyl chloride particles. Ann N Y Acad Sci. [58] Liebezeit G, Liebezeit E. Non-pollen particulates in honey and
1975;246:164–71. sugar. Food Addit Contam Part A. 2013;30:2136–40.You can also read