A portable sensor system for bacterial concentration monitoring in metalworking fluids - JSSS
←
→
Page content transcription
If your browser does not render page correctly, please read the page content below
J. Sens. Sens. Syst., 7, 349–357, 2018
https://doi.org/10.5194/jsss-7-349-2018
© Author(s) 2018. This work is distributed under
the Creative Commons Attribution 4.0 License.

           A portable sensor system for bacterial concentration
                    monitoring in metalworking fluids
                            Marco Grossi1 , Carola Parolin2 , Beatrice Vitali2 , and Bruno Riccò1
                 1 Department of Electrical Energy and Information Engineering “Guglielmo Marconi” (DEI),
                                             University of Bologna, Bologna, Italy
                     2 Department of Pharmacy and Biotechnology, University of Bologna, Bologna, Italy

                                  Correspondence: Marco Grossi (marco.grossi8@unibo.it)

              Received: 16 December 2017 – Revised: 18 April 2018 – Accepted: 24 April 2018 – Published: 8 May 2018

       Abstract. The detection of bacterial concentrations in metalworking fluids (MWFs), oil-in-water emulsions
       used in the cutting industries for cooling and lubrication, is important in order to extend the product life-cycle
       and plan its disposal according to regulations and legislations. The standard method of measuring culturable
       bacterial concentration is the plate count technique (PCT) that, however, has long response times and is not
       suitable for automatic implementation outside a laboratory. In this paper a portable sensor system that measures
       the bacterial concentration in liquid and semi-liquid media exploiting impedance microbiology is presented and
       tested for the application of MWF microbial monitoring. A set of MWF samples, taken from metalworking
       plants, have been tested and good agreement has been found between the system response and that of the PCT.
       The proposed system allows automated bacterial concentration measurements with shorter response times than
       the PCT (4 to 24 h vs. 24 to 72 h) and is suitable for in-the-field MWF monitoring.

1   Introduction                                                   the air as aerosols during operation (Kriebel et al., 1997;
                                                                   Zacharisen et al., 1998). Once worn out, MWFs become a
Bacterial concentration detection and monitoring are impor-        waste and must be disposed of according to regulations, us-
tant in different fields (Bahadir and Sezginturk, 2015), such      ing techniques such as membrane filtration (Cheryan and Ra-
as food quality assurance (Fakruddin et al., 2013; Calix-Lara      jagopalan, 1998), electrocoagulation (Kobya et al., 2008) and
et al., 2014), clinical analysis (Singh et al., 2014) and envi-    biological treatment (Van Der Gast et al., 2004). MWF dis-
ronmental monitoring (Rizzo et al., 2013), in order to (a) en-     posal, then, represents a significant cost and has an impact
sure that the total bacterial concentration does not exceed        on the environment. In order to extend the life of MWFs as
thresholds set by national and international regulations, and      much as possible, bacterial concentration must be regularly
(b) guarantee the absence of particular pathogens, such as         measured and counteractions (i.e. addition of a biocide to the
Salmonella typhimurium and Escerichia coli O157:H7, rep-           product) must be taken when needed.
resenting a threat to human health even at very low concen-           The standard method to measure culturable bacterial con-
trations.                                                          centration is the plate count technique (PCT) (Grigorova and
   Another interesting application is the contamination mon-       Norris, 1990) that is accurate and reliable but has long re-
itoring of metalworking fluids (MWFs) (Bakalova et al.,            sponse times (in the range 24 to 72 h) and requires manual
2007), namely oil-in-water emulsions used for cooling and          operations by trained personnel in a laboratory. Thus, it is
lubrication in metalworking plants (Stephenson and Aga-            not suitable for in situ measurements, nor as the base for au-
piou, 2005). Due to the presence of compounds such as gly-         tomatic instruments.
cols, fatty acid soaps and amines, bacteria can easily prolif-        Many alternatives to the PCT have been proposed in the
erate in MWFs, thus leading to product degradation (hence,         literature, based on different transduction principles, such
loss of performance), as well as to potential threats to the       as turbidimetric (Koch, 1970), where the optical absorbance
health of exposed workers, since MWFs are dispersed in             at a particular wavelength (usually 600 nm) is used to es-

Published by Copernicus Publications on behalf of the AMA Association for Sensor Technology.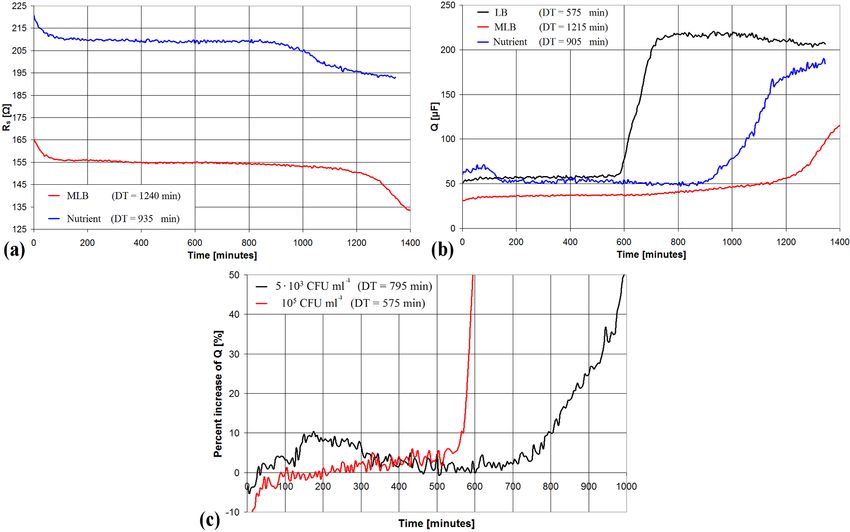
350                                                               M. Grossi et al.: A portable system for bacterial monitoring

timate bacterial concentration; electrochemical biosensing        munication technology (ICT) solutions to measure, process
(Radhakrishnan et al., 2014), where a particular bio-receptor     and transmit data, can be used, by anybody, for in situ micro-
is immobilized on the sensing electrodes and the binding of       bial screening inside metalworking plants.
the target bacterial strain produces changes in some electri-
cal parameters; or flow cytometry (van Nevel et al., 2013),
used in commercial instruments such as Bactoscan by Foss          2     Experimental design
Electric.
   Other culture-independent techniques have been imple-          The portable system, shown in Fig. 1a and b, is composed
mented for bacterial concentration measurements and ap-           of an aluminium box (26 × 18 × 25 cm) that can host up
plied to MWFs. Such techniques include quantitative poly-         to four different samples and two ad hoc designed elec-
merase chain reaction (qPCR) (Saha and Donofrio, 2012),           tronic boards (based on STM32 microcontrollers) devoted
adenosine triphosphate (ATP) bioluminescence measure-             to electrical measurement and thermoregulation, respectively
ments (Webster et al., 2005) and matrix-assisted laser des-       (Grossi et al., 2017). Within the chamber, heating is realized
orption ionization time of flight (MALDI-TOF) mass spec-          by means of four power resistors (50 W, 1.2 ) connected in
trometry measurements (Koch et al., 2015). All these are          series. A NTC temperature sensor (B57045K produced by
characterized by near-real-time measurements and can also         TDK) is placed inside the chamber to provide a feedback to
detect non-culturable bacterial strains. However, qPCR and        the thermoregulation system. The samples under test (SUT)
MALDI-TOF require expensive machineries and equip-                are contained in 50 mL polypropylene vials featuring two
ments, as well as highly trained personnel. ATP measure-          stainless steel electrodes (diameter 5 mm, spaced 12 mm) for
ments have been characterized by low accuracy for a long          electrical characterization (Fig. 1c). On the top cover of the
time due to chemical interferences with the ingredients of        box, a 320 × 240 LCD display and four buttons are used as
MWFs. Recent advances indicate the possibility of improv-         a user interface. A USB port allows the measured data to be
ing the measurement accuracy by adding a filtration step          transferred to a PC for filing and further processing.
(Canter, 2009) that, however, makes the procedure signifi-
cantly more complex.
   The industrial standard for in-the-field MWF bacterial         2.1    Working principle
monitoring is based on dip-slide test kits that are time-
consuming (36 to 48 h for most bacterial species) and lack        Each SUT, possibly diluted in an enriching medium, is
the accuracy of the PCT.                                          hosted in one of the vials placed inside the system chamber,
   Another technique used to measure bacterial concentra-         heated to a chosen temperature (T ∗ ), in our case T ∗ = 37 ◦ C
tion is impedance microbiology (IM) (Firstenberg-Eden and         to favour bacterial growth. After a time (τ = 60 min) needed
Eden, 1984), exploiting the fact that bacterial metabolism        for the temperature to stabilize, the SUT electrical pa-
transforms uncharged or weakly charged compounds into             rameters (i.e. resistive and capacitive components of the
highly charged ones, thus producing a measurable change in        impedance) are measured at regular time intervals of 5 min.
the sample electrical parameters, allowing us to estimate the     As shown in Fig. 1d, until the SUT bacterial concentration
unknown bacterial concentration. IM can be easily imple-          (CB ) is lower than a critical threshold CTH , of the order of
mented in automatic form and provides results in a shorter        107 colony forming unit (CFU) mL−1 , the electrical param-
time compared to the PCT. IM has been successfully tested         eters are essentially constant, while they deviate from the
for bacterial concentration measurements in various types of      baseline value when CB > CTH . The time at which the elec-
samples, such as ice cream (Grossi et al., 2008, 2010), meat      trical parameters start to deviate from their baseline values,
(Firstenberg-Eden, 1983), vegetables (Hardy et al., 1977),        denoted the detection time (DT), is a linear function of the
raw milk (Grossi et al., 2011a), fresh water (Grossi et al.,      logarithm of the initial (unknown) CB that can thus be es-
2013), beer (Pompei et al., 2012), and human urine samples        timated from DT. The curves of the monitored electrical pa-
(Settu et al., 2015), and to test the efficiency of various an-   rameter vs. time are shown in Fig. 1e in the case of three sam-
tibiotics and chemical preservatives (Zhou and King, 1995).       ples featuring different contaminations (CB1 , CB2 and CB3 ,
   In this work we present results obtained by testing a set of   respectively). Of course, lower values of CB lead to higher
MWF samples using a new portable sensor system, based on          DT. Plotting the measured DTs vs. the logarithm of corre-
IM. The investigation aims at determining the total bacterial     sponding values of CB , a calibration line can be obtained that
concentration (hereafter simply called “bacterial concentra-      allows us to estimate CB from the measured DT.
tion”) of all bacterial species present in the sample. The sen-      The calibration line can also be used to estimate parame-
sor could also be employed for the measurements of the con-       ters describing the bacterial growth kinetics, such as the lag
centration of a particular microbial species, by diluting the     time TLAG (i.e. the time needed for the bacteria to adapt to the
sample in a selective enriching medium, such as MacConkey         growth medium) and the mean generation time TGEN (i.e. the
Broth for coliforms or Mannitol Salt Broth for staphylococci.     mean time between cell duplication). In particular, for this
The proposed instrument, exploiting information and com-          purpose the following equations can be used (Grossi et al.,

J. Sens. Sens. Syst., 7, 349–357, 2018                                                 www.j-sens-sens-syst.net/7/349/2018/
M. Grossi et al.: A portable system for bacterial monitoring                                                                          351

Figure 1. Photographs of the outside (a) and inside (b) of the portable sensor system for bacterial concentration measurement. Modified
vial used to host the sample (c). Measured sample resistance and bacterial concentration vs. time (d). Variation of the measured electrical
parameter vs. time for samples featuring different bacterial concentrations (e).

2009):                                                                  al., 2010; Cuadras and Kanoun, 2009) and conductometric
                                                                        titrations (Grossi and Riccò, 2017b). A sine-wave voltage test
TGEN = −A × Log (2) ,                                          (1)      signal Vin (t) is applied at the sensor electrodes,
TLAG = B + τ + A × Log (CTH ) ,                                (2)
                                                                        Vin (t) = VM,in sin (2πf t) ,                                  (4)
where A and B are the slope and offset of the calibration
line, respectively, while τ is the delay needed for the thermal         and the current Iin (t) through the electrodes is measured by
chamber to reach equilibrium.
   If the frequency (f ) of the applied test signal is lower            Iin (t) = IM,in sin (2πf t + φ) ,                              (5)
than 1 MHz, the system composed of the SUT in direct con-
                                                                        where VM,in and IM,in are the voltage and current amplitudes,
tact with the electrodes can be modelled as the series of a
                                                                        respectively, while ϕ is the phase difference between Vin (t)
resistance (Rs ), accounting for the medium electrical con-
                                                                        and Iin (t). The impedance Z is then calculated as
ductivity, and a constant phase element (CPE), taking care
of the capacitive electrode–electrolyte interface. Thus, the                 VM,in −j φ
impedance Z can be modelled as                                          Z=         ·e   = |Z| · ej ·Arg(Z) .                           (6)
                                                                             IM,in
                               1
Z = Rs + ZCPE = Rs +                    .                      (3)      All electrical measurements are carried out by an ad hoc de-
                          Q × (j 2πf )α                                 signed electronic board (based on the STM32L152RET6 mi-
Q is the interface capacitance and α an empirical parame-               crocontroller), and a simplified schematic of the measuring
ter accounting for the non-ideal behaviour of CPE (if α = 1,            circuit is shown in Fig. 2. A sine-wave voltage signal VA (t)
CPE becomes an ideal capacitance).                                      is generated using the 12-bit digital-to-analogue converter
                                                                        (DAC) of the microcontroller. The signal is then scaled with
                                                                        an inverting amplifier (ratio 1 : 10) to generate the VB (t) sig-
2.2   Measurement of the electrical parameters
                                                                        nal applied to the sensor electrodes. The current through the
The SUT electrical parameters Rs and Q are measured by                  electrodes is fed to a current-to-voltage (I/V) converter that
electrical impedance spectroscopy (EIS) (Grossi and Riccò,              generates a voltage VC (t) proportional to the current. The I/V
2017a), a technique widely used also for human body anal-               converter feedback resistance is a programmable digital po-
ysis (Mialich et al., 2014; Khalil et al., 2014), food char-            tentiometer (MCP4131 127 steps 10 k full range) to allow
acterization (Harker and Maindonald, 1994; Grossi et al.,               a wide range of impedances to be measured.
2011b, 2012a, 2014a, b), corrosion monitoring (Loveday et                  Two analogue multiplexers (ADG804YRMZ) allow up to
al., 2004; Bonora et al., 1995), battery management (Ran et             four different SUTs to be tested in a single assay. The VA (t)

www.j-sens-sens-syst.net/7/349/2018/                                                         J. Sens. Sens. Syst., 7, 349–357, 2018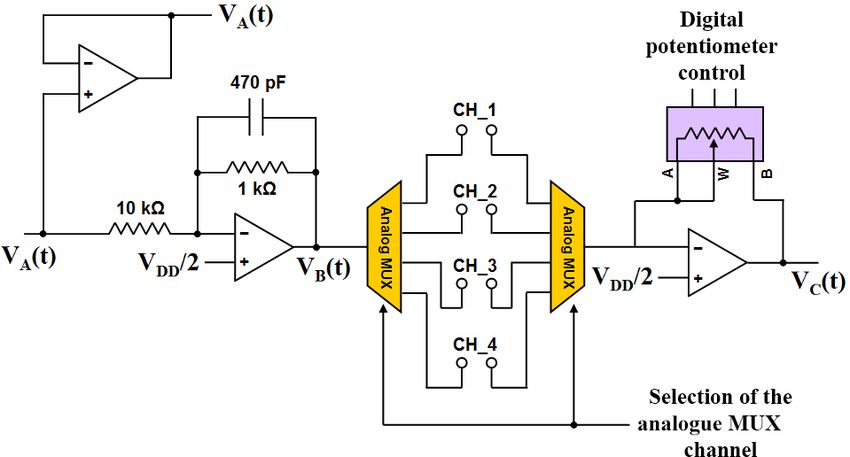
352                                                                    M. Grossi et al.: A portable system for bacterial monitoring

Figure 2. Schematic of the circuit used to measure the sample electrical parameters.

Figure 3. Chamber temperature vs. time for three different sets of PID parameters (a). Chamber temperature and sample temperature vs.
time (b).

and VC (t) signals are acquired by the 12-bit analogue-to-              (Fairchild) to isolate the board low-power and high-power
digital converter (ADC) of the microcontroller, the sine-wave           sections from one another. The target temperature (T ∗ ) in-
parameters are calculated using the algorithm discussed in              side the chamber is regulated using a PID algorithm (updated
Grossi et al. (2012b) and the SUT impedance is calculated               every 1 s) that modulates the duty cycle of the PWM signal
using the following equations:                                          (PWMDC ) according to the formula

       VM,A                                                             PWMDC,k = Pk + Ik + Dk ,                                  (9)
ReZ =         × cos (φ) × RF ,                                 (7)
      10VM,C
         VM,A                                                           where Pk , Ik , and Dk are the proportional, integral, and
ImZ = −        × sin (φ) × RF ,                                (8)      derivative components of the PWM signal duty cycle at time
        10VM,C
                                                                        k defined as
where VM,A and VM,C are the amplitudes of VA (t) and VC (t),
                                                                        Pk = KP × T ∗ − Tk ,

respectively; ϕ is the phase difference between VC (t) and                                                                      (10)
                                                                                             ∗

VA (t); RF is the resistance of the digital potentiometer (con-         Ik = Ik−1 + KI × T − Tk ,                               (11)
trolled by the microcontroller via the SPI interface).                  Dk = KD × (Tk−1 − Tk ) .                                (12)
   The impedance Z is measured for f = 100, 500 and
1000 Hz, while Rs and Q are calculated by fitting the mea-              The temperature at time k (Tk ) is measured with a voltage
sured data with the model of Eq. (3).                                   divider composed of a NTC temperature sensor and a 10 k
                                                                        resistance. The output voltage is acquired by the microcon-
2.3   Chamber temperature control                                       troller ADC and converted to the temperature value.
                                                                           The PID parameters KP , KI and KD are chosen to quickly
The chamber thermoregulation board is based on the                      reach the steady state T ∗ without excessive oscillations. In
STM32F103 microcontroller that drives the power resis-                  Fig. 3a the chamber temperature is plotted vs. time for three
tances using a PWM signal and a FODM1008R2 octocoupler                  different sets of the PID parameters. The set KP = 2, KI =

J. Sens. Sens. Syst., 7, 349–357, 2018                                                      www.j-sens-sens-syst.net/7/349/2018/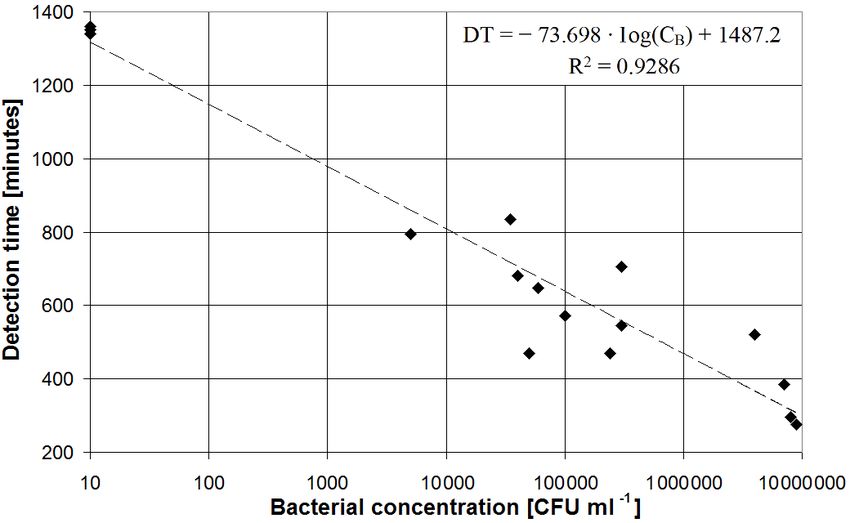
M. Grossi et al.: A portable system for bacterial monitoring                                                                       353

Table 1. Bacterial kinetics parameters and correlation with the PCT for laboratory prepared control samples in three different enriching
media.

                         Enriching medium           Monitored parameter     TGEN (min)     TLAG (min)      R2
                         Luria Bertani              Rs                                –              –       –
                                                    Q                              17.3          81.59    0.99
                         Luria Bertani (modified)   Rs                            24.49          58.24    0.92
                                                    Q                             25.47          64.38    0.95
                         Nutrient                   Rs                            19.43          73.13    0.99
                                                    Q                             23.94          58.78    0.97

0.003, KD = 0 is found to provide the best performance,               24/48 h at 37 ◦ C. Plate count tests were performed in dupli-
namely 30 min to reach the steady state and further oscilla-          cate and the results were reported as CFU mL−1 .
tions smaller than 0.2 ◦ C.
   To investigate the temperature dynamics of the SUT, a test
has been carried out where an additional temperature sen-             3   Results and discussion
sor has been placed inside the sensor vial in direct contact
with the SUT. The results are shown in Fig. 3b, where the             The system presented in this work has been tested with both
temperature in the chamber (external sensor) and that of the          control samples and real MWF samples obtained from metal-
SUT (internal sensor) are plotted vs. time. As can be seen            working plants in the industrial area near Bologna (Italy). In
the SUT temperature is characterized by a much slower time            both cases, results from the sensor system, i.e. measured DTs
response, reaching 74 and 89 % of the full variation after 60         for two electrical parameters (Rs and Q) and three different
and 120 min, respectively.                                            enriching media, have been compared with the bacterial con-
                                                                      centration obtained with the PCT. For each medium, SUTs
                                                                      featuring different bacterial concentrations have been tested
2.4   Microbiological analysis                                        and the calibration line, TGEN and TLAG have been calculated.
                                                                         First, control samples obtained by inoculating different
Escherichia coli ATCC 11105 was cultured in Luria Bertani             concentrations of a laboratory cultured strain of Escherichia
(LB) broth (Tryptone 10 g, yeast extract 5 g, NaCl 10 g in 1 L        coli in sterile enriching media have been tested, in order to
of distilled water) for 18 h, at 37 ◦ C with vigorous agitation,      check the system functionality. DT values have been regis-
to obtain an approx. 109 CFU mL−1 stock suspension. Deci-             tered for any experimental condition (dilution/medium) and
mal dilutions of the stock suspension were prepared in an en-         compared to bacterial concentration measured by the PCT.
riching medium in the range 102 –108 CFU mL−1 , and tested            Table 1 shows the calculated TGEN , TLAG and coefficient of
in the sensor system (20 mL final volume). Three different            determination R 2 (qualifying the fit between measured data
media were employed: LB broth, modified Luria Bertani                 and calibration line) for the three tested media and for the
(MLB) broth (Tryptone 10 g, yeast extract 5 g in 1 L of dis-          Rs and Q electrical parameters; Table 2 presents the base-
tilled water), and nutrient broth (Difco nutrient broth 8 g in        line values (Rs,baseline and Qbaseline ) and the variations in-
1 L of distilled water). MWF samples were obtained from               duced by bacterial metabolism (1Rs and 1Q) for the three
different metalworking plants in Bologna (Italy) and diluted          tested media. In the case of the LB medium, only Q has been
in the enriching media in the ratio 1 : 10. MWF samples fea-          considered since Rs provides no reliable results due to the
ture an oil concentration between 1 and 10 %, with a micro-           medium high electrical conductivity hindering conductivity
bial population composed of different species and strains.            variations due to bacterial metabolism. The MLB medium
These samples have been used in metalworking plants for               features lower accuracy in the estimation of bacterial concen-
different times and feature different levels of contamination         tration (lower values of R 2 ). The calculated value of TGEN is
and usage. Once obtained from metalworking plants, each               in the range 17 to 25 min for all tested media and monitored
sample was stored at environmental temperature before test-           parameters (as expected from the literature), with LB giving
ing. The bacterial concentration of culturable cells (hereafter       the best results in terms of sensor response time (lowest value
simply bacterial concentration) was determined by the PCT             of TGEN ). As shown in Table 2, bacterial metabolism induces
immediately before the start of each assay.                           much stronger variations on Q than on Rs .
    The PCT was performed by plating decimal dilution in                 Since measurements on the control samples have con-
physiological solution (NaCl 9 g in 1 L of distilled water) of        firmed the functionality of the proposed system, hereafter all
each sample onto LB or nutrient agar plates (LB or nutri-             the investigations are carried out on real MWF samples. A set
ent broth added with 1.5 % agar). Plates were incubated for           of 16 MWF samples, obtained from different metalworking

www.j-sens-sens-syst.net/7/349/2018/                                                       J. Sens. Sens. Syst., 7, 349–357, 2018
354 M. Grossi et al.: A portable system for bacterial monitoring
Table 2. Electrical parameter baseline values and variations induced by bacterial metabolism for laboratory prepared control samples in three
different enriching media.
Enriching medium Rs,baseline () 1Rs () Qbaseline (µF) 1Q (µF)
Luria Bertani 28.22 – 46.6 102.94
Luria Bertani (modified) 202.85 44.42 15.07 46.75
Nutrient 284.8 20.85 44.1 55.55
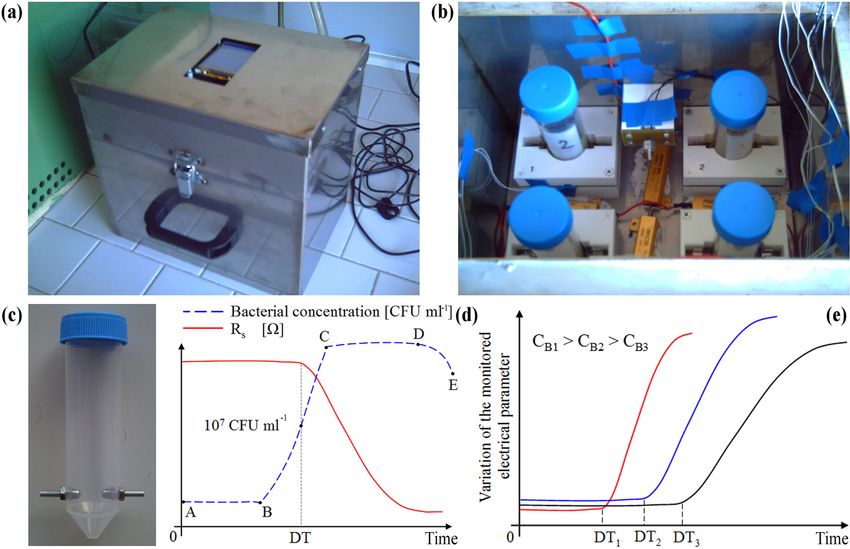
Figure 4. Measured electrical parameters, Rs (a) and Q (b), plotted vs. time for a MWF sample featuring a contamination of 105 CFU mL−1 .
Percent increase in Q vs. time for two MWF samples featuring different bacterial concentrations in the LB medium (c).
plants, has been tested by diluting the sample in the enrich- sults, shown in Fig. 5, have been analysed with the EXCEL
ing medium in the ratio 1 : 10. All measurements have been XLSTAT add-on package software, and a linear regression
carried out in duplicate using the three enriching media men- (R 2 = 0.9286) was found between DT and the logarithm of
tioned earlier. In Fig. 4a and b the measured Rs and Q are bacterial concentration, expressed as
plotted vs. time for a MWF sample featuring a bacterial con-
centration of 105 CFU mL−1 , taken as an example. The Rs DT = −73.698 × Log (CB ) + 1487.2, (13)
curve for LB is not shown since, due to the (too) high con-
ductivity of the medium, no detectable variation is produced where, assuming a confidence interval of 95 %, the slope of
by bacterial metabolism. The results obtained with the MWF the calibration line is in the range −85.411 to −61.985, while
samples confirmed that LB is the enriching medium provid- the intercept falls in the interval 1351.716 to 1622.701.
ing the fastest response and the best correlation with the PCT. Data variability has been investigated by analysing the
Thus, in the following only results obtained with LB and pa- measured DT for repeated assays carried out on the same
rameter Q are shown. sample.
Figure 4c shows the percent variation of Q vs. time for two For this purpose seven SUTs (characterized by DTs
different SUTs featuring different bacterial concentrations from 475 to 820 min) have been used, each tested twice.
(5 × 10³ and 105 CFU mL−1 ). As expected, the higher bac- The average difference in these couples of measurements
terial concentration leads to a lower value for DT (575 min) was 22.86 min, corresponding to a standard deviation of
compared with the other case (795 min). 14.39 min. According to Eq. (13), this results in an average
For each SUT the measured DT has been plotted vs. difference for Log(CB ) of only 0.31, clearly indicating that
the bacterial concentration measured with the PCT. The re- data variability is essentially due to the diversity of the bac-
J. Sens. Sens. Syst., 7, 349–357, 2018 www.j-sens-sens-syst.net/7/349/2018/M. Grossi et al.: A portable system for bacterial monitoring 355
Figure 5. Scatter plot of measured detection time vs. bacterial con- Figure 6. Scatter plot of estimated bacterial concentration vs. bac-
centration measured by the PCT for all tested MWF samples. terial concentration measured by the PCT for all tested MWF sam-
ples.
terial microflora, while measurement repeatability plays only kits. This allows us to carry out the measurements overnight
a minor role. and to obtain the response in the morning of the next day.
The kinetics of the population growth, calculated accord- By setting a DT threshold (DTTH ) of 710 min, all samples
ing to Eqs. (1) and (2), features TGEN in the range 42.96 to featuring a bacterial concentration > 105 CFU mL−1 are cor-
59.2 min, and TLAG between 35.06 and 683.63 min. rectly classified as contaminated (DT < DTTH ), while those
As can be seen, these parameters have higher values and with bacterial concentration < 4 × 10⁴ CFU mL−1 are clas-
much higher dispersion than when a laboratory cultured sin- sified as non-contaminated (DT > DTTH ). The time response
gle strain of Escherichia coli is used. This can be due to of the proposed system is longer than that of near-real-time
the large diversity of bacterial species present in the samples assays, such as ATP bioluminescence. However, (a) sample
(higher dispersion) and the fact that autoctone bacterial cells preparation is much simpler (comparable to the dip-slide test
need some time to adapt to the new growth medium (higher kit); (b) it allows the detection of viable cells only; and (c) the
values of TGEN and TLAG ). correlation with the PCT is better (R 2 = 0.9286 vs. R 2 in the
The obtained calibration line has been used to estimate range 0.743 to 0.893 for ATP) (Webster et al., 2005).
the bacterial concentration based on the measured DT. Fig-
ure 6 reports the scatter plot of the estimated bacterial con-
centration (CB ) vs. the bacterial concentration measured by 4 Conclusions
the PCT (CPCT ), showing the linear regression line (Y =
0.9999X) as well as the 95 % upper and lower bounds. The This paper presents a portable sensor system, exploiting
random variable Log10 (CB /CPCT ), accounting for the differ- impedance microbiology, that can be used to measure bacte-
ence between CB and CPCT , has been fitted with a Gaussian rial concentrations in metalworking fluids (MWFs). The sys-
distribution using a Chi-square goodness of fit test with a tem, featuring a thermal chamber and two electronics boards,
significance level α = 0.05. The computed p-value (0.237) has been tested, and the results show that bacterial concen-
is significantly higher than the significance level (0.05), thus tration can be estimated with good accuracy and that the
confirming the hypothesis that Log10 (CB /CPCT ) follows a samples can be clustered according to their level of contami-
Gaussian distribution. The random variable features an av- nation. Recently, many culture-independent techniques have
erage value of −7.64 × 10⁻⁵ and a standard deviation (due been used to detect and quantify microbial species in MWFs.
to the diversity of bacterial species) of 0.563. According to They have the advantage of real-time measurements and high
the fitting distribution, in about 93.75 % of the cases bacterial performance but require expensive instruments and highly
concentration is estimated with an error lower than an order trained personnel. In addition, culture-independent methods
of magnitude (i.e. |Log10 (CB /CPCT )| < 1); thus, the SUTs do not discriminate live from dead microbial cells.
can be reliably clustered according to their level of contami- The system presented in this work can be used for quick (a
nation. few hours) and automated monitoring of MWF contamina-
Overall, considering a critical threshold for bacterial con- tion, allowing reliable in situ detection, without the need for
centration of 105 CFU mL−1 (a common value assumed in qualified personnel. The possibility of easy employment of
metalworking industries to discriminate low from high con- the system can provide benefits to metalworking industries
taminations), the time response of the proposed system is less in terms of MWF extended lifetime, lower costs and reduced
than 50 % of the time required by the PCT or dip-slide test impact on the environment.
www.j-sens-sens-syst.net/7/349/2018/ J. Sens. Sens. Syst., 7, 349–357, 2018356 M. Grossi et al.: A portable system for bacterial monitoring
Data availability. The underlying measurement data are not pub- Grossi, M., Pompei, A., Lanzoni, M., Lazzarini, R., Matteuzzi, D.,
licly available, but can be requested from the authors if required. and Riccò B.: Total bacterial count in soft-frozen dairy products
by impedance biosensor system, IEEE Sens. J., 9, 1270–1276,
2009.
Competing interests. The authors declare that they have no Grossi, M., Lanzoni, M., Pompei, A., Lazzarini, R., Matteuzzi, D.,
conflict of interest. and Riccò, B.: An embedded portable biosensor system for bac-
terial concentration detection, Biosensors and Bioelectronics, 26,
Edited by: Anita Lloyd Spetz 983–990, 2010.
Reviewed by: two anonymous referees Grossi, M., Lanzoni, M., Pompei, A., Lazzarini, R., Matteuzzi, D.,
and Riccò, B.: A portable biosensor system for bacterial concen-
tration measurements in cow’s raw milk, Proceedings of the 4th
IEEE International Workshop on Advances in Sensors and Inter-
faces, 132–137, 2011a.
References Grossi, M., Lazzarini, R., Lanzoni, M., and Riccò, B.: A novel tech-
nique to control ice cream freezing by electrical characteristics
Bahadir, E. B. and Sezginturk, M. K.: Applications of com- analysis, J. Food Eng., 106, 347–354, 2011b.
mercial biosensors in clinical, food, environmental, and bio- Grossi, M., Lanzoni, M., Lazzarini, R., and Riccò, B.: Automatic
threat/biowarfare analyses, Anal. Biochem., 478, 107–120, 2015. ice-cream characterization by impedance measurements for op-
Bakalova, S., Doycheva, A., Ivanova, I., Groudeva, V., and Dimkov, timal machine setting, Measurement, 45, 1747–1754, 2012a.
R.: Bacterial microflora of contaminated metalworking fluids, Grossi, M., Lanzoni, M., Lazzarini, R., and Riccò, B.: Linear non
Biotechnology and Biotechnological Equipment, 4, 437–441, iterative sinusoidal fitting algorithm for microbial impedance
2007. biosensor, Sensors & Transducers Journal, 137, 235–244, 2012b.
Bonora, P. L., Deflorian, F., and Fedrizzi, L.: Electrochemical Grossi, M., Lazzarini, R., Lanzoni, M., Pompei, A., Matteuzzi, D.,
impedance spectroscopy as a tool for investigating underpaint and Riccò, B.: A portable sensor with disposable electrodes for
corrosion, Electrochim. Acta, 41, 1073–1082, 1995. water bacterial quality assessment, IEEE Sens. J, 13, 1775–1782,
Calix-Lara, T. F., Rajendran, M., Talcott, S. T., Smith, S. B., Miller, 2013.
R. K., Castillo, A., Sturino, J. M., and Taylor, T. M.: Inhibi- Grossi, M., Di Lecce, G., Gallina Toschi, T., and Riccò, B.: A novel
tion of Escherichia coli O157:H7 and Salmonella enterica on electrochemical method for olive oil acidity determination, Mi-
spinach and identification of antimicrobial substances produced croelectronics Journal, 45, 1701–1707, 2014a.
by a commercial Lactic Acid Bacteria food safety intervention, Grossi, M., Di Lecce, G., Gallina Toschi, T., and Riccò, B.: Fast
Food Microbiol., 38, 192–200, 2014. and accurate determination of olive oil acidity by electrochemical
Canter, N.: New test method for detecting microbes in MWFs, Tri- impedance spectroscopy, IEEE Sens. J, 14, 2947–2954, 2014b.
bol. Lubr. Technol., 65, 8–9, 2009. Grossi, M., Parolin, C., Vitali, B., and Riccò, B.: Bacterial concen-
Cheryan, M. and Rajagopalan, N.: Membrane processing of oily tration detection using a portable embedded sensor system for
streams. Wastewater treatment and waste reduction, J. Membrane environmental monitoring, Proceedings of the 7th IEEE Interna-
Sci., 151, 13–28, 1998. tional Workshop on Advances in Sensors and Interfaces, 246–
Cuadras, A. and Kanoun, O.: SoC Li-ion battery monitoring with 251, 2017.
impedance spectroscopy, Proceedings of the 6th International Hardy, D., Kraeger, S. J., Dufour, S. W., and Cady, P.: Rapid de-
Multi-Conference on Systems, Signals and Devices, 1–5, 2009. tection of microbial contamination in frozen vegetables by auto-
Fakruddin, Md., Bin Mannan, K. S., and Andrews, S.: Viable but mated impedance measurements, Appl. Environ. Microbiol., 34,
nonculturable bacteria: food safety and public health perspective, 14–17, 1977.
ISRN Microbiology, New York, USA, 2013. Harker, F. R. and Maindonald, J. H.: Ripening of nectarine fruit
Firstenberg-Eden, R.: Rapid estimation of the number of microor- (changes in the cell wall, vacuole, and membranes detected using
ganisms in raw meat by impedance measurement, Food Technol., electrical impedance measurements), Plant Physiol., 106, 165–
37, 64–70, 1983. 171, 1994.
Firstenberg-Eden, R. and Eden, G.: Impedance Microbiology, Wi- Khalil, S. F., Mohktar, M. S., and Ibrahim, F.: The theory and fun-
ley, New York, 1984. damentals of bioimpedance analysis in clinical status monitoring
Grigorova, R. and Norris, J. R.: Methods in micro-biology, Aca- and diagnosis of diseases, Sensors, 14, 10895–10928, 2014.
demic Press London, 22, 497–531, 1990. Kobya, M., Ciftci, C., Bayramoglu, M., and Sensoy, M. T.: Study
Grossi, M. and Riccò, B.: Electrical impedance spectroscopy (EIS) on the treatment of waste metal cutting fluids using electrocoag-
for biological analysis and food characterization: a review, J. ulation, Sep. Purif. Technol., 60, 285–291, 2008.
Sens. Sens. Syst., 6, 303–325, https://doi.org/10.5194/jsss-6- Koch, A. L.: Turbidity measurements of bacterial cultures in some
303-2017, 2017a. available commercial instruments, Anal. Biochem., 38, 252–259,
Grossi, M. and Riccò, B.: An automatic titration system for oil con- 1970.
centration measurement in metalworking fluids, Measurement, Koch, T., Passman, F., and Rabenstein, A.: Comparative study of
97, 8–14, 2017b. microbiological monitoring of water-miscible metalworking flu-
Grossi, M., Lanzoni, M., Pompei, A., Lazzarini, R., Matteuzzi, D., ids, Int. Biodeter. Biodegr., 98, 19–25, 2015.
and Riccò, B.: Detection of microbial concentration in ice-cream Kriebel, D., Sama, S. R., Woskie, S., Christiani, D. C., Eisen, E.
using the impedance technique, Biosensors and Bioelectronics, A., Hammond, S. K., Milton, D. K., Smith, M., and Virji, M.
23, 1616–1623, 2008.
J. Sens. Sens. Syst., 7, 349–357, 2018 www.j-sens-sens-syst.net/7/349/2018/M. Grossi et al.: A portable system for bacterial monitoring 357 A.: A field investigation on the acute respiratory effects of metal Saha, R. and Donofrio, R. S.: The microbiology of metalworking working fluids. I. Effects of aerosol exposure, Am. J. Ind. Med., fluids, Appl. Microbiol. Biot., 94, 1119–1130, 2012. 31, 756–766, 1997. Settu, K., Chen, C. J., Liu, J. T., Chen, C. L., and Tsai, J. Z.: Impedi- Loveday, D., Peterson, P., and Rodgers, B.: Evaluation of organic metric method for measuring ultra-low E. coli concentrations in coatings with electrochemical impedance spectroscopy – part 2: human urine, Biosensors and Bioelectronics, 66, 244–250, 2015. application of EIS to coatings, JCT Coatings Tech, 1, 88–93, Singh, R., das Mukherjee, M., Sumana, G., Gupta, R. K., Sood, 2004. S., and Malhotra, B. D.: Biosensors for pathogen detection: A Mialich, M. S., Faccioli Sicchieri, J. M., and Alceu, A. J. J.: Anal- smart approach towards clinical diagnosis, Sensors Actuat. B, ysis of body composition: a critical review of the use of bioelec- 197, 385–404, 2014. trical impedance analysis, International Journal of Clinical Nu- Stephenson, D. A. and Agapiou, J. S.: Metal Cutting Theory and trition, Vol. 2, 1–10, 2014. Practice, CRC Press, Florida, USA, 2005. Pompei, A., Grossi, M., Lanzoni, M., Perretti, G., Lazzarini, R., Van Der Gast, C. J., Whiteley, A. S., and Thompson, I. P.: Temporal Riccò, B., and Matteuzzi, D.: Feasibility of lactobacilli con- dynamics and degradation activity of an bacterial inoculum for centration detection in beer by automated impedance technique, treating waste metal-working fluid, Environ. Microbiol., 6, 254– MBAA Technical Quarterly, 49, 11–18, 2012. 263, 2004. Radhakrishnan, R., Suni, I. I., Bever, C. S., and Hammock, B. D.: van Nevel, S., Koetzsch, S., Weilenmann, H.-U., Boon, N., and Impedance biosensors: applications to sustainability and remain- Hammes, F.: “Routine bacterial analysis with automated flow cit- ing technical challenges, ACS Sustai. Chem. Eng., 2, 1649–1655, ometry, J. Microbiol. Meth., 94, 73–76, 2013. 2014. Webster, A. R., Lee, J., and Deininger, R. A.: Rapid assessment Ran, L., Junfeng, W., Haiying, W., and Gechen, L.: Prediction of of microbial hazards in metalworking fluids, J. Occup. Environ. state of charge of lithium-ion rechargeable battery with elec- Hyg., 2, 213–218, 2005. trochemical impedance spectroscopy theory, Proceedings of the Zacharisen, M. C., Kadambi, A. R., Schlueter, D. P., Kurup, V. P., 5th IEEE Conference on Industrial Electronics and Applications, Shack, J. B., Fox, J. L., Anderson, H. A., and Fink, J. N.: The 684–688, 2010. spectrum of respiratory disease associated with exposure to metal Rizzo, L., Manaia, C., Merlin, C., Schwartz, T., Dagot, C., Ploy, M. working fluids, J. Occup. Environ. Med., 40, 640–647, 1998. C., Michael, I., and Fatta-Kassinos, D.: Urban wastewater treat- Zhou, X. and King, V. M.: An impedimetric method for rapid ment plants as hotspots for antibiotic resistant bacteria and gene screening of cosmetic preservatives, J. Ind. Microbiol. Biot., 15, spread into the environment: A review, Sci. Total Environ., 447, 103–107, 1995. 345–360, 2013. www.j-sens-sens-syst.net/7/349/2018/ J. Sens. Sens. Syst., 7, 349–357, 2018
You can also read