Investor Presentation - March 2022 - Evolution Petroleum
←
→
Page content transcription
If your browser does not render page correctly, please read the page content below
Jonah Field, Wyoming

Investor Presentation
March 2022
Disclaimer
    Forward Looking Statements
     This presentation contains “forward-looking statements.” Forward-looking statements are based on current expectations and include any statement that does not directly relate to a current or historical
     fact. Such statements include those relating to pending acquisitions and associated costs, acreage, production, reserves, and other matters; drilling locations and potential drilling activities; production and
     sales volumes; proved, probable and possible reserves; operating and administrative costs; future operating or financial results; cash flow and anticipated liquidity; business strategy; future dividend policies
     and other matters. These forward-looking statements may generally, but not always, be identified by words such as “estimated”, “projected”, “potential”, “anticipated”, “forecasted” or other words that
     convey the uncertainty of future events or outcomes. Although we believe the expectations and forecasts reflected in these and other forward-looking statements are reasonable, we can give no
     assurance they will prove to have been correct. These statements are based on current plans and assumptions and are subject to a number of risks and uncertainties as further outlined in our Forms 10-K
     and 10-Q. Therefore, the actual results may differ materially from the expectations, estimates or assumptions expressed in or implied by any forward-looking statement, and we caution readers not to
     place undue reliance on these forward looking statements, which speak only as of the date of this presentation. In particular, the pending acquisition disclosed in this presentation may not be
     consummated or, if it is, may be consummated upon materially different terms than currently anticipated and set forth in this presentation, including, for instance, as a consequence of the exercise of
     preferential purchase rights held by third parties which may dramatically reduce the acreage, reserves and production acquired. We undertake no obligation to update these forward looking statements to
     reflect events or circumstances occurring after the date of this presentation.

    Cautionary Note Regarding Oil and Gas Reserves
     Current SEC rules regarding oil and gas reserves information allow oil and gas companies to disclose in filings with the SEC not only proved reserves, but also probable and possible reserves that meet the
     SEC’s definitions of such terms. We disclose only proved reserves in our filings with the SEC. Our proved reserves as of June 30, 2021, were estimated by our independent petroleum engineering firm. In
     this presentation, proved reserves associated with acquired properties and probable and possible reserves, have been estimated by the Company’s internal staff of engineers. Estimates of probable and
     possible reserves are by their nature more speculative than estimates of proved reserves and are subject to greater uncertainties, and accordingly the likelihood of recovering those reserves is subject to
     substantially greater risk. We also disclose proved and unproved drilling locations in this presentation. Actual locations drilled and quantities that may be ultimately recovered from the Company’s interest
     may differ substantially from these estimates. There is no commitment by the Company to drill all of the drilling locations that have been attributed these quantities. Factors affecting ultimate recovery
     include the scope of the Company’s drilling program, which will be directly affected by the decisions of the operators of our properties, availability of capital, drilling and production costs, availability of
     drilling and completion services and equipment, drilling results, agreement terminations, regulatory approvals and actual drilling results, including geological and mechanical factors affecting recovery
     rates. Estimates of reserves may change significantly as development of the Company’s oil and gas assets provides additional data.

    Non-GAAP Reconciliation - Adjusted EBITDA
     Adjusted EBITDA is a non-GAAP financial measure that is used as a supplemental financial measure by our management and by external users of our financial statements, such as investors, commercial
     banks and others, to assess our operating performance as compared to that of other companies in our industry, without regard to financing methods, capital structure or historical costs basis. It is also
     used to assess our ability to incur and service debt and fund capital expenditures. Our Adjusted EBITDA should not be considered an alternative to net income (loss), operating income (loss), cash flows
     provided by (used in) operating activities or any other measure of financial performance or liquidity presented in accordance with U.S. GAAP. Our Adjusted EBITDA may not be comparable to similarly
     titled measures of another company because all companies may not calculate Adjusted EBITDA in the same manner. The Company defines Adjusted EBITDA as net income (loss) plus interest expense,
     income tax expense (benefit), depreciation, depletion and amortization (DD&A), stock-based compensation, other amortization and accretion, ceiling test impairment and other impairments, unrealized
     loss (gain) on change in fair value of derivatives, and other non-cash expense (income) items.

2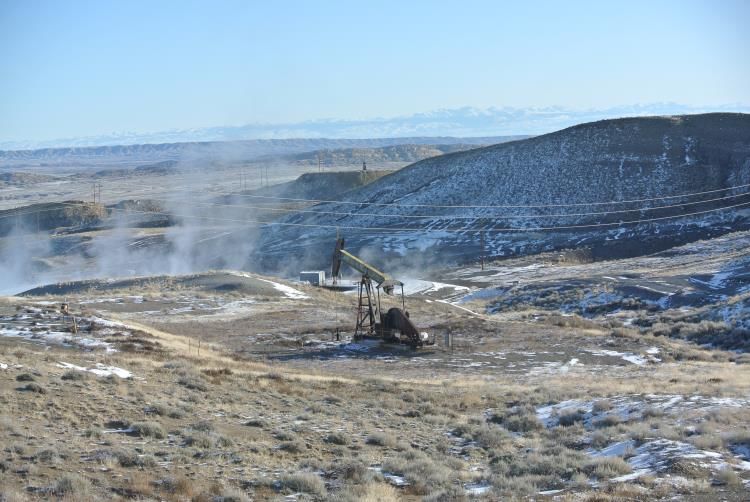
NYSE: EPM
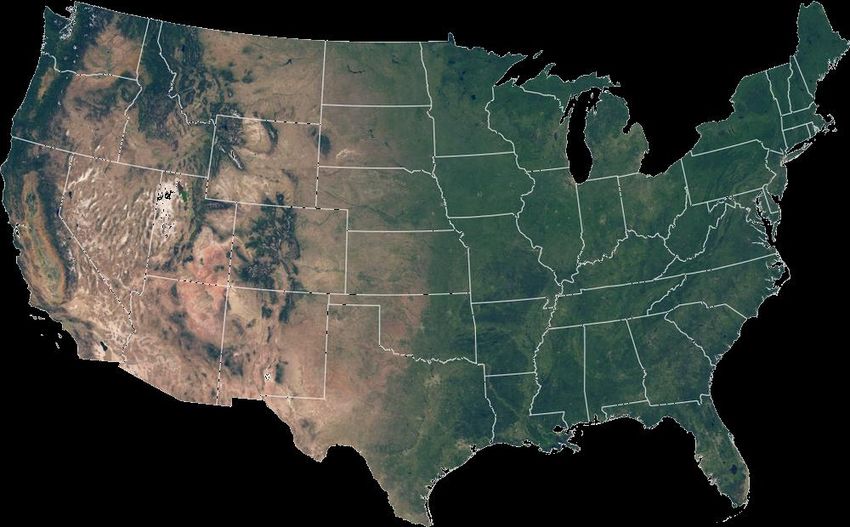
Asset Locations
Company Overview
NYSE American EPM Williston
Shares Outstanding (2/7/2022) 33.69 MM
Basin
Share Price (3/8/2022) $7.69 Hamilton
Jonah Field
Dome
52 Week Range (3/8/2022) $3.01-$8.17 (Expected Close
in April 2022)
Market Cap (3/8/2022) $259.1 MM
Common Dividend (3Q 2022) $0.40 per share (annualized)
Dividend Yield (3/8/2022) 5.2%
Barnett Delhi
5,400 BOEPD
EPM Net Production (1H 2022) Shale
(55% Natural Gas, 29% Oil, 16% NGL)
~8,300 BOEPD
EPM Pro Forma Net Production1
(63% Natural Gas, 25% Oil, 13% NGL)
EPM Headquarters
23.4 MMBOE Houston, TX
Proved Reserves2 (FYE 2021)
(92% PDP)
Probable Reserves2 (FYE 2021) 3.3 MMBOE
Evolution Petroleum is an oil and natural gas company focused on delivering a sustainable dividend
yield to its shareholders through the ownership, management, and development of producing oil
Net Debt3 (12/31/2021) and natural gas properties. Our long-term goal is to build a diversified portfolio of oil and natural
$0.0
($36 MM available capacity4) gas assets primarily through acquisition, while seeking opportunities to maintain and increase
Net Income (Loss) (2Q 2022) $6.8 MM production through selective development, production enhancement, and other exploitation efforts.
Adjusted EBITDA5 (2Q 2022) $10.2 MM
3 See Slide 25 in Appendix for footnotes.
Histor y of Accretive Acquisitions & Development Suppor ting Dividend
    Timeline & Key Statistics                                                                                                                            Per Share Returned to
                                                                                                                                                         Shareholders Since

                                                                                                                                                 2.41
                                                                                                                                            $
                                                                                                                                                         December 2013

                                                                               80
                                                                     $

     5.2
    Current Dividend Yield

                               %
        (Annualized 3Q22)

                                                                                                     Million
                                                                                       In Dividends Returned to Shareholders Since
                                                                                                     December 2013

                                          2003- September                                                           November              May                     January     February
                                                             2006              2009           2013
                                          2004    2003                                                                2019                2021                     2022         2022

                                                                                       Began paying quarterly                  Acquisition of interest Acquisition of interest
                                                                                      dividend to shareholders                  in Barnett Shale in     in Williston Basin in
                    Company is founded in 2003          Purchased royalty                                                          North Texas             North Dakota
                   and went public as Natural Gas      interest in Delhi for             CO2 injection begins
                         Systems in 2004                    $1.5 MM.                                                                             Acquisition of interest in
                                                                                          at Delhi Field with
                                                        Sold Delhi working                                                                       Jonah Field in Wyoming
                                                                                       continued development
                Acquisition of interest in Delhi      interests to Denbury
                                                      for $50MM cash and                                                                Acquisition of interest in
                 Field in northeast Louisiana
                                                       agreement to install                                                          Hamilton Dome field in Wyoming
                  from Denbury Resources
                                                          CO2 flood with
                                                      reversionary working
4                                                            interest
Pillars of Success
Business & Portfolio Investment Strategy
Our Two Pillars:
Sustainable Low
Dividend Leverage
• Return capital to • Maintain strong
shareholders balance sheet
• $84MM(1) paid in • Targeted net
cash & share leverage ofExploration & Production Phases of Ownership, Development & Cash Flow
Life Cycle of Oil & Gas Assets
Proof of Concept Development
I • High Risk, High Capex III • Low Risk, Capex Intensive, Infill Drilling in Late Stages
• Private Equity • Majors & Large Independents
Delineation Mature Cash Flow Harvest
II • Step-out Risk, High Capex, Infrastructure Build-Out IV • Low Risk, Low Capex
• Independent Producers • EPM’s Business Model – Long Tail Production
I. Proof of II. Delineation III. Development Williston Infill IV. Mature Cash Flow Harvest EPM
Concept Development Targeted Acquisitions
High Risk Step-Out Risk
High Capex High Capex High Margins
Low, Repeatable Risk Low Risk
Private Independent
Large, Regular Capex Low Capex
Equity Producers
Daily Production
Long Life & Low Decline Production Profile
Cash Flow
Majors &
Large Independents
2017 2019 2021 2023 2025 2027 2029 2031 2033 2035 2037 2039 2041 2043 2045 2047 2049
DECREASING RISK PROFILE & CAPEX REQUIREMENTS
6D i s c i p l i n e d G r o w t h & Ta r g e t e d A s s e t s
M&A Strategy Evolution Asset Locations
WY Williston Basin
Hamilton Dome ~47,500 Net Acres
• Long-lived reserves with value dominated by proved developed ~620 Net Acres (Closed January 2022)
producing cash flow ND
• Accretive to cash flow and supportive of dividend strategy Jonah Field
~1,040 Net Acres
(Expected Close in WY
• Low ongoing capital investment April 2022) LA
TX
• Locations with reasonable market access and stable regulatory UT
environment
• High margin: Legend: OK Delhi
EPM Asset NM ~3,600 Net Acres
Locations
• Efficient operations economic at existing commodity prices Additional Target
Asset Areas
• Short runway to incremental cash flow Barnett Shale LA
~21,000 Net Acres TX
Potential Reinvestments to Support Dividend Coverage
Maintenance Potential Future Drilling Program Potential Future Acquisition 1 Potential Future Acquisition 2
CAPEX
Cash Flow By Asset
Dividend
Base Production
7G r o w i n g D a i l y P r o d u c t i o n T h r o u g h A c q u i s i t i o n s O v e r t h e L a s t 2 Ye a r s
Scaling Evolution Through Acquisitions 2,420 8,261
571
3,630
409
1,231
1H FY2022
Production (BOEPD)
Hamilton Dome Barnett Shale Williston Basin Jonah Field(1)
Asset
(Wyoming) (Texas) (North Dakota) (Wyoming)
Date Announced - 11/6/2019 3/30/2021 1/14/2022 2/9/2022 FY2022E
Acquisition Price - $9.5 MM $18.2 MM $25.9 MM $29.4MM(2) -
Operator -
1H FY2022 Avg. Daily
1,231 BOEPD 409 BOEPD 3,630 BOEPD 571 BOEPD 2,420 BOEPD 8,261 BOEPD
Production(3,4)
73% Gas 76% Oil 88% Gas 43% Oil
Commodity 80% Oil
100% Oil 26% NGL 14% NGL 6% NGL 40% Gas
Mix(3,5,6,7,8) (Reserves) 20% NGL
1% Oil 10% Gas 6% Oil 17% NGL
Pro Forma
8.2 MMBOE(5) 1.8 MMBOE(5) 11.3 MMBOE(6) 9.7 MMBOE(7) 7.0 MMBOE(8) 38.0 MMBOE
Proved Reserves(3)
Net Acreage ~3,600 ~620 ~21,000 ~47,500 ~1,040 ~73,760
Working Interest /
23.9% / 26.2% 23.5% / 19.7% 17.0% / 14.0% 38.7% / 32.5% 19.3% / 14.7% -
Revenue Interest
8 See Slide 25 in Appendix for footnotes.Company Pro Forma with Williston Basin & Jonah Field Acquisitions
EPM Daily Production Projections
Jonah Field Williston Basin
Acquisition of Jonah Field
Barnett Shale Hamilton Dome (Expected Close in April 2022)
Delhi Field
Acquisition of Williston Basin
BOEPD
Acquisition of Barnett Shale
Working Interest Acquisition of Hamilton Dome
Reversion at Delhi
Planned Facility
Downtime at Delhi Beginning of 9-month Shut-in
of CO2 Supply Line for Repairs
Jul-14 Jan-15 Jul-15 Jan-16 Jul-16 Jan-17 Jul-17 Jan-18 Jul-18 Jan-19 Jul-19 Jan-20 Jul-20 Jan-21 Jul-21 Jan-22
9Acquisitions Diversify & Strengthen Proved Reser ves Base
EPM Pro Forma: Diversified Portfolio
Pro Forma Daily Production(1,2) Pro Forma Proved Reserves (MMBOE)(3) Pro Forma Proved Reserves by Classification (3)
12.9%
17.3% 23.9%
24.5%
8.3 38.0 42.5% 0.4% 38.0
MBOE/D MMBOE MMBOE
Commodity
Classification:
Type:
Oil PDP
40.2%
62.6% NGLs PDNP
75.7%
Gas PUD
Pro Forma Daily Production(1,2) Asset Locations
Commodity Pro Forma Daily Production(2) ND
Hamilton Dome
~620 Net Acres
Oil ~2,000 BOPD Williston Basin
WY ~47,500 Net Acres
Jonah Field
(Closed January 2022)
NGL ~1,100 BPD ~1,040 Net Acres
(Expected Close
April 2022)
Delhi
Gas ~31,000 MCFD ~3,600 Net Acres
Barnett Shale
~21,000 Net Acres
Total ~8,300 BOEPD
TX LA
Notes:
1. Gas conversion ratio of 6:1; NGL ratio of 1:1.
2. Estimated average net production 6 months ended 12/31/2021. Excluding 130 BOEPD associated with Giddings Field correction received in Q2 FY2022. Pro forma daily production includes the Jonah Field
acquisition which has not yet closed; expected close in April 2022.
3. EPM Reserves as of 7/1/2020 at 6/30/2021 SEC prices less 1H FY 2022 Production. Barnett reserves are Company adjusted for ethane rejection; see slide 28 in Appendix. Williston Basin Company engineered
10 reserves as of 1/1/2022 at 12/31/2021 SEC prices of $3.64/MMBTU and $66.55/bbl. Jonah Field Company engineered reserves as of 2/1/2022 at 12/31/2021 SEC prices of $3.64/MMBTU and $66.55/bbl. Jonah
Field acquisition has not yet closed; expected close in April 2022.High-Quality Drilling Locations
Significant Upside Nestled in Williston Acquisition
Williston 3P Reserves by Classification (1,2) Williston 3P Reserves by Commodity(1,2)
4.4% 0.3%
14.3%
14.4%
Classification:
10.2% Commodity
50.4 PDP
50.4 Type:
53.4% MMBoe PDNP
MMBoe Oil
PUD NGLs
27.5% PROB
75.5% Gas
POSS
Proved Undeveloped(1,2) Probable & Possible(1,2)
• 50 Pronghorn/Three Forks 2-mile lateral locations classified • 390 remaining Pronghorn/Three Forks 2-mile lateral
as SEC Proved Undeveloped(3) locations classified as Probable or Possible
• Infrastructure in place and drilling pads already built on • 106 of these locations are expected to meet all Proved
majority of locations requirements except for SEC 5-year rule(3)
• Years of high-quality drilling inventory • With further development in the field, many of these
• Expected drilling and completion costs ~$6.5-$7.0MM/well Probable and Possible locations could be reclassified
• 50+% IRR at current strip (4) as Proved Undeveloped
Notes:
1. Gas conversion ratio of 6:1; NGL ratio of 6:1
2. Williston Basin Company engineered reserves as of 1/1/2022 at 12/31/2021 SEC prices of $3.64/MMBTU and $66.55/bbl.
11 3. SEC Proved Undeveloped locations are planned with ability to be drilled within 5 years.
4. 3/8/2022 strip pricing.Assets 12
Inaugural Corporate Sustainability Repor t Published November 2021
     Committed to Long Term Corporate Sustainability
     Environmental
      • Partnering with operators that share a common goal of upholding high standards of
        environmental stewardship, achieving compliance with regulatory requirements, and
        minimizing the impact on the environment
      • Leveraging enhanced recovery methods to extend the life of hydrocarbon reservoirs, which
        reduces the environmental footprint vs. establishing new operations
     Social
      • Strong focus on employee engagement through open communication across all levels
        of the organization
      • Providing a safe and secure workplace, utilizing policies and procedures that are intended to
        protect the health and wellbeing of our employees and other stakeholders
      • Fostering and cultivating a culture of diversity, equality, and inclusion
      • Making a positive impact in and supporting the communities in which we live and work
     Governance
      • Promoting sound governance practices that lead to informed decision making
      • Ensuring we conduct our business with honesty and integrity in accordance with the highest
        legal and ethical standards
      • Driving Governance fundamentals and clear accountability across our business is key to our      Please visit our website to access our Corporate Sustainability Report:
        long-term success and sustainability                                                                     https://www.evolutionpetroleum.com/sustainability/

      • Board oversight of ESG practices and policies
13
Established PDP Production with Significant Upside
Williston Basin
Overview
• Assets located in the Williston Basin in western North Dakota in McKenzie,
MT ND N
Golden Valley, and Billings Counties
• Production primarily from the Three Forks, Pronghorn, and Bakken formations
• Assets operated by Evolution’s partner, Foundation Energy Management Richland
• Acquisition closed on January 14, 2022 with an effective date of June 1, 2021
McKenzie
and net purchase price of $25.9 MM
Asset Highlights
• Evolution is able to propose, fund, and drill wells via a joint development
agreement with Foundation
~47,500
• Acquisition and a moderate capex drilling program will allow for reinvestment Net Acres
of free cash flow to maximize shareholder value
• Large inventory of documented upside drilling locations
Dawson Wibaux
Dunn
Statistics Golden
Valley
Operator Foundation Energy Management
Avg. Net Daily Prod (1H FY2022) 571 BOEPD
Acreage ~47,500 net acres, 84.4% HBP ND MN
Williston Basin
Average WI% / RI% / LNRI% (1) 38.7% WI / 32.5% RI / 84.0% LNRI
Province
Stark
Gross PDP Wells 73 MT Billings
Pricing Williston Basin Sweet (WBS)
Commodity Split (Reserves) (2) 76% Oil / 14% NGL / 10% Gas SD 0 5 10 15
Net PDP Reserves / Net PUD Reserves(2) 2.2 MMBOE / 7.4 MMBOE
WY
MILES
Net PDP Reserves / Net Production (R/P) (2) 10.3 years
Notes:
14 1. Mathematical average of 73 PDP wells.
2. Company engineered reserves as of 1/1/2022 at 12/31/2021 SEC prices of $3.64/MMBTU and $66.55/bbl..Prolific Natural Gas Field
Jonah Field
Overview
WY
• Jonah Field is located within Wyoming’s Green River Basin in Sublette County
• Produces from the Lance Pool consisting of 3,000’ to 5,000’ of gross thickness 29N 108W N
Hamilton Dome Sublette
(~45% net pay) of over-pressured reservoir County
• Jonah Energy, a top-tier, responsible, and established operator, has operated ~100 miles
the asset since 2014
• The purchase price, subject to purchase price adjustments, was $29.4 MM
with a February 1, 2022 effective date and expected closing date on or about Jonah Field
April 1, 2022 29N 107W
Asset Highlights
29N 109W
• Long life reserves with sub-10% decline(1)
• Multiple takeaway options for gas sales – Kern (West Coast), NWPL
(Northwest), Overthrust / REX (Midcontinent)
Statistics
Operator Jonah Energy
Avg. Net Daily Prod (1H FY2022) 14,520 MCFEPD / 2,420 BOEPD
Acreage ~1,040 net acres, 100% HBP
Offset Jonah Field ~1,040
Average WI% / RI% / LNRI% (2) 19.3% WI / 14.7% RI / 76.2% LNRI
Production Net Acres 28N 107W
Gross PDP Wells 648
Pricing Opal - Northwest Pipeline 28N 109W
28N 108W
Commodity Split (Reserves) (3) 88% Gas / 6% Oil / 6% NGL
0 1 2
Net PDP Reserves(3) 42.0 BCFE / 7.0 MMBOE
MILES
Net PDP Reserves / Net Production (R/P) (3) 8.1 years
Notes:
1. Estimated first year decline.
15 2. Mathematical average of 648 PDP wells.
3. Company engineered reserves as of 2/1/2022 at 12/31/2021 SEC prices of $3.64/MMBTU and $66.55/bbl.Mature Natural Gas & NGL Production
North Texas Barnett Shale
Overview Location
• Assets located in north Texas in Bosque, Denton, Hill, Hood, Johnson, Parker,
Somervell, and Tarrant Counties
N
• Production out of the Barnett Shale formation
• Increased natural gas pricing encouraging operators to reject ethane processing
• Diversified Energy performing low-cost workovers and return to sales projects
Highlights
• Long-lived PDP reserves(1), < 10% base decline
• ~35% natural gas liquids content
• Majority of wells completed between 2007-2010
• Mature, low decline production with potential upside workover opportunities Extent of
• 100% HBP acreage primarily in rural areas allowing for more efficient operations Barnett Shale
Statistics
Operator Diversified Energy Company
Avg. Net Daily Prod (1H FY2022) 21,780 MMCFED / 3,630 BOEPD
Acreage (100% HBP) ~21,000 net acres ~21,000
EPM Average WI % / Avg. NRI % 17.0% / 14.0% Acres
Pricing Access to premium Gulf Coast gas markets
Commodity Split (Reserves) (1) ~73% Gas, ~26% NGLs, ~1% Oil 0 10 20
Net PDP Reserves (1) ~52.5 BCF, ~3.1 MMBbls NGLs, ~0.9MMBbls Oil
MILES
Net PDP Reserves / Net Production (R/P)(1) ~ 9 years
Notes:
16 1. Company FYE2021 reserves report was adjusted by the Company for ethane rejection as of 7/1/2021 at 6/30/2021 SEC prices of $2.47/MMBTU and $49.72/bbl.
See slide 28 for Ethane Rejection Reconciliation in Appendix.Long Life Enhanced Oil Recover y CO2 Flood
Delhi Field
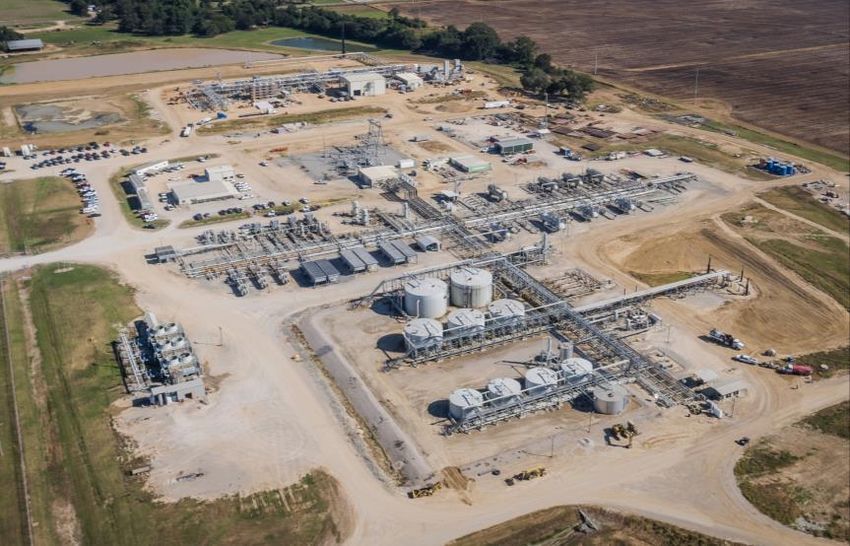
Overview NGL Plant
• Delhi Field is in northeast Louisiana in Franklin, Madison, and Richland parishes
• Produces out of the Tuscaloosa and Paluxy (Holt-Bryant) reservoirs
• Produced over 210 MMBO since it was discovered in the 1940s
• CO2 enhanced oil recovery (EOR) development began in 2009 by Denbury
• CO2 injection allows improved mobility of the oil from the reservoir
Highlights
• No Louisiana oil severance taxes (at 12.5%) until payout
• Delhi crude price based on Louisiana Light Sweet (LLS) pricing which is
historically a premium to WTI; ~80% of production is oil
• Oil transported by pipeline from field – no current capacity constraints
• Rich mix of heavier NGLs, or 60% C4 + C5
• Third party reserve report demonstrates remaining field life of over 20 years(1)
• 418 MMBO of gross original oil in place (OOIP)
Statistics 2010 2009 2012-2013 Town of Delhi
Operator Denbury Resources
Avg Net Daily Prod (1H FY2022) 1,231 BOEPD Phase V
Acreage (100% HBP) ~13,600 gross / ~3,600 net acres Unquantified Future Phase IV
Expansion
EPM Average WI % / Avg. NRI % 23.9% / 26.2% Phase I
Phase II
Pricing Louisiana Light Sweet (LLS)
Unquantified future expansion
Commodity Split (Reserves)1 ~ 80% Oil, ~ 20% NGLs in downdip thinner reservoirs
Phase III & eastern phase – dependent
Net PDP Reserves / Net PUD Reserves1 ~ 6.7 MMBOE / ~ 1.8 MMBOE Proved
2018 Undeveloped on oil price
2015-2017
Net PDP Reserves / Net Production (R/P)1 ~ 13 years PUD Infill (“PUD”)
Infill Drilling in Phases
2011 Program
I & II
Notes:
17 1. DeGolyer & MacNaughton FYE2021 reserves report as of 7/1/2021 at 6/30/2021 SEC prices of $2.47/MMBTU and $49.72/bblL o w H i s t o ric al D e c l in e R a t e Wa t e r f lo o d
Hamilton Dome Field Historical Net Production
Overview
10,000
• Hamilton Dome field is located in the northwestern Wyoming Big Horn Basin in
Hot Springs County ~3.4% Yearly Decline
Since 1974
• Discovered in 1918 and primarily developed from the Phosphoria and Tensleep
reservoirs (~3,000’ depth)
BOEPD
• Merit Energy purchased the asset in 1995 1,000
• The field has been produced via waterflood since the 1970s
Highlights ~0.8% Yearly Decline Since 2016
• Long life, low decline reserves; premier field having produced over 160 MMBO COVID-19 Impacts
over 100 years 100
• 100% oil production; averaging low single-digit decline rates 74 76 78 80 82 84 86 88 90 92 94 96 98 00 02 04 06 08 10 12 14 16 18 20 22
Year
• Top tier operator; Merit Energy operates this field as they have for 20+ years
Operations
Statistics
Operator Merit Energy Company
Avg. Net Daily Prod (1H FY2022) 409 BOPD
Acreage (100% HBP) ~3,160 gross / ~620 net acres
EPM Average WI % / Avg. NRI % 23.5% / 19.7%
Pricing Western Canadian Select (WCS)
Commodity Split (Reserves)(1) 100% Oil
Net PDP Reserves(1) ~ 1.9 MMBbls
Net PDP Reserves / Net Production (R/P)(1) ~ 12.5 years
Notes:
18 1. DeGolyer & MacNaughton FYE2021 reserves report as of 7/1/2021 at 6/30/2021 SEC prices of $2.47/MMBTU and $49.72/bblCompany Performance 19
Adding Significant Scale with Conser vative Leverage & without Diluting Shareholders
Evolution’s Growth Story
Average Daily Production (BOE/day) Adjusted EBITDA ($MM)
10,000 0.091 0.100 $70.0 $2.100
Jonah Field Pro-Forma Adjusted EBITDA $1.950
9,000 Williston Pro-Forma 0.090 Adj EBITDA/ Weighted Share
Barnett Shale $60.0 $1.800
8,000 Hamilton Dome 0.080 $1.650
8,391
7,000 Giddings
0.070 $50.0 $1.500
BOE/Diluted Share
Delhi 0.059 $1.350
$1.113
6,000 Total Production / Weighted Share 0.060 $40.0 $1.200
BOEPD
$/Share
5,000 0.050 $1.050
$MM
5,400 $0.787
$30.0 $0.716 $37.4 $0.900
4,000 0.040 $0.603 $0.750
0.027
0.023 $26.1
3,000 0.022 0.022 0.023 0.030 $20.0 $23.8 $0.389 $0.600
$20.0 $0.244 $0.450
2,000 2,430 0.020
2,105 2,042 2,025 2,035 $10.0 $12.9 $0.300
1,000 0.010 $8.1 $0.150
0 0.000 $0.0 $0.000
FY17A FY18A FY19A FY20A FY21A 1H22A 1H22 Pro-Forma FY17A FY18A FY19A FY20A FY21A FYTD22 FYTD22 Pro
Annualized Forma
Lease Operating Expenses (LOE) & Cash G&A1 Total Debt/ Adjusted EBITDA & Shares Outstanding
3.0 60.0
CO2 Expenses Debt/ Adj EBITDA
Other LOE Shares Outstanding
Cash G&A 2.5 50.0
Total Debt / Adjusted EBITDA
Shares Outstanding (MM)
$5.66 $1.30
$6.20
$5.34
2.0 33.6 33.6 40.0
$7.25 33.1 33.2 33.2 33.0 33.3
$4.95
$10.27
1.5 30.0
$/BOE
$9.33 $13.43 $15.25 $16.59
$8.27 1.0 20.0
< 1.0x
$9.03 0.5 10.0
$5.83 $6.35
$4.70 0.1x
$3.45 $2.83 0.0x 0.0x 0.0x 0.0x 0.0x
0.0 0.0
FY17A FY18A FY19A FY20A FY21A 1H22A 1H22 Pro FY17A FY18A FY19A FY20A FY21A FYTD22 FYTD22 Pro
Forma Annualized Forma
$19.05 $22.93 $24.96 $23.47 $24.90 $20.72
20 Notes:
1. Cash G&A excludes stock-based compensationMinimal Ongoing Development Capital Expenditures
Historical Adjusted EBITDA & Development Capital Expenditures
$30
Adjusted EBITDA CAPEX
$25
Development capex averaged
~14% of Adjusted EBITDA
$20
over the last 5 fiscal years(1)
Dollars in Millions ($MM)
$15
$26.1
$23.8
$10 $20.0 $18.7
$12.8
$5
$8.1
$0
-$2.4 -$2.1
-$0.6 -$0.6
-$5.4 -$5.2
-$5
-$10
(1) (1) (1) (1,2) (1,2)
FY2017 FY2018 FY2019 FY2020 FY2021 FYTD2022
Notes:
21 1. Excludes NGL Plant net capital expenditures of ~$5.9 MM (FY2017-FY2021) and acquisitions of Hamilton Dome (FY2020, ~$9.3 MM) and Barnett Shale (FY2021, ~$18.3 MM).
2. Development capital expenditures are lower for FY2020 and FY2021 compared to previous years due to commodity price volatility in calendar 2020. Our operators responded by curtailing workover and conformance projects.C onsistently Pa id Dividends Through C om modity C yc les
Common Stock Dividends vs. Average Oil Price
$0.12 $120
Cumulative Payout Dec’13 – Dec’21
$0.10
~$80MM ($2.41/share) 3Q22 Dividend
$100
Increased to
$0.10/share
Quarterly Dividend Per Share
$0.08 $80
WTI Average Oil Price
$0.06 $60
$0.04 $40
$0.02 $20
$0.00 $0
Common Stock Dividends WTI EIA Avg Price for Quarter (1)
Note:
22 1. WTI average oil price represents the average of daily close prices for WTI within the associated quarter as reported by EIA. For Quarter ended 3/31/2022, average price through 2/22/2022.$
80
NYSE: EPM
Evolution’s Value Proposition
Attractive Dividend Supports Total Shareholder Return
• Consecutively paid dividends since 2013
• Currently ~5.2% yield at $0.40/share annually Million
In Dividends Returned to Shareholders Since
December 2013Appendix 24
Footnotes
     Slide 3:
     1. Pro Forma 1H FY2022 net production includes recent acquisitions in the Williston Basin and Jonah Field but excludes 130 BOEPD associated
         with a Giddings Field correction received in Q2 FY2022. The Jonah Field acquisition has not yet closed; expected close in April 2022.
     2. Reserves from June 30, 2021 Fiscal Year End Reserves Report. Reserves determined using gas conversion ratio of 6:1; NGL ratio of 1:1.
     3. Net debt represents the Company's outstanding debt of $4 MM less cash and cash equivalents balance of $13.6 MM as of 12/31/2021.
     4. Effective November 9, 2021 the borrowing base increased by $20 MM to a total borrowing base of $50 MM, but with an elected commitment
         amount of $40 MM. There was $4 MM borrowed at 12/31/2021.
     5. See Non-GAAP Reconciliation disclosure on Slide 2 and Non-GAAP Reconciliation table in the Appendix.

     Slide 8
     1. See “Forward Looking Statements” on Slide 2.
     2. Jonah Field acquisition price of $29.4 MM is subject to customary purchase price adjustments and closing conditions, including receipt of all
         necessary written consents, approvals, waivers, and any exercises of preferential purchase rights. The effective date of the transaction is
         February 1, 2022 with a closing date on or about April 1, 2022.
     3. Gas conversion ratio of 6:1; NGL ratio of 1:1.
     4. Estimated average net production 1H FY 2022 (6 months ended 12/31/2021) excluding 130 BOEPD from Giddings field correction received in
         Q2 FY2022.
     5. EPM Reserves as of 7/1/2021 at 6/30/2021 SEC prices of $2.47/MMBTU and $49.72/bbl, less 2022 1H Production.
     6. Barnett reserves as of 7/1/2021 at 6/30/2021 SEC prices of $2.47/MMBTU and $49.72/bbl, less 2022 1H Production. Barnett reserves are
         Company adjusted for ethane rejection, see slide 28 in Appendix.
     7. Williston Basin Company engineered reserves as of 1/1/2022 at 12/31/2021 SEC prices of $3.64/MMBTU and $66.55/bbl.
     8. Jonah Company engineered reserves as of 2/1/2022 at 12/31/2021 SEC prices of $3.64/MMBTU and $66.55/bbl.

25
S t ro n g F i n a n cia l Po s i t io n & S i m p l e C a p it a l S t r u c tu re
Capitalization Table
Capitalization
$ in millions 12/31/2021
Cash and Cash Equivalents $13.6
Senior Credit Facility $4.0
Total Net Debt $0.0
Total Stockholders’ Equity $62.1
Total Book Capitalization $66.1
Credit Statistics
2Q FY22 Annualized Adjusted EBITDA $40.7
Net Debt / 2Q 2022 Annualized Adjusted EBITDA 0.0x
Credit Facility Capacity(1) $36.0
Notes:
1. Effective November 9, 2021 the Company's Senior Secured Credit Facility’s borrowing base increased by
26 $20 million to a total borrowing base of $50 million, but with an elected commitment amount of $40 million.Non-GAAP Reconciliation
Adjusted EBITDA Reconciliation
Adjusted EBITDA is a non-GAAP financial measure that is used as a supplemental financial measure by our management and by external users of our financial statements,
such as investors, commercial banks and others, to assess our operating performance as compared to that of other companies in our industry, without regard to
financing methods, capital structure or historical costs basis. It is also used to assess our ability to incur and service debt and fund capital expenditures. Our Adjusted
EBITDA should not be considered an alternative to net income (loss), operating income (loss), cash flows provided by (used in) operating activities or any other measure
of financial performance or liquidity presented in accordance with U.S. GAAP. Our Adjusted EBITDA may not be comparable to similarly titled measures of another
company because all companies may not calculate Adjusted EBITDA in the same manner.
The Company defines Adjusted EBITDA as net income (loss) plus interest expense, income tax expense (benefit), depreciation, depletion and amortization (DD&A), stock-
based compensation, other amortization and accretion, ceiling test impairment and other impairments, unrealized loss (gain) on change in fair value of derivatives, and
other non-cash expense (income) items.
Year Ended
FY17 FY18 FY19 FY20 FY21 FYTD22
EBITDA Calculation ($ in 000s)
Net Income (Loss) 8,044 19,618 15,377 5,937 (16,438) 12,050
+ Interest Expense 82 111 117 111 91 102
+ Income Tax Expense (Benefit) 4,841 (3,432) 3,482 (2,181) (4,984) 3,264
+ DD&A 5,719 6,012 6,253 5,761 5,167 2,752
+ Stock-Based Compensation 1,181 1,367 888 1,286 1,258 527
+ Other amortization and accretion 60 90 - 25 10 -
+ Impairments 24,938 -
- - - -
- Unrealized (Gain)Loss on Derivatives 14 1,911 (1,911) -
- -
- Other Non-cash (Income) 17 - - (12)
-
Adjusted EBITDA 19,956 23,766 26,117 12,850 8,119 18,695
27Barnett Reser ves
Ethane Rejection Reconciliation
• FYE2021 Barnett reserves were modeled in ethane recovery
• In FY 2022 the operator of the Barnett assets has been electing to reject ethane due to the price of natural gas compared to
ethane in order to maximize revenue; the operator expects to remain in ethane rejection at current pricing forecasts
• Evolution adjusted FYE 2021 Barnett reserves to reflect ethane rejection, see summary table below
• Although revenue and asset value increased, the total number of MBOE decreased
Barnett Reserves as of 7-1-21 @ 6/30/2021 SEC Price
Net Oil Net Gas Net NGL
MBOE(1)
MBO MMcf BOE
Ethane Recovery (FYE 2021) 85 48,571 4,879 13,059
Ethane Rejection (Company Engineered) 87 52,516 3,135 11,975
Difference 3 3,946 -1,744 -1,084
Difference, % 2.96% 8.12% -35.75% -8.30%
28 Notes:
1. Gas conversion ratio of 6:1; NGL ratio of 1:1.REACH US
Contact Information
1155 Dairy Ashford, Suite 425
Houston, TX 77079 info@evolutionpetroleum.com
+1 713 935 0122 www.evolutionpetroleum.com
Thank you for your interest in Evolution Petroleum Corporation
NYSE: EPM
Management Team Board of Directors
Jason Brown | President & CEO | Founder of LongBow Energy, Robert Herlin | Evolution Petroleum Chairman & Co-founder
Co-founder of Halcon Resources, RBC Richardson Barr, Petrohawk |
Edward DiPaolo | Halliburton, Duff & Phelps
jbrown@evolutionpetroleum.com
William Dozier | Vintage Petroleum, Santa Fe Minerals & Amoco
Ryan Stash | Senior Vice President & CFO | Harvest Oil & Gas,
Wells Fargo Securities, Ernst & Young | Kelly Loyd | JVL Advisors, LLC, RBC Capital
rstash@evolutionpetroleum.com
Marjorie Hargrave | President & CFO of Enservco
29You can also read