Ipswich Borough Council Draft Strategic Flood Risk Assessment November 2007
←
→
Page content transcription
If your browser does not render page correctly, please read the page content below
Ipswich Borough Council
Draft Strategic Flood Risk Assessment

November 2007

Ipswich Borough Council
Drainage Engineering.
Ipswich Borough Council
Grafton House,
15 - 17 Russell Road,
Ipswich
IP1 2DE

Contacts:
Denis Cooper, denis.cooper@ipswich.gov.uk
James Calvert, james.calvert@ipswich.gov.uk
Acknowledgements

Environment Agency: Jeremy Bloomfield, William Todd, Andrew Hunter, Tom
Lester, Nicolas Rowlinson and Peter Marjoram, Ivan Nicholls.
Halcrow: Charles Skelpje.

Associated British Ports Ipswich: Stewart Quantrill

Limitations.
The SFRA is limited to the area within Ipswich Borough Councils administrative
boundary. It is intended for the use of Ipswich Borough Council. Information
contained or used has been gathered from a range of different sources, the
providers of such information should be contacted before making any irreversible
decisions based upon it.

Ipswich Borough Council provides no warranty as to the accuracy, completeness,
or suitability for any purpose of the information contained herein.

Issue & Version List
Date                           Version                To
15 November 2007               6                      IBC web site

SFRA for IPSWICH stage 1ver6                                                Page i
CONTENTS
1      EXECUTIVE SUMMARY .............................................................................1
1.1    Introduction ..................................................................................................1
1.2    Key planning objectives ...............................................................................2
1.3    Conclusions .................................................................................................3
1.4    Recommendations .......................................................................................5
2      LOCATION...................................................................................................8
3      DRAINAGE & FLOOD DEFENCES IN IPSWICH ........................................9
3.1    Main River Gipping and Orwell Estuary .......................................................9
3.2    Wet Dock ...................................................................................................10
3.3    Belstead Brook...........................................................................................10
3.4    Alderman Canal .........................................................................................10
3.5    River Gipping and Orwell & Belstead valley Flood Defences.....................11
3.6    Condition of EA’s Flood Defences .............................................................11
3.7    Mill River – East of Ipswich ........................................................................13
3.8    Westerfield Watercourse............................................................................14
3.9    Other Watercourses, Springs and Land Drainage. ....................................14
3.10     Sewerage System...................................................................................15
3.11     Highway or Railway Drains .....................................................................16
3.12     SUDS and Soakaways............................................................................16
4      HISTORIC FLOODS ..................................................................................17
4.1    Surge Tides................................................................................................17
4.2    Fluvial Flooding..........................................................................................18
4.3    Pluvial or Local “flash” flooding ..................................................................19
5      CLIMATE CHANGE ...................................................................................21
6      SEA LEVELS .............................................................................................22
7      SOURCE PATHWAY RECEPTOR MODEL ..............................................25
8      FLOOD RISK .............................................................................................27
8.1    Introduction ................................................................................................27
8.2    Risk matrix .................................................................................................28
8.3    EA Flood Zones .........................................................................................28
8.4    Assessment of Tidal Flood risk in Zones 2 and 3.......................................29
8.5    Fluvial Flooding – River Gipping ................................................................41
8.6    Fluvial Flooding – Belstead Brook..............................................................44
8.7    Local Flooding from Drainage Systems and Watercourses. ......................44
8.8    Ground Water ............................................................................................46
9      EXISTING DEVELOPMENT ......................................................................48
10     PLANNED DEVELOPMENT ......................................................................49
11     THE SEQUENTIAL AND EXCEPTION TESTS .........................................51

SFRA for IPSWICH stage 1ver6                                                                                    Page ii
11.1      The Sequential test .................................................................................51
11.2      The Exception test ..................................................................................52
12 FLOOD RISK MANAGEMENT - TIDAL & FLUVIAL ..................................54
12.1 Introduction .............................................................................................54
12.2 Long term Strategic Tidal and Fluvial Defences......................................54
12.3 Short-term strategy before main defences are in place. .........................55
12.4 Secondary tidal defences........................................................................55
12.5 Suggested “Strategic Bund” for Wet dock and Village area ....................55
12.6 General Measures for sites in Zone 2/3 ..................................................56
13     FLOOD RISK MANAGEMENT – MINOR WATERCOURSES ...................59
14 FLOODRISK MANAGEMENT – Measures for all Zones ...........................60
14.1 Basements and lowering of ground level ................................................60
14.2 Temporary Barriers .................................................................................60
14.3 Flood Resilient Design ............................................................................61
15 FLOOD RISK MANAGEMENT USING SUDS ...........................................62
15.1 Introduction .............................................................................................62
15.2 Forms of SUDS.......................................................................................63
15.3 Opportunities for Strategic SUDS or Flood risk reduction. ......................64
15.4 Flood storage in Flood Zone3 .................................................................64
15.5 Guidance on SUDS.................................................................................65
16     GUIDANCE FOR FRAS IN SPECIFIC AREAS..........................................66
17     INFORMATION FOR EMERGENCY FLOOD PLAN..................................68
18     REFERENCES ..........................................................................................71

SFRA for IPSWICH stage 1ver6                                                                              Page iii
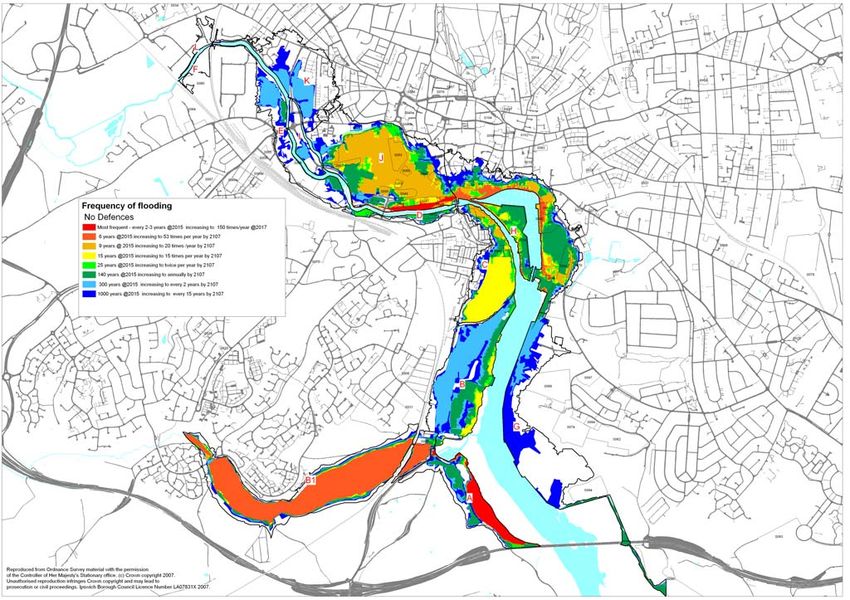
LIST OF APPENDICES

1       GUIDANCE FOR SITE ALLOCATIONS
2       SPEED OF ONSET AND DURATION OF FLOODING
3       ANGLIAN WATER COMMENTS
4       DEMONSTRATION OF NEED TO DEVELOP IN FLOOD ZONE 2/3
5       GUIDANCE ON PRODUCING FLOOD PLANS FOR NEW BUILDINGS

6       PLANS:
6.1     Unsafe Zones, Local Flooding & Watercourses & LDF sites
6.2     Flood storage Facilities Existing & Future needs.
6.3     Ipswich Borough Boundary & Major Watercourses
6.4     Tidal Defences – Structures
6.5     Tidal Defences – Crest Levels
6.6     Tidal Defences – Expected Failure Date
6.7     Geology, General Topography & Minor watercourses
6.8     Trunk Sewers
6.9     Highway and Railway Drains
6.10    1939 Fluvial Flood
6.11    1953 Tidal Flood
6.12    Local flooding – Minor Watercourses and Floodpaths.
6.13    LIDAR Data Survey Dates.
6.14    Ground Level Contours from LIDAR
6.15    Flood Compartments
6.16    Areas Flooded by Overtopping of Existing Defences
6.17    Extent of Tidal flooding (Sequence of flooding) – No Defences.
6.18    Variation in Tidal flood frequency – No Defences.
6.19    Variation in Tidal Flood Hazard or Risk.
6.20    River Gipping – 100-Year Fluvial Flooding with Climate Change.
6.21    Existing Vulnerable Development & Tidal Flood Hazard.
6.22    EA Flood-zone 3, & Brown Field LDF sites
6.23    Areas where Infiltration type SUDS are likely to be possible.

SFRA for IPSWICH stage 1ver6                                             Page iv
1 EXECUTIVE SUMMARY

1.1 Introduction
The Preferred Options Document for the Ipswich Local Development Framework
(LDF) needs to provide for nearly 7,000 additional homes and creation of 18,000
new jobs between now and 2021. Development of brown field sites in the flood
plain will be an essential component.

This assessment follows Planning Policy Statement 25 (PPS25 Dec 2006) and
the “Development and Flood Risk: Practise Guide Companion to PPS25 - Living
Draft” (Feb 2007 reference 20) and relates to development sites suggested for
possible allocation during the Council’s Issues and Options consultation phases
in June 2006 and February 2007.

'The primary aim of the Strategic Flood Risk Assessment is to enable Ipswich
Borough Council to undertake a sequential test approach to flood risk based on
the consequences of flooding on existing and proposed development in high risk
flood areas as part of the preparation of the LDF. The SFRA will also allow
developers and other promoters of development sites to gain a better
understanding of the cost implications of flood risk management' (Environment
Agency)

The Strategic Flood Risk Assessment (SFRA) informs the LDF on what land
uses may be permissible and lists sites broadly in order of increasing flood risk,
to facilitate the sequential test. It is also used to inform the Sustainability
Appraisal (incorporating the SEA Directive) of the Local Development Documents
(LDDs). It also provides necessary information for the exception test.

The SFRA also considers the effects of development on local flooding and minor
watercourses and identifies mitigation measures including sustainable urban
drainage systems (SUDS).

The SFRA is intended to be updated and reissued alongside the submission
documents for the LDF (i.e. the stage after the Preferred Options stage) and, at
that stage, an update will be provided on funding and likely delivery of the
Ipswich Flood defence Strategy.

1.1.1 Ipswich Flood Defences

The existing tidal flood defences are deteriorating and long lengths are expected
to reach the end of their life between 2012 and 2017. Improvements are planned
and “The Environment Agency has received approval, in principle, for the Ipswich
Flood Defence Strategy, which provides for a major flood defence investment in

SFRA for IPSWICH stage 1ver6                                             Page 1 of 72
the form of a barrier in the area of the New Cut, together with some
improvements and repairs to the existing flood defences, however the timetable
for the barrier and other works has yet to be formally approved”.

Funding for the strategy is still being sought at a national level and it may not be
implemented until at least 2018, whilst a precautionary approach is required and
flood risks must be considered over a period of 60 or 100 years. (The expected
life times of commercial or residential development.) The SRFA has therefore
assumed defences fail.

The SFRA suggests policies for flood risk management and possible mitigation
measures that would allow some appropriate development to proceed in advance
of the EA’s flood defence improvements.

1.2    Key planning objectives

PPS25 sets out government policy on development and flood risk. Extracts from
page 2 of PPS25 follow:

The aims of planning policy on development and flood risk are to ensure that flood risk is
taken into account at all stages in the planning process to avoid inappropriate
development in areas at risk of flooding, and to direct development away from areas at
highest risk. Where new development is, exceptionally, necessary in such areas, policy
aims to make it safe without increasing flood risk elsewhere and where possible,
reducing flood risk overall.

Regional planning bodies (RPBs) and local planning authorities (LPAs) should prepare
and implement planning strategies that help to deliver sustainable development by:

             •   Identifying land at risk and the degree of risk of flooding from river,
                 sea and other sources.
             •   Framing policies for the location of development, which avoid flood
                 risk to people and property where possible, and manage any
                 residual risk, taking account of the impacts of climate change.
             •   Reduce flood risk to and from new development through location,
                 layout and design, incorporating sustainable drainage systems
                 (SUDS).
             •   Use opportunities offered by new development to reduce the
                 causes and impacts of flooding.
             •   Only permit development in areas of flood risk when there are no
                 suitable alternative sites in areas of lower flood risk and the benefits
                 of the development outweigh the risks from flooding.
             •   Safeguard land from development that is required for current and
                 future flood management e.g. conveyance and storage of
                 floodwater, and flood defences.

SFRA for IPSWICH stage 1ver6                                                    Page 2 of 72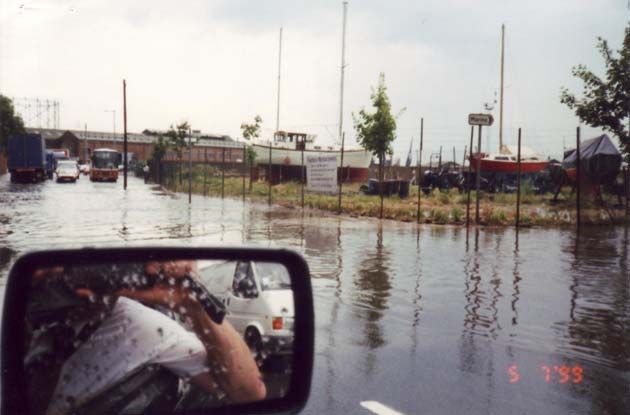
•   Enable decisions on planning applications to be delivered
                 expeditiously.
             •   Ensure spatial planning supports flood risk management and
                 emergency planning.

Annex D of PPS25 describes what land uses may be permissible in various flood
risk zones. Some developments are only permissible if they satisfy the
“exception” test.

1.3    Conclusions

1.3.1 Storm surge tidal flooding is the predominant, but not the sole, flooding
      factor in determining land use allocation; other drainage/flooding related
      factors will also affect development density, layout and form.

1.3.2 For thousands of years sea levels have been rising. During the last few
      hundred years, waterside towns such as Ipswich adapted to the increasing
      flood risk. Buildings were not sited in the lowest areas of Ipswich such as
      the town marsh (Ipswich Village). Over the years waterside commercial
      buildings were built on filled raised land. Street levels were gradually
      raised as they were surfaced and resurfaced. New buildings were built on
      top of more ancient foundations. Residential areas were established uphill
      in safer areas.

1.3.3 Only in the last 100 years have residential properties been built in the
      lowest areas and following the floods of 1953 many of these were
      abandoned to commercial developments. By 2007 active port areas have
      moved to higher safer ground created further down the river leaving the
      now vacant lower lying (brownfield) areas.

1.3.4 The rate of sea level rise is predicted to increase from 4mm/year now to
      15mm/year by 2085. PPS25 requires LPAs to take account of these
      predictions. By 2107 sea levels are predicted to rise by 1.02m. This
      increase does not take account of increased storminess or melting of ice
      shelves resulting from climate change. There is a high degree of
      uncertainty in the predictions and PPS25 requires a precautionary
      approach to be taken.

1.3.5 By 2067, without defences, tidal flooding could occur many times per year
      in parts of the Waterfront and Ipswich Village areas. There would be
      many consequences such as foul sewage flooding, loss of electricity
      supplies and damage to vegetation and infrastructure. Salt floodwater
      could reach a depth of 2 to 3 metres, sufficient to cause deaths and
      injuries. By 2015 the lowest areas will be regarded as “unsafe” if defences

SFRA for IPSWICH stage 1ver6                                              Page 3 of 72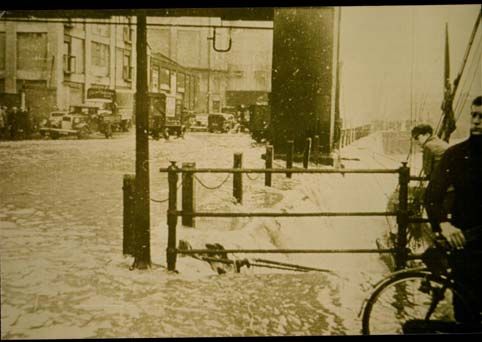
are not maintained. By 2067 the unsafe area would be below 3.8mAOD
        and by 2107 it would be below 4.5mAOD.

1.3.6 The lifetime (100 year) cost of the proposed defence strategy is £70m and
      before about 2107 consideration will need to be given to raising and
      improving defences again. In the future the only way of draining low lying
      areas will be by pumping. Thus flood protection will gradually become
      less sustainable.

1.3.7 Whilst new defences would normally prevent flooding there is a small
      chance they could be overtopped or collapse, resulting in very rapid, deep,
      dangerous flooding. Even with defences, flood risk management /
      mitigation measures are required to make vulnerable forms of
      development safe for people. Such measures vary depending on the type
      of development and may include land raising, raised floor levels and
      raised safe access. The required levels for floors and accesses will
      gradually increase in the future.

1.3.8 Flood risk management measures will affect land uses, the form and
      appearance of the waterfront and village areas as well as development
      costs.

1.3.9 The SFRA includes a table entitled “Guidance for site Allocations” which
      indicates how practicable flood management / mitigation measures may
      be now using colour coding – red showing unlikely or impossible, amber –
      possible but could be expensive. The table highlights in red those sites
      with higher risks. Sites are shown sequentially, broadly in order of
      increasing risk (and mitigation costs).

1.3.10 Residential development (100 year design life) currently appears practical
       on sites around the 4.5m contour where safe access to higher ground is
       available. Similarly such development with a 60-year design life (e.g.
       Hotels) appears acceptable around the 3.8m contour. (See plan in
       Appendix.)

1.3.11 Riverside sites including the island site (S038) are only likely to be suitable
       for residential (more vulnerable) development if “safe” access is provided.
       This is likely to be required even with new defences. One possibility would
       be to provide a “strategic bund” / high-level access road / promenade
       /cycle-route is described in section 12.5. This may also improve the
       appearance and reduce the cost of the EA’s proposed flood defence
       strategy.

1.3.12 If a “strategic bund” was deliverable and very robust and provided a very
       high standard of secondary defence, say 0.1% annual probability level, it
       might enable residential development in the lower areas without raised

SFRA for IPSWICH stage 1ver6                                                 Page 4 of 72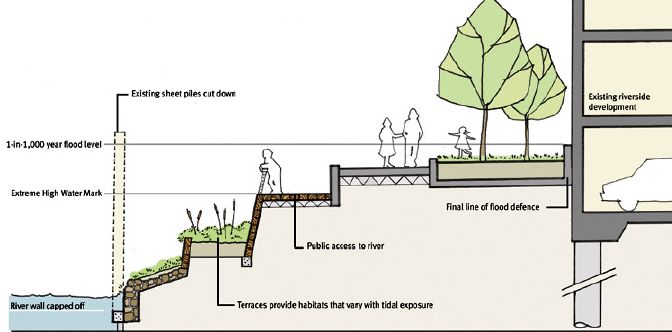
safe access. Such development might even be permissible if the EA’s
        defences were to a higher standard.

1.3.13 Within the central parts of the unsafe zones, mitigation measures, such as
       land raising and forming safe access routes, may be impracticable unless
       they can be undertaken on a large scale. Floor levels would need to be
       typically 1.8m above existing roads. The requirement for floor levels to be
       above the 0.5% annual probability level appear to make even commercial
       “less vulnerable” development challenging. In addition foul sewage
       flooding caused by tidal flooding will occur in areas with ground levels
       circa 2.7m to 3.3m AOD, unless major changes to the sewerage system
       are implemented. Once defences are in place / assured lower floor levels
       would be acceptable for “less Vulnerable” uses on brown field sites in
       Zone 3a.

1.4 Recommendations
Suggested local policies for the LDF, which presume that PPS25 is followed, are
listed below:

1.4.1 Until the EA’s flood defence strategy is assured / implemented, FRAs for
      developments in Zone 2 or 3 must assume there are no defences in place
      and clearly state the frequency of flooding in and around the site.

1.4.2 To pass the exception test, the annual probability of death of an individual
      from flooding in the area surrounding the development must not normally
      be greater 1 in 10,000 during the lifetime of the development. (Estimated
      using “Flood Risks to People Phase 2 FD2312/TR2 Guidance Document
      (reference 17).)

1.4.3 Safe access routes must allow emergency services to access
      developments during flooding. These must be above the 0.5% annual
      probability level in 100 yrs time or 60 years for commercial development.
      Under certain circumstances “wet access routes” may be possible with up
      to 250 mm depth of water – subject to use of building, the design of
      access routes and the speed of floodwater and rapidity of inundation. In
      some exceptional cases, once flood defences are in place / assured
      (standard of protection better than 0.5% annual probability for tidal
      flooding), the need for raised access may be reduced, especially if;
      buildings are unlikely to be occupied during flooding (non residential),
      hazard ratings are low, safe refuges are available and duration of flooding
      short. See para 5.51 Practice Guide Companion to PPS25 (reference 20).

1.4.4 The minimum floor level for businesses should be the predicted 0.5%
      annual probability level 60 years after completion (4.5m AOD for
      development completed in 2007). This will help to ensure insurance can

SFRA for IPSWICH stage 1ver6                                              Page 5 of 72
be obtained in the future. Once defences are in place / assured lower
floor levels may be acceptable for “less Vulnerable” uses on brown field
sites in Zone 3a.
1.4.5 The minimum floor level for residential uses to be the 0.5% annual
probability level 100 years after completion (5.08m for development
completed in 2007), (from Practice Guide Companion to PPS25 (ref 20)
paragraph 5.5).
1.4.6 In areas around the Wet dock and Ipswich Village, where ground levels
are typically 2.7m to 3.8m, the frequency of saltwater and possibly foul
sewage flooding will vary depending on ground level, from several times
per year to every 10 yrs within 60 years. Certain forms of development
should therefore be delayed until adequate flood defences are in place,
when risks to people are regarded as acceptable and development should
be insurable.
1.4.7 Basements or lowered ground levels around buildings will increase flood
risk to people contrary to the aims of PPS25. Basements are particularly
vulnerable to all types of flooding. Basements in zone 1 should only be
permitted subject to adequate FRAs, which must address ground water,
sewer and overland flooding.
1.4.8 Developer contributions towards the cost of inspections and temporary
repair of flood defences should be sought. If possible this should also
cover checking of floor levels under construction and ensuring residents in
high risk areas have adequate flood awareness and are registered with
the Environment Agency’s Flood Warning Direct system (0845 988 1188).
1.4.9 No raising of ground levels should be permitted around the Wet Dock that
would impede surface water flood paths from Bridge Street, Key Street,
Fore Street and Coprolite Street to the Wet Dock.
1.4.10 Paving of gardens or other areas should be controlled – consideration to
be given to article 4 declarations removing permitted development rights in
priority areas. SUDS would be required to drain these wherever
practicable.
1.4.11 Where appropriate the LDF should allocate green corridors along the lines
of watercourses. See plan in appendix.
1.4.12 Space for water / storage for pluvial floodwater needs to be provided in
lowest areas of each of the zone 3 flood compartments. See plan in
Appendix.
SFRA for IPSWICH stage 1ver6 Page 6 of 721.4.13 Planning gain commuted sums should be sought from developments to
contribute towards the Ipswich Flood Defence Strategy.
Other Recommendations:
1.4.14 Discussions should be opened with the Environment Agency’s
Development Control staff and the designers of the flood defence strategy
regarding the feasibility of the “strategic bund,” intended to provide safe
access, improve certain amenity issues and appearance of the riverside
and permit additional residential development.
1.4.15 This report and background data should be made available to emergency
responders. Maps, the main body of the report and GIS mapping used to
produce the SFRA include much information that can be used for
emergency planning purposes, this should also assist emergency services
in commenting on planning applications for development in flood risk
areas.
This Strategic Flood risk Assessment has been produced by the Council’s
Drainage Engineering team.
The Council published this report and the related background data in November
2007. If you have any comments on its contents, the Council would be happy to
receive them by 25 February 2008 – i.e. the same date as for the end of the
consultation period for the LDF Preferred Options
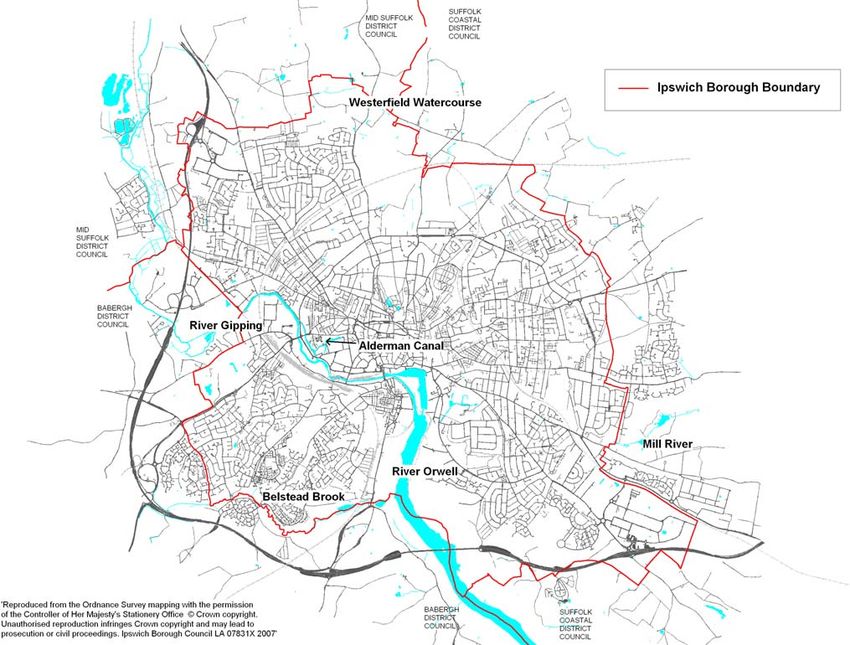
SFRA for IPSWICH stage 1ver6 Page 7 of 722 LOCATION The map shows the area administered by Ipswich Borough Council, the subject of this report. (Repeated at large scale in the appendices.) SFRA for IPSWICH stage 1ver6 Page 8 of 72
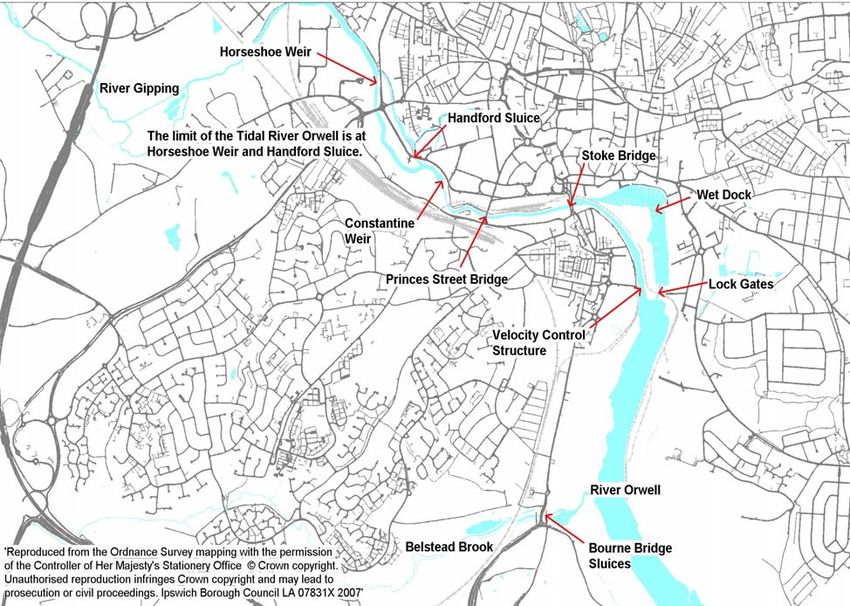
3 DRAINAGE & FLOOD DEFENCES IN IPSWICH

3.1 Main River Gipping and Orwell Estuary
Ipswich is sited where the freshwater River Gipping becomes the tidal River
Orwell. The Orwell Estuary downstream from Ipswich is a wildlife site of
international importance designated SSSI, RAMSAR, SPA and an AONB.

The estuary funnels tidal surges with the result that tidal levels in Ipswich can be
150 mm to 200mm higher than at Harwich.

The catchment of the River Gipping includes the towns of Stowmarket, Needham
Market, Bramford, Claydon and Western parts of Ipswich but is predominantly
rural.

At Horseshoe sluice (Yarmouth Rd) the river divides, with the tidal Orwell on the
West side and the freshwater Gipping on the East side of an island. The island is
defended against tidal flooding but not fluvial flooding. The Gipping spills over
Handford sluice (off West End Road) to join the Orwell.

SFRA for IPSWICH stage 1ver6                                                Page 9 of 72
The active port and docklands area and parts of the urban area adjacent to the
Orwell are low lying and at risk of tidal flooding. Ground levels in the flood risk
zone are typically as low as 2.0m above Ordnance datum (AOD) and high water
spring tide level is about 2.2m AOD. Annually tide levels reach about 3m AOD.
The 1953 flood level was 4.2m AOD. Some areas upstream of Stoke Bridge are
also at risk of fluvial flooding.

3.2 Wet Dock
The Wet Dock, completed in 1840, is connected to the Orwell by a lock. Water
levels are normally maintained at about 1.5m AOD. The Orwell Navigation
Service closes a movable floodgate sited between the lock gates, when the tide
level reaches 2.6m AOD.

The Dock sewer, owned by the Port Authority and skirting the North and East of
the Wet Dock, originally intercepted the polluted water from old culverts and
streets thus keeping the enclosed dock clear of pollution. The Dock sewer has
two outfalls into the Orwell. The Port authority has resisted the connection of
piped drainage systems into the dock and as a consequence the enclosed salt
water in the Dock is of good quality.

However approximately every year or two surface water flooding (resulting from
overloading of piped drainage systems) affects Duke Street, Fore Street, College
Street and Key Street, the lowest roads surrounding the Dock. The floodwater
overflows into the dock, this helps reduce flood levels and consequences.

3.3 Belstead Brook
Belstead Brook (main river) joins the Orwell Estuary at Bourne Bridge to the
South of the town. The catchment is mainly rural but includes Copdock and the
extreme South West of Ipswich. The brook has a mainly undeveloped flood
plain, with three properties known to be at risk of flooding.

3.4 Alderman Canal
The Alderman Canal (ordinary watercourse & Local Nature Reserve) originally
fed water mills at Alderman Rd and Stoke Bridge with flows from the River
Gipping. Circa 1880 the channel downstream of Alderman road was filled in and
replaced with part of the “Low Level trunk sewer”. Apart from a small diameter
penstock, river flows are now prevented from entering the canal by an
embankment across the old channel. There is no known formal outlet. Water is
retained at a high level by another earth embankment (about 3m high) along the
south side of the canal. Any leakage is intercepted by a counter ditch, which
drains the low-lying meadows and playing fields back into the Tidal Orwell at
Constantine Road. The water level in the canal is normally the same as the
River Gipping, however during periods of flood risk the EA close the penstock to

SFRA for IPSWICH stage 1ver6                                              Page 10 of 72
prevent overtopping of the embankment, which has very little, perhaps only
300mm, freeboard in normal conditions.

3.5       River Gipping and Orwell & Belstead valley Flood Defences

The Gipping and Orwell flood defences were last upgraded in a comprehensive
scheme between 1970 and 1983 following the tidal surge that resulted from a
vigorous depression and associated strong winds in 1953. The river channel
was improved and 15 km of flood defence walls and 5 control structures now
exist. These are:

      •    A gate at the Norwich Railway Bridge, which can be dropped to
           temporarily prevent fluvial flows in the Gipping from entering Ipswich.

      •    Horseshoe Weir and Handford sluice at the normal tidal limits – these are
           adjustable and control upstream river levels (& Alderman Canal water
           level if the penstock is open).

      •    The velocity control structure across the Orwell at Bath Street – This can
           be raised to control the risk of scour caused by coincident high fluvial
           flows and low tidal conditions.

      •    Tidal flap valves and an embankment normally prevent tidal waters back
           flowing into the Belstead Brook valley.

      •    The floodgate at the Wet Dock lock gates – a vital but vulnerable part of
           the defences.

The Appendices include a plan showing the main structures.

3.6 Condition of EA’s Flood Defences
The EA’s Flood Defence Management Study Report (June 2005) concluded:

      •    The floodwalls provided varying levels of protection to flooding from surge
           tides along the estuary.

      •    Some of the defence walls are in urgent need of repair and in recent years
           3 short lengths of wall have failed. Some temporary repairs (earth banks)
           were carried out at New Cut East in1996 and 2 more sections of sheet
           piled walls just downstream of Horseshoe sluice were repaired in 2003.
           The report states works to repair the lock flood defence gate mechanism
           were completed in 2003.

SFRA for IPSWICH stage 1ver6                                                  Page 11 of 72
• 882 residential properties and 261 commercial properties were in the
tidal/fluvial flood risk zones adjacent to the Orwell and Gipping. (See
section 9 for most recent figures)
The Appendices include a plan showing the crest levels of the defences. These
were taken from the original design and from National Flood & Coastal Defence
Database.
The EA’s report lists expected failure dates for various sections of defence. See
plan in Appendices.
As a result of the study the EA developed the Ipswich Flood Defence Strategy,
which provides for a major flood defence investment in the form of a barrier in the
area of the New Cut, together with some improvements and repairs to the
existing flood defences which would safeguard defences for the next 100 years.
However the timetable for the barrier and other works has yet to be formally
approved and in reality the barrier may not be implemented before 2018.
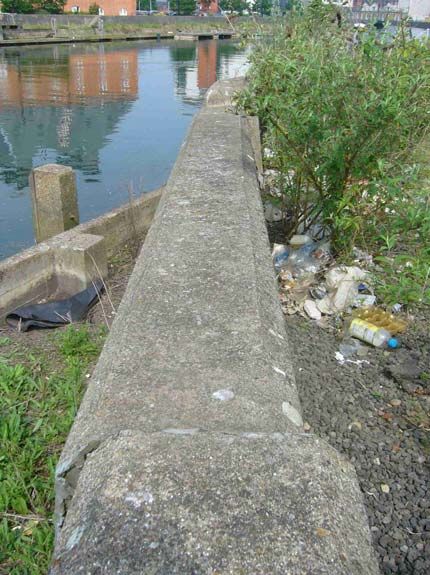
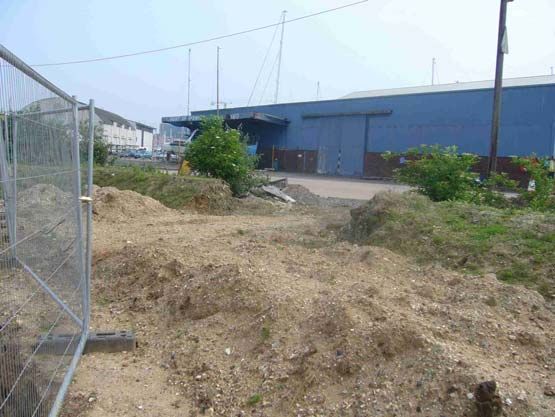
Since the 2005 report further deterioration has occurred indicating that the
expected failure dates shown on the plan may be optimistic:
During March 2007 the section of wall at New Cut East suddenly subsided
following a surge tide of circa 3.2m AOD. For the SFRA it is assumed the
temporary earth bank has a crest level of 3.8m AOD, however on the 13 June
2007 an inspection of defences revealed the temporary earth bank was breached
as work was undertaken behind the wall. By September 2007 it had been
reinstated.
This section of wall is founded on timber piles.
SFRA for IPSWICH stage 1ver6 Page 12 of 72Additionally movement of the defence wall (quoted failure date 2012-2017) further upstream opposite the Steam Boat Tavern was noted. A further section of the concrete defence wall on the West bank just downstream of the Velocity Control Structure, which was not replaced in 1977, is also in poor condition and likely to fail soon. Life expectancy for this section is shown as 2007-2012. There are no known plans to repair this section. Problems were experienced with the movable floodgate at the entrance to the Wet Dock in 2007. Water in the Wet dock overflowed into a construction site at Albion Wharf and almost reached Key Street. The EA are currently spending circa £1M replacing the gate. It’s mechanism was replaced in 2001. It is understood that the design allows for future addition to the structure to increase its height if/when surrounding defences are raised. 3.7 Mill River – East of Ipswich Mill River flows eastwards from the extreme East of Ipswich towards the Deben Estuary. The upstream part in the urban area has been replaced with a surface water sewer, which outfalls into a SSSI wet land area known as Bixley Heath and flows through several ponds at Purdis Heath. The enmained part of Mill River starts downstream of the ponds and flows through a rural area. SFRA for IPSWICH stage 1ver6 Page 13 of 72
3.8 Westerfield Watercourse
This flows westwards from Westerfield village towards the Gipping at Claydon.
Areas of undeveloped land including the Council’s Millennium Cemetery in the
North of Ipswich fall within its catchment.

3.9 Other Watercourses, Springs and Land Drainage.
Due to geological conditions many other smaller watercourses exist. As the town
has been urbanised some have become fragmented, piped or only flow in
exceptional conditions.

During heavy rainfall, runoff and overflow from overloaded or blocked drainage
systems inevitably makes its way towards the minor watercourses and then the
low areas adjacent to the Orwell and Gipping, including the Wet Dock.

Away from the main valley of the Orwell and Gipping the ground rises steeply to
a flattish, predominantly residential, area at about 30-40m AOD. Boulder clay
(diamicton) caps the very highest areas to the north of Ipswich. Below this sands
and gravels overlay London Clay. Many of the minor watercourses are fed by
springs issuing from the base of the sands and gravels. Over time some
watercourses have eroded steep sided tributary valleys cutting into the higher
areas. (A map showing geology, minor watercourses and general topography is
included in appendices with paper copies of this report.)

As Ipswich developed many of these watercourses were used for water supplies,
or culverted where they flowed through streets – towards the Orwell. Examples
are Northgate Street, Lower Brook Street, Spring Road and Upper Orwell Street.

Some watercourses were used to create the ponds in Christchurch Park,
Holywells Park and Chantry Park. Along the eastern boundary of Holywells park,
a canal, with water retained by an earth embankment up to 3m high, originally
fed the Cliff Brewery. This is now drained via an old Anglian Water storm
overflow Sewer to the Orwell. Problems have recently arisen with high water
levels or falling trees threatening to breach the embankment, with leaks flooding
across parking areas in adjacent premises.

Land drainage systems (intended to drain ground water using porous pipes) have
been installed in valley bottoms in several areas to help drain gardens.
Examples can be found at Tuddenham Avenue, Cavendish Street, Ancaster
Road, Gippeswyck Park and Cliff Lane.

Land drains were also incorporated in the main river flood defences – these drain
ground on the land ward side and at intervals these outfall through the sheet
piled walls with flaps intended to prevent reverse flow.

SFRA for IPSWICH stage 1ver6                                           Page 14 of 72
3.10 Sewerage System
About 1880 the Low Level Trunk sewer was installed and tributary sewers were
added as the town grew rapidly. The original system is still in use and carries
foul and surface water runoff from NW and central Ipswich around the Wet Dock
and to the Cliff Quay Waste Water Treatment Works.

A plan in the appendix shows trunk sewers.

In the lowest parts of the town, the Low-level sewer is extremely shallow and
pumping stations were installed to lift foul/combined flows into the sewer, often
with separate surface water systems draining to the estuary by gravity. Flap
valves were intended to prevent reverse flow when tide levels exceed ground
level. In some areas, such as Bath Street and Wherstead Road, oversized pipes
or storage tanks are included to store runoff when rainfall coincides with high
tidal conditions.

By 1939 the system had to be reinforced by the addition of the High Level trunk
sewer constructed on a roughly parallel route to the North of the Low Level
Sewer. This permitted development of the Crofts residential area to the NW of
Ipswich.

Later flows from villages outside Ipswich at Blakenham, Bramford & Claydon
were pumped into the system. Storm-water overflow sewers, from the trunk
sewers to the rivers, were added to relieve flooding. Even so both trunk sewers
flood during severe weather, especially where they cross the tributary valleys.
Flows then route overland along the valleys and watercourses towards the lowest
parts of the town.

Many other sewerage improvements and additions were made as the town
expanded, the most recent being “Project Orwell” a £33M 2.4m diameter tunnel
and a series of pumped tanks which provided further relief and reduced
emissions from the overflow sewers to the river/estuary.

Foul and combined flows from North West and central Ipswich are pumped into
the Cliff Quay wastewater treatment works.

Much of the East of Ipswich drains via combined sewers to either the “Eastern
Area trunk sewer”, built in 1960, or the “South East Area Sewer” built in 1983. As
they enter the Cliff Quay treatment works, large storm overflow structures allow
surplus flows to spill via screens to the Orwell.

There are now some 40 major outfalls through the flood defence walls into the
Orwell or Gipping. Most have flap valves intended to prevent reverse flow and
tidal flooding. Some of these are very large: - twin 2.7 m square flap valves at
Stoke Bridge and two pairs of 2.4m diameter flaps at Toller Rd.

SFRA for IPSWICH stage 1ver6                                             Page 15 of 72
The Anglian Water system in Ipswich now includes 15 pumping stations, a further
4 pumped tanks, at least 6 attenuation tanks and an open attenuation pond at
Ransomes Europark. The sewerage system serving NW and central Ipswich is
therefore complex.

Anglian Water (AW) has an “Infoworks” computer model to enable them to
understand the operation of the sewer network and model possible improvement
schemes in detail.

Much of the Chantry area, south of the river, is served by separate foul and
surface water sewerage systems. Surface water systems drain to Belstead
Brook. Foul sewage is drained by gravity to Chantry wastewater treatment works.
AW is currently developing a model for parts of this area.

3.11 Highway or Railway Drains

In a few areas of Ipswich, highway or railway drains discharge to watercourses;
in other areas private systems serve large areas. In the Dales Road area the
railway, in cutting, is thought to drain rural runoff from fields East of Henley Road
towards Norwich Road.

Highway or railway drains are unlikely to be shown on AW’s sewer maps. Some
have been mapped – see plan in appendices.

3.12 SUDS and Soakaways

As a result of policy changes during the last few years (PPG25, the Ipswich
Drainage and Flood Defence Policy & Building regulations), SUDS, soakaways
or attenuation systems have been increasingly used to reduce adverse impacts
on watercourses and the sewerage network. Examples of this are at the Park
and Ride and Anglia Parkway sites North of Bury Rd and St Mary’s Convent.
Areas of the town served by such systems are recorded by IBC.

In parts of Ipswich, soakaways are used for surface water drainage; these are
normally the property owners’ responsibility. However some 60 soakaways,
adopted by the Highway Authority, are known to exist and have been mapped,
(see plan in appendices) others probably exist. During the past few years many
of the older ones, installed circa 1950-1970, have been found to be totally
inadequate and several have been replaced/enlarged.

Ravenswood, a 1200 home development currently under construction, uses
landscaped infiltration basins and soakaways for surface water drainage - all
designed to protect homes from a 1 in 100 year rainfall event. These features do
not affect the springs and watercourses in Braziers Wood.

SFRA for IPSWICH stage 1ver6                                                Page 16 of 72
Some recent developments, located in low areas, where attenuation storage has
been installed, have suffered from flooding because surcharging of the sewerage
system prevents discharge at the designed rates. AW typically specifies an
allowable discharge and designers erroneously assume the sewer has capacity,
for that discharge rate, without surcharging.

Other recent developments have included low-level basement car parking or
buildings below water levels (surcharge levels) that commonly occur in adjacent
sewers. Some of these are situated in flood risk zones. Private pumping
systems are increasingly being used in an effort to avoid flooding of such low
areas.

4 HISTORIC FLOODS

4.1 Surge Tides
Tidal flooding (or storm surges) are caused by weather patterns and will be worst
when combined with a spring tide. Water levels in the North Sea are raised
when atmospheric pressure is low over the North Sea and high over the Atlantic.
Previous severe tidal flooding has been accompanied/caused by hurricane force
winds.

Storm surges have caused tidal flooding in East Anglia on many occasions. A
quick search (reference 7) indicated major surge tides occurred in 1236, 1287,
1613, 1619, 1762, 1894,1904,1905, 1927/8, & 1938. These would not have
caused great damage because the town’s marshes were not built on. The
following plan shows areas of land lower than 3.3m AOD mapped against the
town at 1879.

SFRA for IPSWICH stage 1ver6                                            Page 17 of 72
The most recent serious flood was in 1953:

2,500 people died in Northern Europe and the East coast of England. Thousands
were made homeless.

40 people died at Felixstowe where homes where destroyed. No deaths
occurred in Ipswich but the flood affected residential properties in the Bath Street
area (these were subsequently demolished) and power and gas supplies failed.

Flood defences built between 1971 and 1983 saved the town from serious surge
tide flooding on 2/3 January 1976, 11/12 January 1978 and 1 February 1983.
(Reference dated 1987).

4.2 Fluvial Flooding
The most recent severe fluvial events were in 1947 and 1939. These were partly
caused by flood debris that obstructed the old “Seven Arches Bridge” at London
Road. The current replacement bridge is single span and no longer obstructs the
flow.

It appears that during these events, floodwater followed the original path of the
River Gipping before it was filled in 1882, through the “Ipswich Village” area, and
spilled across Bridge Street into the Wet Dock at Albion Wharf. Floodwater was
reported to be five feet deep in Princes Street and cars were swept away.

Contemporary paper record plans showing the 1939 and 1953 floods on relevant
OS survey background have been digitised and are reproduced in the
Appendices.

1939 Floodwater from river Gipping spilling into wet dock at Albion Wharf

SFRA for IPSWICH stage 1ver6                                              Page 18 of 72
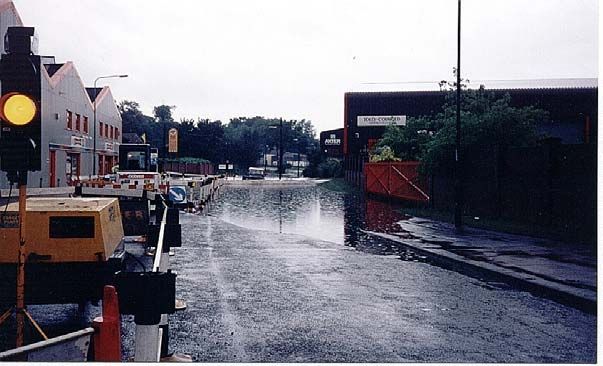
1939 Floodwater in Princes Street

4.3 Pluvial or Local “flash” flooding
This currently occurs much more frequently than tidal or fluvial floods, generally
with relatively low consequences, however repeated flooding can cause much
distress and expense, especially where floodwater (often with sewage) enters or
comes close to entering homes

Ipswich is unusual in having about 30 years of detailed records of local flooding
resulting from heavy rainfall, not attributed to overtopping of river or tidal
defences. Such flooding results from surface runoff, overloading of soakaways,
SUDS, piped systems, ordinary watercourses (ditches, streams or valley
bottoms) or ground water.

As the town grew and more surfaces were paved, runoff increased. Flooding
resulted and was often subsequently alleviated by drainage improvements. Thus
the oldest records are unlikely to be of much significance. However, stubborn
problems remain as shown on a map included in the appendices. (Local
Flooding with Watercourses and Floodpaths).

Currently the most serious problems are at: Lovetofts Drive, Daimler Close,
Swinburne Rd, Norwich Rd, Coltsfoot Road, Monton Rise, Bridgewater Rd,
Ellenbrook Rd, Bixley Rd, Hadleigh Rd, Holywells Rd, Duke Street, Maidenhall.

IBC have many photos of such flooding, such as the following, included to
illustrate some relevant problems.

SFRA for IPSWICH stage 1ver6                                             Page 19 of 72
Holywells Road – floods several times per year.

Duke Street – water level just below floor level of shop, water is overflowing into
Wet Dock – this restricts flood depth.

Major newsworthy flooding events occurred on 22 occasions between 1976 and
2007.

SFRA for IPSWICH stage 1ver6                                               Page 20 of 72
5 CLIMATE CHANGE
For the assessment of impacts of climate change on flooding from land and
rivers the increases listed in table B.2 of PPS25 are used, see below.

PPS25 Annex E2 sates “…The future users of the development must not be
placed in danger from flood hazards and should remain safe throughout the
lifetime of the plan or proposed development and land use.”

The Practice Guide Companion to PPS25 states in section 2.9 “For individual
developments, an appropriate allowance should be included over the lifetime of
each development in question. Developers should therefore carefully consider,
and advise those undertaking the Flood Risk Assessment, on what the design life
of the development is. The assessor can consider the implications of climate
change for this period using the precautionary allowances and indicative
sensitivity ranges in Tables 2.1 and 2.2.”

Environment Agency internal policy (2007) defines design life of residential and
commercial development as100 and 60 years respectively.

SFRA for IPSWICH stage 1ver6                                            Page 21 of 72
6 SEA LEVELS
For the assessment of impacts of sea level rise on flooding from the estuary the
increases listed in table B.1 of PPS25 are used, see below.

The allowance includes for the effect of land sinking. Note sea levels have been
rising for the last few thousand years.

In PPG25 the allowance for sea level rise was 600mm over the next 100 years.
The new PPS25 allowance amounts to just over 1m as shown on the following
graph.

                                                Rise in Sea Level

                                1.4
  Addition to 2003 levels (m)

                                1.2

                                 1

                                0.8

                                0.6

                                0.4

                                0.2

                                 0
                                  2000   2020   2040      2060      2080   2100
                                                         Year

The EA have confirmed that the extreme levels to be used for FRA’s (in Ipswich
only) are those recommended in Haskoning’s 2007 report on Extreme Tide levels
for the coast between Norfolk and Essex. These tide levels are typically 200mm
lower than those used in the 2005 EA Flood defence management Strategy
study.

The Environment Agency’s internal policy (2007) defines design life of residential
and commercial development as100 and 60 years respectively.

The base levels (m AOD) used in this assessment are assumed to be at 2006.

SFRA for IPSWICH stage 1ver6                                                      Page 22 of 72
Predictions for extreme levels at 2007, 2067 and 2107 for various return periods
are shown in the table below:
(Return periods are a way of describing average frequency of occurrence. The
annual probability or chance of a 2-year return period sea level is 50%. The
annual probability of a 100-year return-period event is 1%, Note a 100-year event
is unlikely to occur precisely every 100 years.)
Allowance for sea level rise 0.004 0.475 1.021
Year 2007 2067 2107
Return Period (years) Tide level(m AOD) @New Cut
0.07 2.45 2.92 3.46
2.00 3.00 3.48 4.02
5.00 3.22 3.70 4.24
10.00 3.38 3.86 4.40
20.00 3.53 4.01 4.55
50.00 3.74 4.22 4.76
100.00 3.90 4.38 4.92
200.00 4.06 4.54 5.08
300.00 4.15 4.63 5.17
500.00 4.27 4.75 5.29
1000.00 4.43 4.91 5.45
These extreme levels will change in the future as sea levels rise, and the results
of further research become available. These levels will be reviewed by the EA
and could increase. If critical these should be checked with the EA.
The following graph illustrates how the rising sea levels will dramatically increase
frequency of flooding.
Effect of sea level rise
6.0
Tide Level @Ipswich (m AOD)
5.0
4.0 2007
2067
2107
3.0
Ex. Defence typical crest
level
Bridge Street GL
2.0
0 100 200 300 400 500 600 700 800 900 1000
Return period (Years)
SFRA for IPSWICH stage 1ver6 Page 23 of 72Rising sea levels will affect normal daily tide levels without the effect of surges:
Year HW NT HW ST LW NT
2007 1.45 2.443 -0.87 m AOD
2007 1.454 2.447 -0.866 m AOD
2067 1.925 2.918 -0.395 m AOD
2107 2.471 3.464 0.151 m AOD
Freq reached/year 15
HWNT – High Water Neap Tide
HWST – High Water Spring Tide
LWNT – Low Water Neap Tide
SFRA for IPSWICH stage 1ver6 Page 24 of 727 SOURCE PATHWAY RECEPTOR MODEL
Based on historical flooding and first hand local experience, the following table
summarises flooding, sources and how it is assessed later in this report.
Source Pathway Receptor Scale of Comment Assessment in SFRA
Consequences
Tidal/Fluvial Breach, Many Very High, Potentially Informed by analysis
Flooding from overtopping of Properties in very large undertaken for the EA’s flood
the Gipping existing flood Flood number of defence study for Ipswich, plus
or Tidal defences compartments properties detailed flood mapping based
Orwell involved and on LIDAR, presented as a
significant risk series of maps showing areas
to people. at risk at various tide
levels/probabilities.
Information Plans show condition and
available to crest levels for defences.
undertake Maps indicate variations in
analyses. hazard, frequency and risk.
Duration and speed of onset
from simple spreadsheet flood
compartment models
Tidal/Fluvial Leaking flap Low spots in Low but salt water Backflow Informed by records of
Flooding from valves on Flood has potential to normally flooding. Penstocks fitted at
the Gipping drainage compartments damage football pitch limited to short largest sites may be used if
or Tidal outfalls – trees and green periods. flaps fail.
Orwell some are spaces. Ground level contour map
2.7m square shows lowest areas that are
most at risk.
River Gipping Breach, Many Medium to High Large number Informed by the EA’s defence
or Fluvial overtopping of Properties of properties at study and 2006 ISIS modelling
Flooding fluvial situated in the low risk. Risk
defences Fluvial to people. Map shows area at 1% annual
Over bank Floodplain Large probability risk of fluvial
flooding consequences flooding if defences fail.
where
standard of
protection is
low.
Tidal or Overtopping 3 properties, Very low tidal Tidal flooding informed by
fluvial of tidal meadows, defence at simple spreadsheet model.
flooding from defences at parkland Bourne Sluice. Fluvial flooding by HECRAS
Belstead Bourne model (2003).
Brook Bridge. Or
overloading of Limited assessment –no LDF
channel. sites. Tidal flooding
predominant.
Green open Watercourses, Properties & Generally Low but Informed by records of
spaces valley floors highways in flooding. Flood-paths &
local flood risk Med-high for watercourses shown on map.
areas and basements
Flood
compartments
Ordinary Failure of Properties & Medium Small no of No detailed assessment of
Watercourse embankments highways in properties, embankments.
s – Alderman local flood risk earth
Canal or areas and embankments
Holywells park Flood 2-3m high with
compartments trees.
SFRA for IPSWICH stage 1ver6 Page 25 of 72Source Pathway Receptor Scale of Comment Assessment in SFRA
Consequences
Ordinary Blockage, or Properties and Low Watercourses including major
Watercourse flows highways. flood paths are recorded by
s exceeding IBC and are shown in
channel Appendices
pipe/culvert
capacity
Sewerage Drains: Properties & Low Surface water Informed by records - IBC
system, blockage, highways in flooding is a have Databases and maps
private flows local flood risk High for basements complex and showing “local flood risk areas”
drainage exceeding areas and variable issue.
systems, pipe/culvert Flood Detailed Anglian Water have Info
watercourses capacity. compartments. assessment is Works sewerage models
Wet Dock required at a
Failure of local level to
pumps or quantify the
blocked outfall risk. Mapped
grilles, flap by IBC
valves etc & Limited
penstocks available
(Toller Rd information to
Tunnel) assess risk in
more detail.
Groundwater High Parkland & Low Limited Informed by records. Spring
Flooding groundwater properties in number of lines may be inferred from
levels, springs low lying properties BGS map,
and blocked areas, civil involved at
land drainage infrastructure present.
Human error Lock gates at Flood High Large number Failure appears to have
operating Wet Dock, compartments of properties at recently occurred… new
movable tidal Sluice valve - Wet Dock, risk. Risk to mechanism installed 2001 and
flood Alderman Island site and people. gates being installed 2007/8
defences Canal/R Ipswich Village
Gipping
SFRA for IPSWICH stage 1ver6 Page 26 of 728 FLOOD RISK 8.1 Introduction Flood risk is a product of ‘probability’ and ‘consequence’. It takes into account the consequences, i.e. death and injury, damage to property and businesses. Probability, frequency or return period are ways of describing how often flooding will occur. Very frequent flooding that causes slight damage would be low risk. In situations where a relatively high standard of flood protection is enjoyed, such as London, the probability of flooding due to overtopping of defences is relatively low, but the consequences, if flooding did occur, are very high. Since 1977 defences have protected Ipswich from many surge tides and very few people can remember when flooding last occurred. However the risk of flooding is dramatically increasing as defences corrode, rot and fail. Ongoing sea level rises and predicted increasing rainfall will also gradually increase risks. Even where defences are not about to fail there will be “residual risks” which arise from the possibility of overtopping or collapse of defences, failure of sluices/gates etc. These risks will be highest where fast moving or deep floodwater could rapidly inundate and damage areas posing a high risk of death / injury. The idea that there is a significant “residual risk” even though defences are in place is difficult to explain to non-specialists, especially in situations when wide scale flooding has not been experienced in recent times. In such situations it is easy to become complacent and ignore the certainty that flooding will occur. When it does consequences will be more severe than for communities with awareness of flood risk. SFRA for IPSWICH stage 1ver6 Page 27 of 72
8.2 Risk matrix
The matrix illustrates how risks depend on the combination of frequency and
consequences.

H =High, M=Medium, L=Low, N=Negligible risk
                                Flood Probability
                               Likely        Infrequent   Possible   Remote
                               >4%           4% - 1%      1 - 0.1%
For areas likely to suffer fluvial flooding, zone 2 has a 1% - 0.1% probability of
flooding in any year and Zone 3 >1% probability in any year.
PPS25 subdivides zone 3 into zone 3a and zone 3b – “functional floodplain”
where raising ground levels or obstructions would worsen flooding. For Ipswich
the floodplain of Belstead Brook and the Gipping upstream of the Norwich
railway should be regarded as functional.
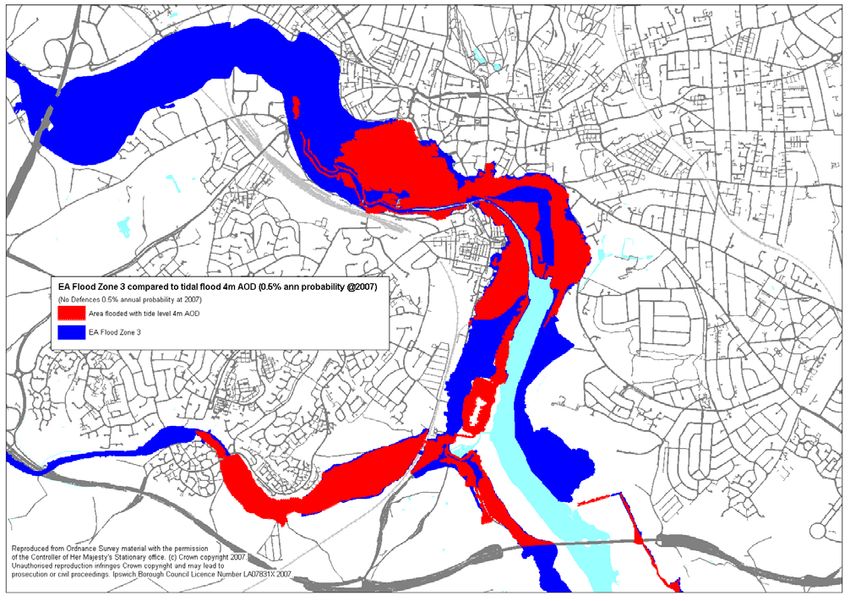
The EA maps are “indicative” and do not show “islands” within these zones that
may not flood. They do not show how risks vary within the zones.
At the lowest points in zone 3 the probability of flooding is much higher than
0.5%.
In the past FRA’s have erroneously (or ambiguously) indicated that sites are at
risk of flooding in a 0.5% probability event simply because it is within Zone 3,
whereas the probability is really much higher.
This SFRA therefore provides mapping which will readily enable the probability
and risk of flooding to be determined at a particular point.
8.4 Assessment of Tidal Flood risk in Zones 2 and 3
8.4.1 Methodology
The Environment Agency’s “Ipswich Flood Defence Management Strategy –
Hydraulic Modelling – Draft Model Report (Nov 2003)” subdivides Zones 2 & 3
into 14 compartments. These are shallow basins, which could fill with floodwater
to a threshold level before overflowing into adjacent compartment(s). Ground
levels, roads or bridge embankments govern the threshold levels.
Assumptions are made relating to coincident tidal surges and fluvial events, as
there is no correlation between surge tides and fluvial flooding: -
• Surge tides are assumed to have triangular distribution acting over
a 30-hour period with the peak coincident with high tide and a
fluvial flow of 10 cubic metres per second.
• Fluvial flows were modelled but flooding was found to be tidally
dominant in all but the furthest upstream compartments.
The report effectively provides flood levels for all compartments except the
Belstead Valley (B2) for a range of estuary tide levels: - with existing defences,
with failed defences and with proposed flood defences.
SFRA for IPSWICH stage 1ver6 Page 29 of 72You can also read


