ISLE OF MAN FUTURE ENERGY SCENARIOS - Supporting Background Information
←
→
Page content transcription
If your browser does not render page correctly, please read the page content below
t

       ISLE OF MAN
     FUTURE ENERGY
        SCENARIOS
       Supporting Background
            Information

    GD 2021/0250 - Appendix 4 of Consultation on the
    outline and principles for the first statutory Climate
    Change Plan 2022-2027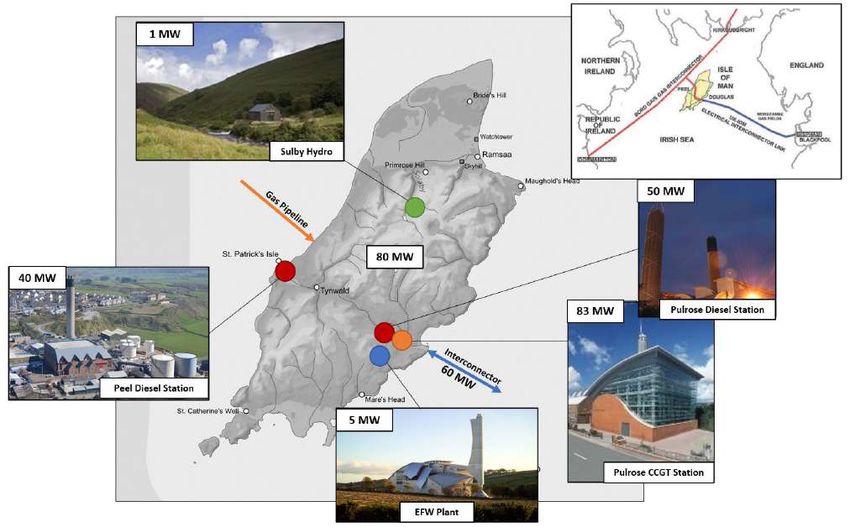
EXECUTIVE SUMMARY
In December 2020, the Isle of Man Government launched its Future Energy Scenarios Strategy to determine the
pathways to meet the following:

                 TO ENSURE 75% OF THE ISLAND’S ELECTRICITY IS GENERATED FROM RENEWABLE SOURCES BY 2035 AND TO
                                                                             DELIVER NET ZERO EMISSIONS BY 2050

Electricity generation is responsible for approximately 33% of all greenhouse gas emissions on the Isle of Man, and a
majority of this is currently sourced from fossil fuels (natural gas). Without the decarbonisation1 of electricity, it will
not be possible to reduce carbon emissions significantly in other areas such as heating and transport.

FUTURE ENERGY SCENARIO OPTIONS
An independent international engineering and consultancy firm, Ove Arup, was appointed to prepare future energy
scenarios to provide:

        •      The most cost-effective pathway to achieve Government emission targets.
        •      Pathways which balanced of security of supply, low cost to consumers, and the environment.

Arup were assisted by a technical team consisting of representatives from the Climate Change Transformation Team,
DEFA, DfE, Manx Utilities, Treasury and DOI. Independent, technical and economic modelling was then carried out to
create five future scenarios for electricity generation, which show how these targets can be achieved.

ESTIMATED FUTURE COST PER HOUSEHOLDS

The first three scenarios (Scenarios 1 – 3) all feature interconnectors2, biomass3 generation and varying amounts of
small-scale solar and wind generators. These are the most cost-effective solutions for the residents on the island.
The two final scenarios (Scenarios 4 and 5) also feature interconnectors, but include a much higher proportion of on
island generators and storage facilities, which result in higher costs to residents.

The following table summarises the estimated costs to households on the island compared to the current average
cost of electricity per household, as calculated from Ove Arup’s evaluation of cost over the life-span of each scenario:

                                  Continued use of Gas                         Scenario 1                Scenario 2   Scenario 3   Scenario 4   Scenario 5
                                     Infrastructure
                                          2050                                      2050                   2050         2050         2050          2050
     Total Cost of
                                                1.3bn                             1.49bn                   1.4bn       1.07bn        1.8bn      4.5 – 6.1bn
     scenario (£)
     Cost per
     household                                   996                                1142                   1073          820         1379       3450 - 4700
     per year (£)
                                                                       Source: Ove Arup and Manx Utilities

Regardless of whether the island deviates from using natural gas to generate electricity, significant investment will
still be required, with existing stations requiring replacement in the next ten – fifteen years. An illustrative cost of
this is also shown in the table above. The current cost per household is £645 but does not include road fuel costs or
heating costs, whereas the other options do, via the predicted electrification of vehicles and heating.
1.    Decarbonisation: reduction of carbon (which makes up a majority of the greenhouse gas emissions)
2.    Interconnectors: high voltage cables that are used to connect different transmission networks
3.    Biomass: plant or animal material used as fuel to produce electricity or heat

                                                                                                                                                  1|Page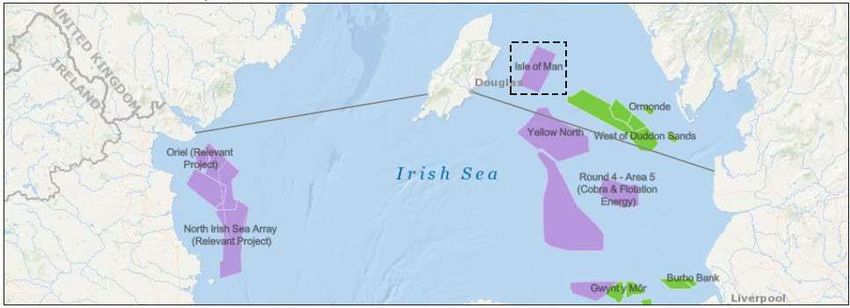
SCENARIO 3 IS THE MOST COST-EFFECTIVE SOLUTION OF ALL POSSIBLE FUTURE SCENARIOS; IT IS EVEN
         COST-EFFECTIVE WHEN COMPARED TO SCENARIOS THAT CONTINUE TO USE FOSSIL FUELS. SCENARIO 1
         AND SCENARIO 2 ARE OF SIMILAR COSTS TO SCENARIOS WHICH CONTINUE TO USE FOSSIL FUELS.
         PATHWAYS TO ACHIEVE NET ZERO BY 2050 ARE THEREFORE FEASIBLE.

These total costs for the scenario illustrated in the table above, could be funded by the Government, or Private
sector companies, or a combination of both. Regardless of which funding solution is used, the projects are
ultimately paid for by the residents of the Isle of Man either through taxes or through electricity bills.

MAINTAINING SECURITY OF SUPPLY

Balancing the Isle of Man’s electricity network requires stabilising power; this cannot be provided from sources which
are reliant on the weather to produce electricity as these sources cannot be guaranteed at all times. In all scenarios
the most cost-effective solution of providing this stabilising power is a new interconnector to the UK. Regardless
of which future energy scenario is identified as the best pathway to net zero, an interconnector will be required; it is
therefore a no regret solution.

                 OVE ARUP’S ANALYSIS HAS SHOWN THAT IMPORTING THIS RENEWABLE ENERGY FROM GB IS ALSO MORE
                  COST-EFFECTIVE THAN GENERATING POWER ON ISLAND FROM INTERMITTENT RENEWABLES. ON-ISLAND
                       RENEWABLE BIOMASS GENERATION HOWEVER, CAN HELP TO MAINTAIN AFFORDABLE ELECTRICITY.

The UK is rapidly increasing its capacity for large-scale renewables, in particular offshore wind and solar energy. By
2025, GB will have an excess capacity of offshore wind and will become a net exporter of electricity.

It is clear that a net zero future for electricity can be achieved in a cost-effective manner. Enabling this transition will
first require substantial work to upgrade the existing infrastructure to accommodate carbon neutral technology. Such
projects can involve significant planning and fairly long construction time-scales. The UK for example, started its
transition to net zero over thirty years ago. This means that in the short-term, emissions reductions will not come
from on-island generation.

             LARGE INFRASTRUCTURE PROJECTS TAKE 5-10 YEARS, IMMEDIATE REDUCTIONS WITHIN 5 YEARS
             ARE ONLY POSSIBLE FROM IMPORTING POWER

This document provides further details on these future scenarios and the scope of the work involved to produce
these. Commentary is also provided on possible economic opportunities for the Island following on from this piece
of work.

A consultation with members of the public and key stakeholders on the scenarios mentioned above will take place
over the summer, as part of the 5 Year Climate Change Plan. A decision on preferred pathway as a result of this
consultation will follow the publication of this plan in February 2022.

    4.   Stabilising power: a balanced combination of baseload (see page 12) and dispatchable generation (see page 13) of power supply, to ensure sufficient minimum stable power supply at all times, as
         well as supply to meet demand.

                                                                                                                                                                                        2|Page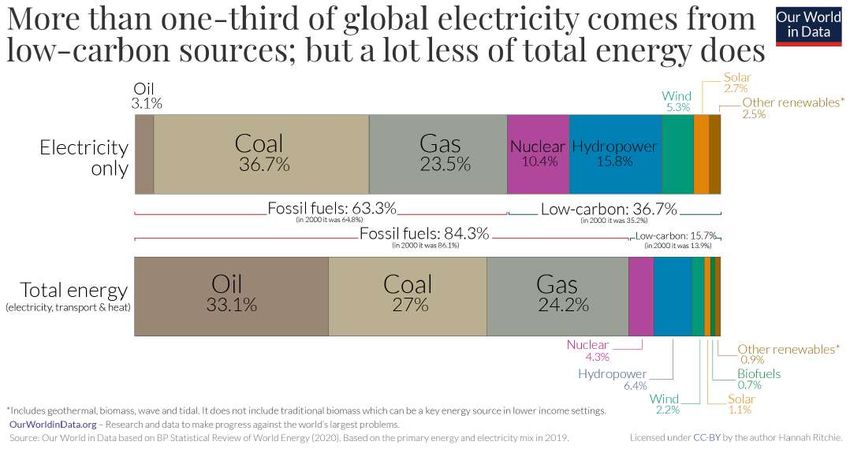
Contents
Introduction ................................................................................................................................................................... 5
       Fig. 1 – Electricity Emissions (Aether, 2019 Update) .............................................................................................. 5
   Climate Targets and Emissions ................................................................................................................................... 5
   The Challenge for 2050 ............................................................................................................................................... 5
       Fig. 2 – Peak Demand Projections .......................................................................................................................... 6
       Fig. 3 – The Energy Trilemma ................................................................................................................................. 6
Electricity Generation .................................................................................................................................................... 7
       Fig. 4 – Global Energy Generation by Source ......................................................................................................... 7
   Fossil fuels................................................................................................................................................................... 7
   Renewable Energy ...................................................................................................................................................... 8
   Carbon Neutral Energy ............................................................................................................................................... 8
Existing Generation on the Isle of Man ......................................................................................................................... 9
       Fig. 5 – Map of Generation Units on the Isle of Man ............................................................................................. 9
   Current Generation Mix and Retirement of Assets .................................................................................................... 9
       Pulrose CCGT .......................................................................................................................................................... 9
       Peel and D-Station Diesels .................................................................................................................................... 10
       AC interconnector................................................................................................................................................. 10
       EFW Plant.............................................................................................................................................................. 10
       Sulby Hydro ........................................................................................................................................................... 11
   Island demand and security of supply ...................................................................................................................... 11
Network Stability ......................................................................................................................................................... 12
       Fig. 6 – Graph Showing Island Demand Profile for December 21st 2019.............................................................. 12
   Baseload Generation ................................................................................................................................................ 12
   dispatchable Generation .......................................................................................................................................... 12
   Intermittent Renewables .......................................................................................................................................... 13
   Storage ...................................................................................................................................................................... 13
The UK Solution ........................................................................................................................................................... 14
       Fig. 7 – Chart Showing UK Electricity Mix – 2019 ................................................................................................. 14
       Fig. 8 – Graph Showing UK Emissions Reduction 1990 - 2018 ............................................................................. 14
   UK Future Generation ............................................................................................................................................... 15
       Fig. 9 – Map Showing Planned Offshore Windfarm Developments (England, Wales, NI) ................................. 145
       Fig. 10 – Map Showing Planned Offshore Windfarm Developments – Irish Sea.................................................. 14
       Fig. 11 – Map Showing Current Operational and Commissioning Interconnectors ............................................. 14
Isle of Man Future Electricity Supply .......................................................................................................................... 14
   Future Energy Scenarios ........................................................................................................................................... 17
       Fig. 12 – Scenario 1 ............................................................................................................................................... 14

                                                                                                                                                                  3|Page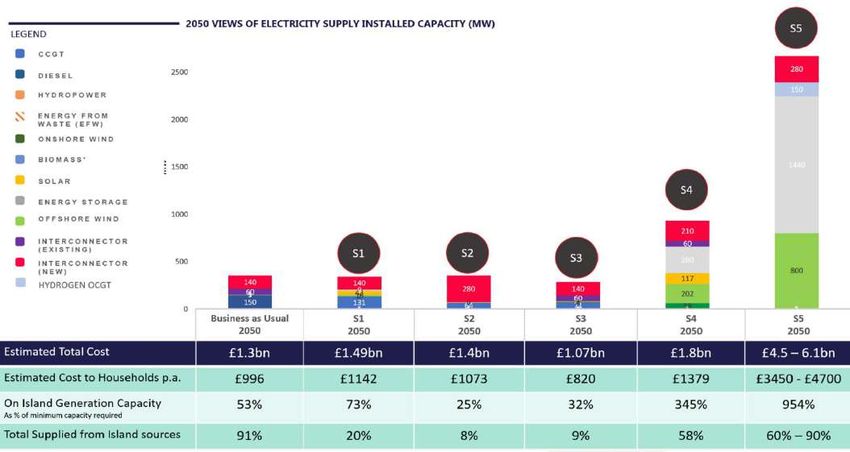
Contents
       Fig. 13 – Scenario 2 ............................................................................................................................................... 14
       Fig. 14 – Scenario 3 ............................................................................................................................................... 14
  Additional Scenarios .................................................................................................................................................. 14
       Fig. 15 – Scenario 4 ............................................................................................................................................... 20
       Fig. 16 – Scenario 5 ............................................................................................................................................... 21
  Continued use of Natural Gas .................................................................................................................................... 22
       Fig. 17 – Retirement of Existing Plant ................................................................................................................... 22
  Summary .................................................................................................................................................................... 22
       Fig. 18 – Costs ....................................................................................................................................................... 23
   Funding ..................................................................................................................................................................... 23
   Independence ........................................................................................................................................................... 24
   Resiliance .................................................................................................................................................................. 24
   Emissions Reduction Pathways over Next 5 Years ................................................................................................... 24
Economic Opportunities...................................................................................................................................... 25
       Intermittent Renewables ...................................................................................................................................... 25
       Dispatchable Generation ...................................................................................................................................... 26
       Baseload Generation............................................................................................................................................. 26
  Innovation – Demand Shifting ................................................................................................................................... 26
       Storage .................................................................................................................................................................. 26
       Smart Grids and Appliances .................................................................................................................................. 26
  Biomass Growth ......................................................................................................................................................... 27
The Next Steps ............................................................................................................................................................ 28
       Short-Term Emissions Reductions ........................................................................................................................ 28
       No-Regret Decision ............................................................................................................................................... 28

  Appendix 1 – The Climate Change Bill and Consideration for Future Energy Scenarios ........................................... 29
  Appendix 2 – Explanatory Note on Estimated Tariffs ................................................................................................ 30
  Appendix 3 – Manx Utilities Charges Review 2021 – 22 ............................................................................................ 31
  Appendix 4 – Ove Arup Future Energy Scenarios Executive Summary ..................................................................... 32
  Appendix 5 – Ove Arup Future Energy Scenarios Report ......................................................................................... 33

                                                                                                                                                                   4|Page
INTRODUCTION
NET ZERO AMBITIONS
The Isle of Man Government has committed to two ambitious targets for Electricity generation in support of the
Climate Change Transition:

    1) Securing no less than 75% of the Island’s electricity from renewable sources by 2035
    2) Net zero emissions from electricity generation by 2050.

FIG. 1 – ELECTRICITY EMISSIONS (1990 – 2019)

                             Source: Isle of Man Greenhouse Gas Inventory 1990 – 2019

CLIMATE TARGETS AND EMISSIONS

Electricity is possibly the most important sector to decarbonise as the decarbonisation of other sectors (especially
heating and transport) is dependent on this sector. As the uptake for electric heating and electric vehicles
increases, the electricity sector will have to grow to meet future demand.

The majority of the Isle of Man’s electricity is currently sourced from fossil fuels. The interconnector is a source of
carbon neutral electricity on island and also provides a route to export electricity to the GB Market. While UK Gas
stations are larger and more efficient than island-based fossil fuel stations, exports to GB are still viable due to the
differences in legislation between UK and IOM (e.g. Clean Air Act, Carbon Tax), which means it is often cheaper to
generate electricity from fossil fuels on island, compared to GB. Emissions from these exports are attributed to the
Isle of Man’s Greenhouse Gas Inventory. With the GB Market becoming increasingly short of stable generation to
help balance its renewables, there is greater opportunity to export this stable power there is greater opportunity to
export this stable power if capacity allows. Consequently, emissions in this sector are increasing as other sectors
decarbonise and electrify.

Electricity generation (including emissions from both the Manx Utilities and the Energy from Waste plant) is
currently the dominant source of carbon emissions on the Isle of Man, accounting for 33% of the island’s emissions
at 245KT per year. It is also the only sector where emissions have increased over the last five years.

THE CHALLENGE FOR 2050

As other sectors are electrified, demand is expected to grow. Peak demand is the point of the highest electricity use
across a day – usually coinciding with consumers returning home from work. In the future it is expected this
demand will increase as consumers switch on their electric heating and start charging electric vehicles. The
projected increase in Peak demand modelled across three different consumer behaviours is shown in Fig. 2.
                                                                                                            5|Page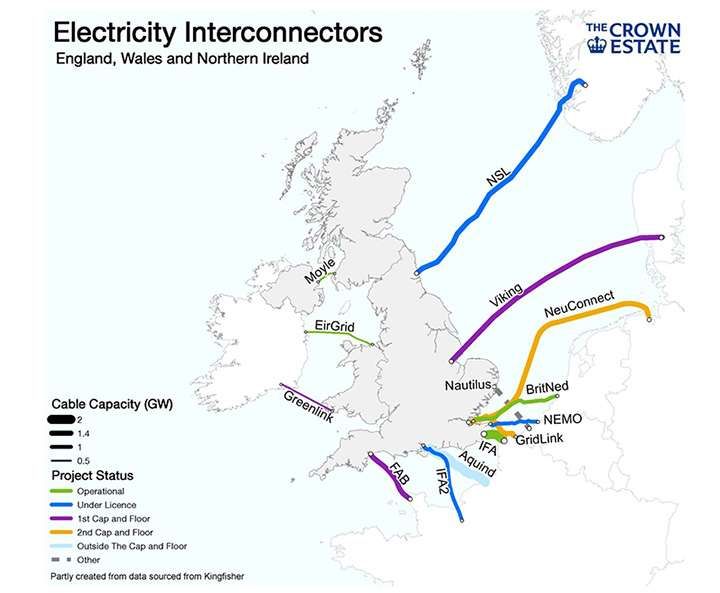
FIG. 2 – PEAK DEMAND PROJECTIONS

                                                Source: Arup Analysis

This increase in Peak Demand presents the greatest challenge. Firstly, there is insufficient existing capacity available
to meet the demand projections by 2028 if the same level of resilience is to be maintained on Island e.g. a major
fault such as a fire or flooding event could remove all of the generators located at Pulrose, which would leave the
Island entirely reliant on Peel and the interconnector to meet Maximum Peak Demand. Secondly, all existing
generation units are expected to retire between 2025 and early to mid-2030s. These assets will need to be replaced
with technology of the same capability to maintain supply.

FIG. 3 THE ENERGY TRILEMMA

                                            Source: World Energy Council

It is globally recognised that future generation must be balanced against three conflicting measures:
Cost/Affordability of supply, Security of supply and Environmental impact of supply (often simplified to low carbon
or carbon neutral generation). There will always be a compromise between these areas, with no one solution being
able to achieve all three. For example electricity generated from 100% wind power may have low environmental
impact but will give neither stable nor secure generation.

The ‘best’ solution for future generation could therefore be seen to be one which sits directly in the middle of all
three aspects. This should be seen as the target to ensure the correct balance between these three areas.

                                                                                                            6|Page
ELECTRICITY GENERATION
INTRODUCTION
Electricity can be sourced from carbon-producing technology (fossil fuels), low carbon technology
(nuclear/Hydrogen) or renewable energy sources (including sustainably sourced biofuels).

Despite growth in renewable and carbon neutral sectors, globally electricity production is still heavily reliant on
fossil fuels. This will need to change to enable countries to meet their net zero emission targets.

FIG. 4 - GLOBAL ENERGY GENERATION BY SOURCE

                                              Source: Our World in Data

FOSSIL FUELS

Traditionally, energy is generated from the burning of fossil fuels, such as oil, coal and natural gas. Heat energy is
released from fossil fuels when burnt. This also releases carbon dioxide. It is this release of carbon dioxide that
contributes to the forming of an invisible blanket of greenhouse gases in our atmosphere trapping heat from the
sun, increasing global average temperatures and contributing to more severe and less predictable weather
conditions. This is generally referred to as anthropogenic (human-caused) climate change.

                                                                                                             7|Page
All fossil fuels originate from the breaking down of dead organisms (plants, cyanobacteria, algae), which store
carbon in their structures. The length of time fossil fuels take to form also means that they are a limited resource
and will eventually run out.

RENEWABLE ENERGY

Renewable energy is energy made from resources that nature will replace, like wind, water and sunshine. Some
examples of this are solar power, geothermal power, hydro power, wind power, tidal power and wave power. They
do not produce carbon dioxide.

Biomass energy (from burning plants, wood, bio-liquids, biogas and waste) can also be included as a renewable
energy, providing the material for burning is sustainably produced. Of all the various renewable energy types,
biomass is the only technology that provides consistent energy production as it is not reliant on weather
conditions.

Each technology used for producing renewable energy has its own advantages and disadvantages that must be
carefully considered.

CARBON NEUTRAL ENERGY

Carbon neutral energy sources are those that do not produce carbon dioxide as energy is produced. Hydrogen Gas
Turbines and Nuclear are currently regarded as carbon neutral or low carbon technologies.

At present, no technology for producing energy (including renewables) is truly carbon neutral. This is because the
transportation, construction and maintenance of these technologies releases carbon dioxide. To remove this
carbon, technologies such as carbon capture, which is the process of capturing carbon dioxide from the
atmosphere and storing it in sites where it cannot enter the atmosphere, will need to be used to achieve carbon
neutrality.

Carbon Capture may also be used to remove carbon dioxide emissions from the exhaust stacks of fossil fuel power
stations to avoid release to the atmosphere, or biomass plants to achieve ‘carbon-negative’ generation.

                                                                                                           8|Page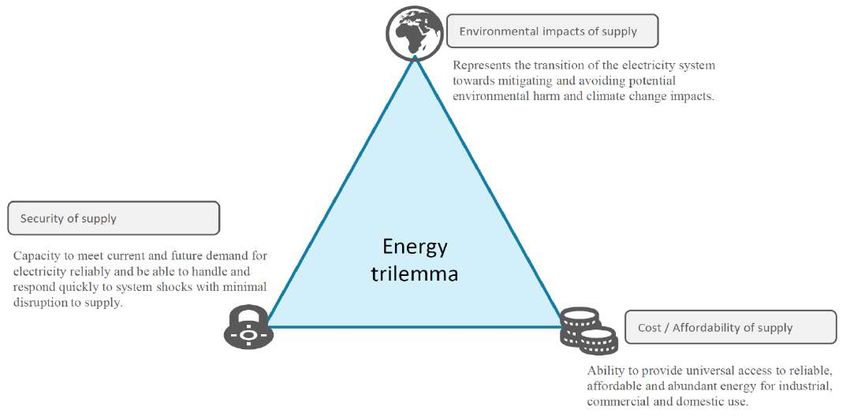
EXISTING GENERATION IN THE ISLE OF MAN
OVERVIEW
Generation on the Isle of Man currently follows two principles, which are defined in the Electricity Act, 1996:

    (1) Affordability (power is generated from the cheapest source of electricity – on the whole this is the
        Combined Cycle Power Station at Pulrose Power Station)
    (2) Security of Supply (There are backup options in the event that two sources of electricity are simultaneously
        unavailable, which can meet Peak demand e.g. during or routine maintenance, or following a fault)

There are currently 3 major power stations on the Island, 2 small scale power stations and a subsea cable used to
import/export electricity to the UK. Currently 84% of the Islands electricity is generated from imported fossil fuels,
with the remainder either imported via a cable from GB, or generated at the EFW plant or Sulby Hydro.

These are shown in Fig. 5. Electricity is fed to our homes via the Island’s transmission and distribution network. This
mix of electricity currently allows us to meet the two principles even if the two largest generators are unavailable.

FIG. 5 – MAP OF GENERATION UNITS ON THE ISLE OF MAN

          Imported
         Natural Gas

                                Imported
                                  Diesel

                                           Source: Isle of Man Government

CURRENT GENERATION MIX AND RETIREMENT OF ASSETS

PULROSE CCGT
Primarily, electricity on the Island is generated at the Combined Cycle Gas Turbine (CCGT) Station at Pulrose in
Douglas. The CCGT consists of two gas turbines (similar to those on aircraft) and one steam turbine. The gas
turbines burn natural gas, to produce up to 30 MW of electricity each. Carbon dioxide and water vapour are
released during the burning process. The steam turbine utilises waste heat captured from the exhaust stacks to
produce an additional 20 MW. As this waste heat would otherwise be released to the atmosphere, the steam
turbine can therefore be regarded as a ‘clean’ source of electricity. The use of this recycled heat increases the

                                                                                                            9|Page
efficiency of the power station from 35% to around 50%. The Gas Turbines (GTs) are themselves flexible and could
be used to balance up to 20 MW of intermittent renewables. Balancing is the process required to maintain the
Transmission Network within its limits and ensure there is no loss of supply. While the gas turbines are flexible
enough to provide this balancing, the steam turbine cannot currently operate in all of these conditions and may
need to be turned off, which could mean the 20MW of electricity from recycled heat would be lost. The
introduction of these 20MW renewables may therefore not reduce carbon emissions.
The CCGT will reach the end-of- its design life by 2035. However, this could be brought forwards depending on the
concentration of hydrogen in the UK Gas Network. The GTs (GE LM2500+ SAC) are not designed to run on more
than 5% hydrogen (unless carbon monoxide can also be added to the gas stream). With carbon monoxide present,
a minor modification could allow this limit to be raised to 25%. By 2031, hydrogen in the Gas Network may exceed
the limit of the current GE turbines would need to be replaced or modified to allow the plant to continue to
operate. There is currently no viable modification that will allow the GTs to continue to operate so an alternative
may need to be available to replace these assets in 2030s should they be unable to operate using hydrogen. If a
suitable modification did become available or if the gas turbines were replaced with alternative GTs it may be
possible to continue operating the CCGT beyond 2035. Nonetheless, as hydrogen is currently one of the most
expensive carbon neutral options available, it is unlikely this will prove to be cost-effective for consumers unless its
cost reduces as its availability increases. If viable, an alternative option could be converting the GTs to run on
biofuel such as biodiesel and bioethanol.
PEEL B-STATION AND DOUGLAS D-STATION DIESELS
There are five 10 MW Diesel Generators at Pulrose and a further four 10 MW Diesel Generators at Peel Diesel
Station. The diesel engines burn diesel (currently light fuel oil) to produce energy. The diesel engines release c.700
kg carbon dioxide per MWh generated, which increases at lower loads. This is greater than the amount produced
from the CCGT plant. However, the diesels are generally only used as a back-up to guarantee a reliable electricity
supply.
The diesel generators at Peel and Pulrose have already reached their notional end-of-life and it is rarely considered
commercially viable to operate these assets. However, they will be maintained until at least 2025 to ensure an
emergency back-up is available in case there is a fault with the CCGT. Continued maintenance of these assets past
2025 would be more costly than replacement with new infrastructure, even carbon neutral assets such as
dispatchable generation using biofuel.
AC INTERCONNECTOR
In addition to these major stations the Island can import and export electricity via the Alternating Current (AC)
subsea cable to and from Great Britain. This also helps to maximise the efficiency of the GT. At 65 miles long, it is
one of the longest AC interconnectors in the world. Importing electricity via the interconnector (especially from
resources such as nuclear and wind) has no carbon cost for the Isle of Man. GB also provides balancing capacity for
the Isle of Man, which will be explained in the Network Stability section. The cable is fixed at a maximum
continuous capacity of 60MW and a new cable would need to be laid in order to export or import more electricity.
It would also be necessary for balancing any intermittent renewables e.g. Solar or Offshore wind.
In general, the UK is short of stable generation capacity and the Isle of Man can export electricity, at a profit, to the
UK when it is short of supply. This helps to keep electricity bills as low as possible for Isle of Man consumers.
The interconnector will reach the end of its original design life in 2040. It is likely possible to carry out some
refurbishments of the auxiliary equipment to allow its operational life to be extended through to 2060. It would not
be possible to increase the capacity (uprate) the existing cable beyond 60MW. Additionally, if signs of fatigue are
showing in the 2030s, replacement of worn assets would need to be planned.
ENERGY FROM WASTE (EFW) PLANT
The Island also has an energy from waste (EfW) plant that burns waste, producing up to 5 MW of electricity. The
10 | P a g eprocess releases greenhouse gases including carbon dioxide. These are significant for the size of the plant, but the
same emissions would still be produced from the decomposition of waste, whether it is burned or not, therefore
the EfW plant makes use of emissions that would occur anyway to turn them into useful energy. For example,
historic landfill waste is still emitting greenhouse gases and will continue to do so for some time, even though there
is limited ongoing landfill activity in the Isle of Man.
SULBY HYDRO
The Hydro Plant in the Sulby Glen generates up to 1% of the Island’s energy from renewable sources (1MW of
electricity at maximum capacity). There are two hydro generators located beneath Sulby Reservoir which utilise
water from both Blockeary Reservoir and Sulby reservoir to produce energy.
While 1 MW seems a very small scale, this type of generation is one of the most efficient energy sources in
existence at 90% - 95% efficiency and has minimal running costs. However, Sulby reservoir is also the Island's
largest water resource for provision of drinking water. To ensure drinking water supplies are not compromised, the
output from the hydro-electric station is limited, particularly during the summer months. Sulby therefore rarely
operates more than 4 months per year.
ISLAND DEMAND AND SECURITY OF SUPPLY
The island requires an average of c.60 MW throughout the day to power homes and businesses. This power use is
not evenly distributed across the day. At night electricity demand can be as low as 25 MW but Peak demand in the
day time (usually between 7am – 9am and 5 pm – 7pm can reach 85 MW) The CCGT can alter its load by varying the
gas supply, which allows the station to match the island demand profile across the day. The CCGT alone is sufficient
to meet island demand. At full capacity (peak demand), the CCGT station produces c.400 kg CO2 per MWh
generated. Low CCGT loads have a cost of reduced station efficiency and increased carbon dioxide production per
MWh, although total emissions are reduced. In order to ensure that the island has a reliable electricity supply,
additional capacity is required to support the grid in the event of a fault scenario.
If there is any fault on the steam turbine, the GTs at Pulrose can still continue to operate to deliver up to 60 MW of
variable load, depending on whether or not the boilers remain in service. Without the boilers, the GT output can be
limited to avoid damage to the boiler structure. The GTs alone can therefore provide enough power to meet most
of the demand, however the emissions will be seen to increase to c.600 kg CO2(e) per MWh generated. The
interconnector can be used to supply the additional energy demand, as well as balancing capability.
The diesel engines at Peel and Pulrose with a collective output of 90 MW can together meet island demand.
These generating assets and the interconnector can meet the Isle of Man electricity demand requirements. If there
is any risk of a fault developing (e.g. network maintenance in the NW of England, which could cause the
interconnector to trip), the diesel engines can be put into service allowing them if required (e.g. if the CCGT has
reduced capacity) to take the demand in the event of any trip.
The level of resilience on the Island is referred to as ‘N-2’. This means that two of the largest sources of generation
can develop a fault, or be taken out for maintenance, and there is still enough capacity available to meet demand.
‘N-1’ resilience means only one of the largest sources can fail, and that no sources can fail when a large source has
been taken out of service for maintenance. However, this does not necessarily mean the risk of losing supply is
greater with N-1; for example, if existing sources are replaced with more robust plant such as interconnectors
which have a much lower chance of developing a fault.
Any future source of electricity on island must be able to meet this demand in a controllable manner to maintain
security of supply and economic stability.
11 | P a g eNETWORK STABILITY
SUPPLY, DEMAND AND STABILITY
The GB and Isle of Man grid networks supply electricity in the form of Alternating Current (AC) to our homes. The
appliances in our homes are designed to operate under specific conditions:
Voltage 33kV (Bulk transmission)
11kV (Local distribution)
230V (Domestic Supply)
Grid Frequency 50Hz ± 0.5Hz
Reactive Power To balance voltage
To match customer use
Fault Current Sufficiently high for grid
protection to operate
Maximum Demand 131 MW (2050)
Minimum Demand 60 MW (2050)
Inertia To maintain system stability
If the network moves too far from these set points, network and customer protection can operate to return the
system back within these set points, which may involve disconnection of some customers. Ensuring these limits are
maintained requires a balance of what is called ‘baseload’ and ‘dispatchable’ generation. Intermittent renewables
such as wind and solar cannot replicate baseload plant however, they can offset some of the dispatchable capacity
when they are available. Provision of these stabilising services is known as balancing.
FIG. 6 – GRAPH SHOWING ISLAND DEMAND PROFILE FOR DECEMBER 21 S T 2019
Peak
PM Peak Period Demand
AM Peak Period
Dispatchable
Generation
Baseload
Generation
Source: Manx Utilities Energy Services Application
BASELOAD GENERATION
Baseload generation can be fairly inflexible generation units, but is essential to ensure the transmission network
operates within its limits and meets the minimum required electricity demand. By operating at a stable steady load,
voltage and reactive power can be varied using transformers. The units are often coupled with large steam
turbines, which provide inertia along with the interconnector. Inertia reduces the grid frequency spikes on the
network caused by sudden power swings (e.g. power line failures, gusting wind with wind generators, sudden
increases in demand). Baseload generation is usually built to match the minimum demand as shown in Fig. 6.
12 | P a g eExamples include nuclear power stations, coal-fired power stations and large scale gas-fired power stations. These
can be combined with Carbon Capture and Underground Sequestration technologies to provide Net Zero
generation, but this technology is still in development. Geothermal Energy and large scale Hydro as seen in Iceland
can also provide baseload. However, nuclear and large scale biomass provide the only alternatives that would be
suitable for the British Isles. Jersey and Guernsey currently utilise French nuclear power to stabilise their networks
by importing electricity through their Interconnectors.
Baseload generation on the Isle of Man can be provided by the CCGT, the interconnector, or in emergencies the
diesels, which are also designed to provide flexible, dispatchable generation as required. Across Europe, most
countries are either investing in nuclear technologies, or utilising interconnectors to stabilise their grids by
providing resilient routes to alternative sources of energy.
DISPATCHABLE GENERATION
Dispatchable generation is flexible plant which can be started and shut down on demand and power output can be
varied quickly ensuring grid frequency remains stable and secure. Intermittent Renewables such as solar and wind
can off-set some of the dispatchable generation when these sources are available. However, dispatchable
generation is always required to ensure Peak Demand can be met where there is a shortfall of generation i.e. when
intermittent renewables are not available, or if there is an unexpected loss of load due to a fault with a baseload
generator or a change in output from intermittent renewable generators.
Examples include gas-turbines and diesel generators. These technologies are gradually being replaced with
alternative fuels e.g. biofuels and hydrogen. However, currently hydrogen remains one of the most expensive
alternatives.
INTERMITTENT RENEWABLES
Intermittent renewables are sources of generation powered by natural resources i.e. wind, tide and solar. The
power output (or availability) of these generation units is highly dependent on prevailing weather conditions. The
lack of ability to vary power output from intermittent renewables means voltage and frequency (along with many
other stabilising factors) cannot be controlled on their own. These technologies can off-set some or all of the
dispatchable generation assets when they are available but must still be stabilised.
Intermittent renewables typically have low load factors – this is the average output of the generator divided by the
maximum installed capacity of the same type of generators over a given period. Wind typically has an average load
factor of c.37%, (c.25% onshore wind and 50% offshore wind) which means on average it produces 37% of the
rated maximum output. Solar has less favourable performance, with a load factor of c.10% in the British Isles. For
obvious reasons, solar power does not generate electricity on winter evenings when demand is generally the
greatest. Therefore, to ensure Peak Demand could be met using intermittent renewables alone, the excess
generation capacity would have to be enormous, even where storage solutions were deployed. For this reason,
dispatchable generation units are also required to avoid excessive CAPEX5 costs.
STORAGE
Over short time scales, storage (e.g. pumped hydro, batteries) can temporarily manage some aspects such as the
frequency swings by absorbing and releasing power. These help to provide some inertia to the transmission
network. In the event of a sudden loss of load (e.g. large-scale trip) the stored energy can be released rapidly to
maintain capacity on the network. This is a short-term solution to the problem as the stored energy is finite and it is
currently expensive. However, it buys sufficient time to allow dispatchable units come on-line and meet the
generation shortfall.
5. CAPEX (Capital Expenditure) are funds used by a company or government to acquire, upgrade and maintain physical assets such as property, plants, buildings, technology and equipment.
13 | P a g eTHE UK SOLUTION
BACKGROUND
The UK is already transitioning towards Net Zero and currently generates 52% of all of its electricity from low
carbon sources. Substantial investment has already been carried out on the Transmission Network to
accommodate intermittent renewable technologies, which has also locked the centralised grid into the future of UK
energy. As discussed, this has numerous implications for the grid in terms of stability. However, this journey to net
zero actually started in the 1950s with the construction of Magnox nuclear stations and pumped storage schemes
such as Dinorwig. This has continued through to 1980s with the construction of the Advanced Gas Reactors (AGRs)
and finally the commissioning of Sizewell B (a Pressurised Water Reactor) in 1995. These stations are baseload
plants and are critical to maintain Grid stability in the absence of fossil fuels. They provide the balancing power
required for the operation of offshore and onshore windfarms.
FIG. 7 – CHART SHOWING UK ELECTRICITY MIX – 2019
Source: BEIS, UK Government
FIG. 8 – GRAPH SHOWING REDUCTION IN UK EMISSIONS BY SECTOR BETWEEN 1990 - 2018
Source: Institute for Government, after BEIS, UK Government
14 | P a g eUK FUTURE GENERATION
The UKs is expected to commission 40GW of offshore wind to meet its 2030 target (see Fig. 9). It is able to do this
due to its nuclear baseload capacity. At times the GB Market will have surplus generation from wind farms
compared to demand, which means there would be limited opportunity for a neighbouring jurisdiction with similar
wind resource to export excess power to GB. The UK has also committed to building a new generation of nuclear
reactors, biomass combined with CCS, and hydrogen storage, which allows it to increase this wind capacity even
further towards 2050.
FIG. 9 – MAP SHOWING PLANNED OFFSHORE WINDFARM DEVELOPMENTS (ENGLAND, WALES, N. IRELAND)
Source: The Crown Estate
FIG. 10 – MAP SHOWING PLANNED OFFSHORE WINDFARM DEVELOPMENTS – IRISH SEA
Source: Arup Analysis
The UK is also currently in the process of constructing Hinkley Point C (a European Pressurised Reactor), which will
be the largest nuclear generating plant in the UK by the time it has been commissioned, and is already in
consultation to construct an additional large-scale EPR at Sizewell C. There is a further commitment to build
additional stations potentially including up to 17 Small Modular Reactors (SMRs), which it will need to stabilise the
excess wind capacity. However, currently it is struggling to find suitable sites to deploy its first SMR.
15 | P a g eFIG. 11 – MAP SHOWING CURRENT OPERATIONAL AND COMMISSIONING UK INTERCONNECTORS
Source: after the Crown Estate
As further back-up the UK has also invested in large scale interconnectors, which also allow the UK to export its
excess wind power to mainland Europe and import baseload from other countries e.g. France (Nuclear) and
Norway (large-scale hydro) when it is short. Presently the UK is short of dispatchable and baseload power over
peak Winter periods and this leads to very high market prices e.g. on January 12th 2021, France charged the UK
£8/kWh (£8000/MWh) at peak demand, compared to typical wholesale prices of £0.06/kWh (£60/MWh). There is
therefore a potential economic opportunity for countries with baseload units to export to the UK.
There also is ongoing investment in hydrogen and battery storage to assist with the short-term frequency swings.
The UK also has started the conversion of Drax coal station to biomass although, there are issues with the sourcing
of sustainable biomass. Drax is due to decommission the last of its two coal units by September 2022.
Despite these commitments, the UK has accepted that is not possible to achieve net zero carbon in generation
without also capturing the emissions from construction and maintenance of carbon neutral technologies.
16 | P a g eISLE OF MAN FUTURE ENERGY SUPPLY
FUTURE ENERGY SCENARIOS STRATEGY
Ove Arup were appointed to identify transition pathways to allow the Island to reach Net Zero for its electricity
supply by 2050, as well as showing how 75% of all electricity could be sourced from renewables by 2035.
There were three controls on the project:
a) The pathways must meet the emissions targets;
b) The scenarios must provide the most cost effective pathway to achieve these targets, to ensure the principles of the
Just Transition were followed;
c) The study must consider the balance of security of supply, low cost to consumers, and the environment.
Ove Arup carried out independent, technical and economic modelling to create three scenarios based on
technologies which were appropriate for the Isle of Man. They were assisted by a technical team consisting of
representatives from the Climate Change Transformation Team, DEFA, DfE, Manx Utilities, Treasury and DOI, who
provided relevant data and information on local factors throughout the process.
The analysis has shown that in all future scenarios, importing renewable electricity will result in the lowest costs to
customers. Interconnectors provide baseload in all scenarios. The greater the amount of installed intermittent
renewables on island, the higher the costs to consumers. This is because the UK is building large-scale intermittent
renewables (i.e. wind, solar), which generate electricity more efficiently than small generators and benefit from
economies of scale. There is also limited opportunities for Isle of Man to export electricity to GB, due to the excess
capacity of renewable generators expected to be in operation by 2050. Isle of Man assets also have an 11% CAPEX
uplift compared to equivalent UK installations, due to labour, available skill-set, transport and economies of scale.
While intermittent renewables lead to higher consumer costs, dispatchable generation can actually lead to lower
wholesale costs on the Isle of Man than in the UK. The times where the UK is short of capacity, are those when
intermittent renewables are unavailable (e.g. winter nights where there is no wind). During these times, there isn’t
sufficient capacity from dispatchable generators to meet demand so the UK is reliant on imports from Mainland
Europe. Dispatchable renewable biomass generators are present in all three scenarios, and these are operated
where GB prices are high to minimise costs for consumers. All costs discussed include CAPEX network upgrades,
operations and maintenance, insurance, fuel and price of electricity.
FIG. 12 – SCENARIO 1 – SOLAR, WIND AND LARGE-SCALE BIOMASS
43MW solar farm with 9MW
storage
16 MW Offshore wind turbines
Biomass provides up to131 MW
dispatchable generation
Estimated cost£1.49bn
(N-2 cost £1.66bn)
£1142 per household per annum
57% on island generation capacity;
20% demand met by island sources
Source: Arup Analysis
17 | P a g eScenario 1 has the highest proportion of intermittent renewables and therefore has the highest cost to consumer.
Both the cost of electricity in p/kWh and the cost to the taxpayer is expected to be higher than Scenarios 2 and 3.
The base-retail electricity price is estimated to be between 9.3 – 11.1 p/kWh* depending on the preferred
resilience level.
In this pathway, small-scale solar capacity starts to gradually build throughout 2020s, with biomass displacing the
diesel engines at Douglas D-Station and Peel by 2028. Increased biomass capacity in the early 2030s, allows the
CCGT to be phased out of use with increased solar, offshore wind and biomass then making up over 50% installed
generation capacity. A 140MW interconnector displaces the existing 60MW interconnector in 2040 to ensure
maximum demand can be met during maintenance periods.
The biomass station also provides baseload electricity during interconnector maintenance and critically would allow
the Isle of Man to maintain supply, even if GB suffered an all-island black-out.
Biomass use is limited by the amount of sustainable material, which can be grown on island. Importing biomass
from GB could allow for increased generation, with potential to export electricity for profit to GB when there is a
shortage of dispatchable generation. This could subsidise electricity for consumers on Island.
*The base-retail rate is taken as the estimated cost of the assets and associated infrastructure over the life-span of the asset, divided by the electricity demand.
FIG. 13 – SCENARIO 2 – IMPORTED RENEWABLE POWER & BIOMASS
6MW Small scale roof-top solar
e.g. installed on public buildings
2 x 140MW interconnectors supply
renewable electricity from GB and provide
baseload
Biomass provides up to 64 MW
dispatchable generation
Estimated cost £1.4bn
(N-2 cost £1.57bn)
£1073 per household per annum
20% on island generation capacity; 8%
demand met from island sources
Source: Arup Analysis
Scenario 2 has the lowest proportion of on-island generation with 91% of demand met by imports. The base-retail
electricity price is estimated to be 8.5 p/kWh for either N-1 or N-2. However, the overall cost per household could
be up to £130 per year higher if increased resilience is preferred.
In this pathway, the diesels generators are replaced by a 140MW interconnector by 2028, with biomass increasing
to phase out the CCGT in the early 2030s. A further 140MW interconnector displaces the existing 60MW
interconnector in 2040 to ensure maximum demand can be met during maintenance periods.
The biomass generators provide dispatchable generation to off-set high peak-charges in GB. The biomass
generators would allow the Isle of Man to maintain supply to key sectors (e.g. buildings providing public services,
data-centres) in the event of a GB black-out, with other sectors quickly reconnected following restoration of supply.
Note that a total GB black-out is considered highly unlikely.
Roof-top solar, which is of suitable scale for 6MW solar generation, could be installed on public buildings from
2022.
18 | P a g eFIG. 14 – SCENARIO 3 – DECENTRALISED GENERATION & BIOMASS
6MW Small scale community solar
2.3 MW roof-top solar on new builds
2 MW Community wind projects
Biomass provides up to71 MW
dispatchable generation and interconnector
provides baseload
Estimated cost£1.07bn
(N-2 cost £1.24bn)
£820 per household per annum
Source: Arup Analysis 30% on island generation capacity; 9%
demand met by island sources
Scenario 3 results in the lowest cost to consumer and the lowest retail price of all scenarios. This is mostly due to it
having the lowest installed capacity. The base-retail electricity price is estimated to be 6.7 – 7.2 p/kWh.
In this pathway, 50% of new builds have roof-top solar panels, giving a capacity of 2.3 MW. An additional 6 MW of
solar is installed on public buildings (or used for community generation projects), and small-scale community wind
projects provide 2 MW total power. The diesel generators are replaced with a 140MW interconnector, with
biomass increasing to phase out the CCGT in the early 2030s. The existing 60MW interconnector is re-conditioned
to facilitate life-extension.
The biomass generators provide dispatchable generation to off-set high peak-charges in GB. The biomass
generators would allow the Isle of Man to maintain supply to key sectors (e.g. buildings providing public services,
data-centres) as well as an increased domestic area relative to Scenario 2 in the event of a GB black-out, with other
sectors quickly reconnected following restoration of supply. Note that a total GB black-out is considered unlikely.
INCREASED RENEWABLE CAPACITY
In all scenarios, renewable capacity could be increased further to provide additional on-island generation. Biomass
generators can also provide balancing services for intermittent renewables by acting as ‘sub-synchronous
condensers’ – this means that they can absorb some of the excess power generated from renewables when the
capacity exceeds demand.
60 MW of intermittent renewable capacity consisting of 40MW solar and 20 MW of offshore wind can be added to
each scenario at an approximate cost of £100M. This high level estimate also includes network and operating costs.
The change in price for each scenario with increased renewable capacity. For each scenario this would increase the
cost per household per annum by approximately £76.50.
ADDITIONAL SCENARIOS
It was requested by the Climate Change Transformation Board that additional work was carried out to identify the
costs of significantly more intermittent renewable generation. Two additional scenarios were requested, which
required the removal of low cost to consumer and the trilemma balance from the model inputs.
19 | P a g eTo ensure most of the Island’s demand can be met with intermittent renewable generation an excess of
intermittent renewable capacity and storage is required. This is so that on cloudy, non-windy days, there will be
sufficient stored energy available to maintain supply. This is shown in both scenarios 4 and 5. The storage solutions
are also expected to have significant environmental impact both in terms of materials required, and area required
for the schemes. In both of these scenarios, imported electricity is still required to avoid a shortfall.
FIG. 15 – SCENARIO 4 – HIGH INTERMITTENT RENEWABLE CAPACITY
377MW intermittent renewable capacity
280MW storage (including onshore
marine pumped hydro) required for balancing.
GB provides all baseload stabilisation through
270MW interconnectors
Estimated cost £1.8bn* (N-2)
£1379 per household per annum
345% on-island generation capacity; 58%
demand met by on island sources
*Excluding constrainment costs
Source: Arup Analysis
Scenario 4 results in higher cost to customers than all three previous scenarios. This is result of the high required
installed capacity. In addition the lack of dispatchable generation means that high peak charges from GB cannot be
avoided. The high peak charges occur when local weather conditions do not allow for generation from intermittent
renewables in GB, which will also affect the Isle of Man. The base-retail energy is estimated to be 11.2p/kWh
compared to 5.4 p/kWh for existing units. However, unlike the previous scenarios the very high proportion of
intermittent renewables means that at times there could be 317MW of excess generation capacity compared to
demand (e.g. Midday in summer). Storage can only provide a temporary solution to this over-generation. As GB will
also have a similarly high capacity of renewable generation at these times, the Island will either have to pay
generators to switch-off their units, or export to the UK at a potential loss. This could result in higher charges.
In this scenario interconnectors are still required to replace the diesel engines by 2028. This then allows for
renewables to start to be introduced. Further interconnectors replace the CCGT in the early 2030s, which allows for
a further increase in intermittent renewables. The existing 60MW interconnector is re-conditioned to facilitate life-
extension and storage is deployed on island. The capacity of storage is significant, requiring large areas of land to
be made available. By 2050, 50% of all buildings on island will have solar panels installed on their roofs.
Marine pumped hydro is required for this model to work. There is insufficient rainfall on the Isle of Man to allow for
freshwater storage as this would compete with drinking water supply. Therefore, pumped salt-water from the sea
must be utilised instead. The volume required would be roughly equivalent to 66% of Sulby Reservoir. Storing this
quantity of salt water on island could have consequences for the eco-systems and agricultural land.
Without any on-island baseload (or dispatchable generation), the Isle of Man is entirely reliant on GB for providing
stability to the network. Despite the high level of generation capacity, the Isle of Man will still need to import 42%
of the electricity required to meet demand throughout the year. In the event of a GB black-out (or brown-out in
areas of connection points), there would be no power to the Island’s key sectors. This would mean they would
require their own dispatchable generators (e.g. biodiesels) to ensure essential services could be maintained.
Restoration of power to the Isle of Man network could also prove challenging and would have to be staggered.
Note that a total GB black-out is considered highly unlikely.
20 | P a g eYou can also read