Gas demand and supply projections - 2021 to 2035 - www.concept.co.nz
←
→
Page content transcription
If your browser does not render page correctly, please read the page content below
www.concept.co.nz

Gas demand and supply projections – 2021 to 2035
May 2021
About Concept Consulting Group Ltd

We have been providing useful, high-quality advice and analysis for more than 20 years. Our roots are in the electricity sector and our practice has grown from
there. We have developed deep expertise across the wider energy sector, and in environmental and resource economics. We have also translated our skills to
assignments in telecommunications and water infrastructure.

Our directors have all held senior executive roles in the energy sector, and our team has a breadth of policy, regulatory, economic analysis, strategy, modelling,
forecasting and reporting expertise. Our clients include large users, suppliers, regulators and governments. Our practical experience and range of skills means
we can tackle difficult problems and provide advice you can use.

For more information, please visit www.concept.co.nz.

Disclaimer

Except as expressly provided for in our engagement terms, Concept and its staff shall not, and do not, accept any liability for errors or omissions in this report
or for any consequences of reliance on its content, conclusions or any material, correspondence of any form or discussions, arising out of or associated with its
preparation.

The analysis and opinions set out in this report reflect Concept’s best professional judgement at the time of writing. Concept shall not be liable for, and expressly
excludes in advance any liability to update the analysis or information contained in this report after the date of the report, whether or not it has an effect on
the findings and conclusions contained in the report.

This report remains subject to any other qualifications or limitations set out in the engagement terms.

No part of this report may be published without prior written approval of Concept.

© Copyright 2021
Concept Consulting Group Limited
All rights reserved

                                                                                                                                                           1|P a g e
Contents
Gas demand and supply projections – 2021 to 2035 ............................................................................................................................................................................... 0
1      Executive summary .................................................................................................................................................................................................................. 1
    1.1       Gas supply for winter 2021 looks very tight .................................................................................................................................................................... 1
    1.2       Current tight supply reflects two unusual factors ........................................................................................................................................................... 2
    1.3       Outlook for 2022-2035..................................................................................................................................................................................................... 3
2      What this report is about ......................................................................................................................................................................................................... 4
    2.1       Scope ................................................................................................................................................................................................................................ 4
    2.2       Information sources ......................................................................................................................................................................................................... 4
3      Outlook for 2021 ...................................................................................................................................................................................................................... 5
    3.1       Summary – outlook for 2021 ........................................................................................................................................................................................... 5
    3.2       Methodology focuses on critical winter months ............................................................................................................................................................. 5
    3.3       Gas supply capability for winter 2021.............................................................................................................................................................................. 5
    3.4       Gas demand for winter 2021 ........................................................................................................................................................................................... 5
       3.4.1        Gas demand for residential/commercial/agricultural users ...................................................................................................................................... 6
       3.4.2        Gas demand for larger industrial users (except petrochemicals) .............................................................................................................................. 6
       3.4.3        Petrochemical manufacturing .................................................................................................................................................................................... 6
       3.4.4        Gas demand for power generation ............................................................................................................................................................................ 6
    3.5       Gas supply will be tight for winter 2021 .......................................................................................................................................................................... 8
    3.6       Peak daily demand ......................................................................................................................................................................................................... 10
    3.7       Current tight supply reflects two unusual factors ......................................................................................................................................................... 12
4      Outlook for 2022-2035........................................................................................................................................................................................................... 14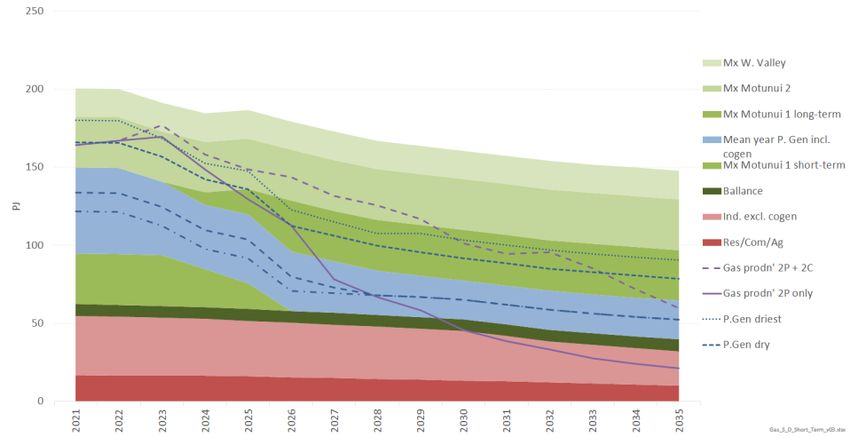
4.1 Summary – outlook for 2022-2035 ................................................................................................................................................................................ 14
4.2 Projections consider a range of supply and demand scenarios..................................................................................................................................... 15
4.3 Gas supply scenarios for 2022-2035 .............................................................................................................................................................................. 15
4.3.1 Base case - gas supply from existing 2P reserves..................................................................................................................................................... 15
4.3.2 Higher case - gas supply from existing 2P reserves ................................................................................................................................................. 16
4.3.3 Lower case - gas supply from existing 2P reserves .................................................................................................................................................. 16
4.3.4 Gas supply from existing contingent resources ....................................................................................................................................................... 17
4.3.5 Gas supply scenarios ................................................................................................................................................................................................ 18
4.4 Gas demand 2022-2035 ................................................................................................................................................................................................. 19
4.4.1 Gas demand for residential/commercial/agriculture .............................................................................................................................................. 19
4.4.2 Gas demand for larger industrial users (except petrochem) ................................................................................................................................... 20
4.4.3 Gas demand for power generation .......................................................................................................................................................................... 20
4.4.4 Petrochemical manufacturing .................................................................................................................................................................................. 22
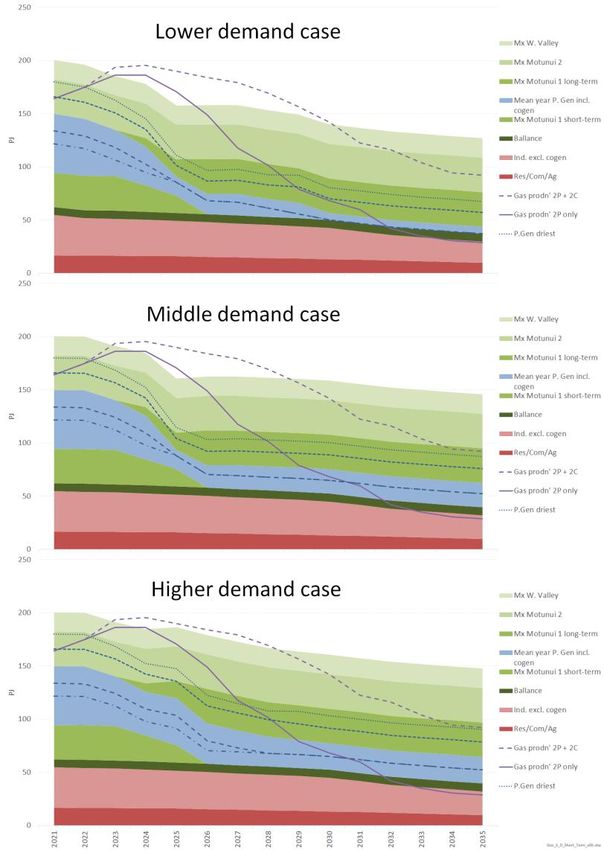
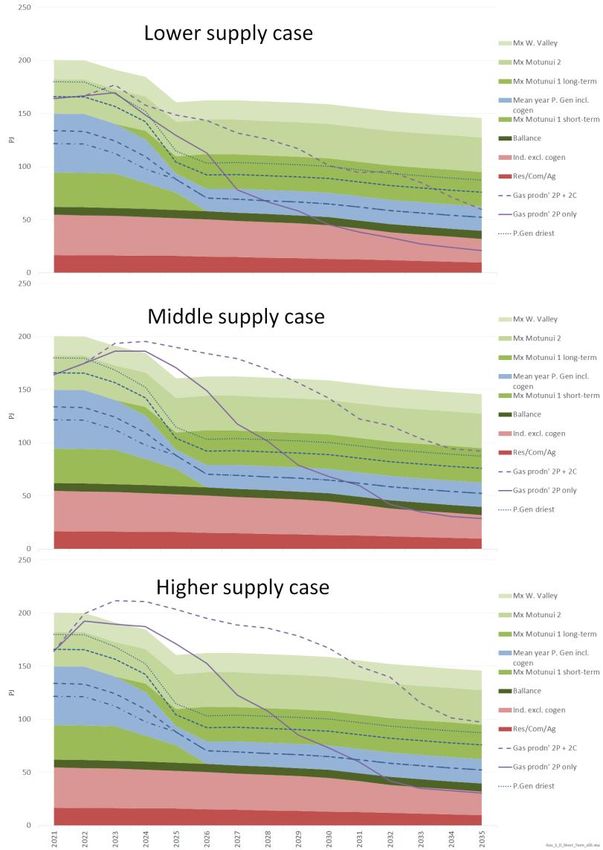
4.5 Outlook for 2022-2035 – composite scenarios .............................................................................................................................................................. 23
4.5.1 Outlook for winter 2022........................................................................................................................................................................................... 23
4.5.2 Annual supply and demand measures for 2022-2035 ............................................................................................................................................. 24
4.5.3 Outlook for 2022-2035 – central scenario ............................................................................................................................................................... 25
4.5.4 Outlook for 2022-2035 under alternative demand cases ........................................................................................................................................ 27
4.5.5 Outlook for 2022-2035 under alternative supply cases ........................................................................................................................................... 28
4.5.6 Outlook for 2022-2035 – the stress test scenario .................................................................................................................................................... 29
4.6 Investment needed to underpin reliable gas supply ..................................................................................................................................................... 29
3|P a g e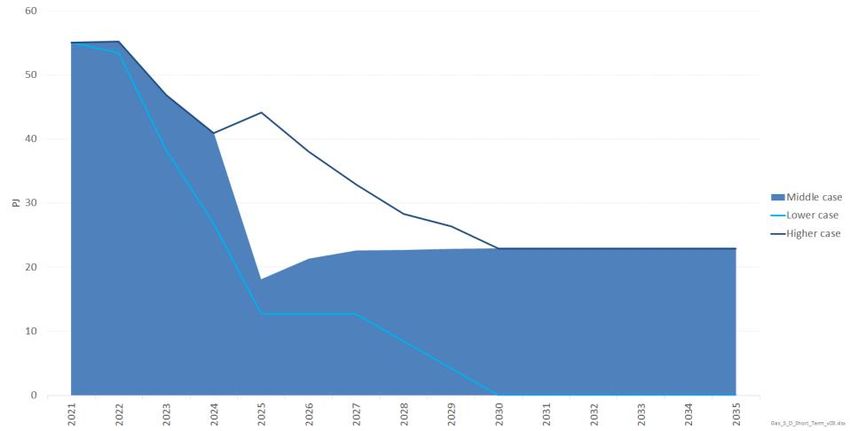
1 Executive summary                                                                                   Figure 1: Gas supply and demand balance for June-Sep 2021
This report was commissioned by Gas Industry Co to update the last bi-annual
gas demand and supply study produced in 2019. As with earlier reports, this
study examines the longer-term outlook for gas demand and supply. In
particular, we consider the outlook to 2035 under a range of scenarios.

Given the unusual conditions experienced in late 2020 and early 2021, this
report also examines the gas demand and supply position for the balance of
this year and into 2022 in some depth.

1.1     Gas supply for winter 2021 looks very tight
Gas supply is expected to be very tight relative to demand this winter (June to
September, inclusive).1 The tight supply situation is expected to contribute to
high wholesale2 gas and electricity prices. While high wholesale gas prices will
hurt users who are not protected by longer term contracts we think the tight
supply is unlikely to compromise physical gas security for mass market users
or for electricity generation.

Figure 1 sets out the key moving parts behind our analysis. The first column
shows a stack representing the expected demand for gas in winter 2021. The
red and green segments are comprised of relatively predictable residential,
commercial, industrial, and petrochemicals demand. These can be regarded
as firm sources of demand.3                                                                           Source: Concept analysis

The blue segments show potential demand that is increasingly uncertain                                The top green segment (with the dotted border) is the amount of gas the
because it depends on the need to run gas-fired power stations (including                             Waitara Valley methanol plant would have consumed had it not shut down
cogeneration). The navy segment shows gas demand in a ‘wet’ scenario (when                            from February 2021 due to lack of firm gas supply.
need for gas is lowest as there is ample hydro generation). The increasingly
                                                                                                      The second column shows the expected supply available from producing gas
lighter blue segments correspond to the rising gas demand as hydro
                                                                                                      fields and the Ahuroa gas storage facility. As shown, this level of supply is
conditions become drier.4
                                                                                                      unlikely to meet aggregate demand - even if this winter turns out to be very

1 June to September is typically the most challenging four-month period in a sustained ‘dry’ event.   4The modelled hydro generation is based on historical inflow sequences from 1980 to 2017, inclusive. The
2
  Wholesale in this context refers to sales in the spot market and for shorter term contracts.        ‘Dry’ and ‘Wet’ values correspond to the 10th and 90th percentile levels of hydro generation, respectively.
3 Firm in the sense that they will take gas, if it is available.

                                                                                                                                                                                                    1|P a g e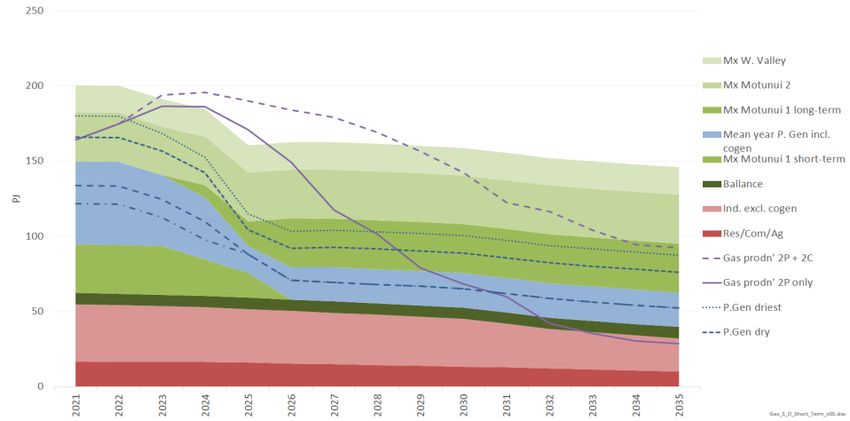
wet and gas demand for power generation is low. The size of the gap will                •    The pace of new renewable power station development in recent years
increase if New Zealand continues to experience dry conditions this winter.                  had been slowed by uncertainty over the future of the Tiwai aluminium
                                                                                             smelter. Absent this factor, more renewable generation would have been
While the chart shows a gap between potential gas demand and expected
                                                                                             onstream for this winter, lowering the demand for thermal generation.6
supply, we do not think this will compromise physical gas reliability to mass
market users or electricity generators. This is because:                                Figure 2: Supply-demand balance for Winter 2021 plus 'lost' supply
1) a significant amount of fuel for thermal generation can be provided by
   sources other than gas – principally coal-fired generation in the Huntly
   station Rankine units, and (to a much lesser extent) diesel-fired
   generation at Whirinaki and Huntly unit 6

2) there is the potential for some ‘demand diversion’ which could
   temporarily reduce gas and/or electricity demand and preserve supply for
   higher-value users. This could entail:

        a) some gas users reducing discretionary demand and on-selling some of
           their entitlement to gas-fired power stations; and/or

        b) some electricity consumers reducing discretionary demand.

Barring any major plant failure in the gas supply chain, we expect sufficient
gas to be available to meet demand. However, the tight supply position is
likely to contribute to sustained high wholesale gas and electricity prices –
reflecting the price needed to induce demand diversion.

1.2        Current tight supply reflects two unusual factors
We think the tight conditions for this winter reflect two unusual factors:

•       Unexpected major problems at New Zealand’s largest gas field, Pohokura.
                                                                                        Figure 2 shows the effect of these two factors. The column labelled ‘lost
        Despite efforts to address these issues, the field production capability is
                                                                                        supply’ shows the estimated impact of the Pohokura supply issues (in purple)
        expected to be around 50% of its previous levels this winter.5 The gas
                                                                                        and the delays in renewable generation development (in blue).
        supply outlook was already tight before this reduction occurred, so there
        was little buffer to cushion the unexpected cut in Pohokura supply.

5                                                                                       6
    When fully operational, roughly half of Pohokura’s gas comes from offshore wells.    This view is borne out by announcements to proceed with new generation developments by Contact and
                                                                                        Meridian shortly after the Tiwai smelter indicated it would continue operation until 2024 (or later).

                                                                                                                                                                                 2|P a g e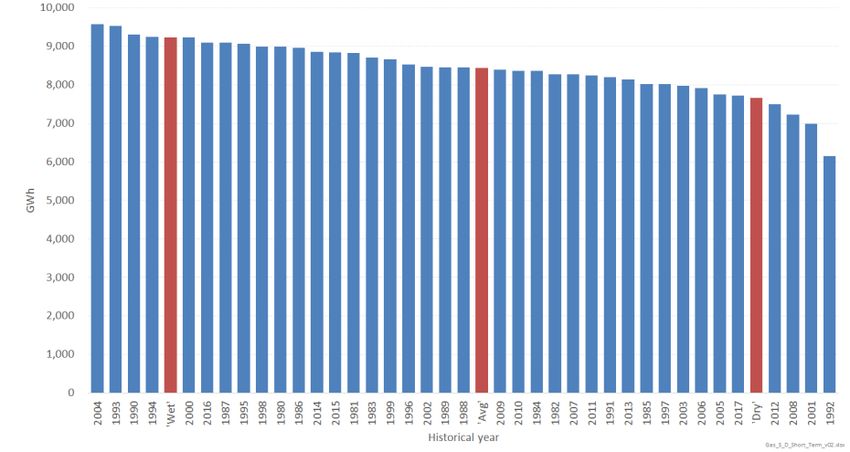
The combined impact tightens the gas supply demand balance by around 25                                         contingent resources are developed. It is also possible that there would be
PJ in winter. Had these factors not applied, there would have been ample gas                                    sufficient gas to operate a third unit, albeit on a less certain basis
supply, including in a dry year.7
                                                                                                                Ultimately, the availability of gas for all users depends on producers’
1.3      Outlook for 2022-2035                                                                                  willingness to invest more capital in supply-side assets. The investment
The tight supply conditions being experienced this year appear likely to                                        requirements are potentially very large. Gas Industry Co estimates the
continue into 2022. There is a possibility this will be avoided if remedial work                                industry needs to invest $300-500 million every 3 to 5 years to produce
at the Pohokura field can be undertaken over the coming summer. However,                                        existing reserves and maintain production levels.11 Some industry experts
the timing of this work is uncertain and even if it could be undertaken in the                                  project even higher requirements. For example, Enerlytica recently projected
coming summer there is no guarantee it will be successful.                                                      that over $2 billion would be required during the 2020s to maintain current
                                                                                                                production levels.12
By 2023-2024 there is more confidence that tight conditions will ease. This
reflects an expectation that planned work programmes at Kapuni, Kupe,                                           The level of investment will be influenced by wholesale customers’ willingness
Mangahewa, Maui, and Turangi will have been undertaken by then and will                                         to sign multi-year contracts. Looking forward, we expect mass market and
bring more gas to market.8 In addition, committed new renewable power                                           industrial gas customers to continue to be attractive to producers as a source
projects will be on stream, reducing mean gas demand for power generation.                                      of contracts to underpin investment. Similarly, we expect petrochemical
Together these factors are projected to lift supply available to other gas users                                producers (especially for methanol production) to remain as a foundation to
by around 30-45 PJ per year by 2024. If the Tiwai smelter closes at the end of                                  underpin investment in reliable gas supply.
2024 (the middle case assumption) that will further increase gas available to
                                                                                                                The demand segment that we think will have the greatest challenge in
other users.9
                                                                                                                securing gas is power generation. In particular, power generators may face
Looking out further, there is sufficient gas ‘in the ground’ to meet mass                                       increasing difficulty in contracting supply for the portion of their demand that
market, industrial and power generation demand until at least 2035. Out to                                      is unpredictable because producers will not invest in supply-side assets
2027, that production could come largely from existing reserves but beyond                                      without relatively firm sale commitments. The question then becomes how
then is likely to require development of contingent resources.10                                                power generators obtain their flexible fuel needs during the transition to
                                                                                                                100% renewable electricity – a transition that is expected to last for many
Moreover, there is likely to be sufficient headroom in the supply outlook to                                    years. This challenge will become even greater as Genesis reduces coal use at
support operation of 1-2 methanol units on a steady basis until at least 2030,                                  the Huntly power station.
depending on the rate at which other gas demand recedes and how quickly

7                                                                                                               9
  This is because the sum of the ‘missing supply’ bars plus the coal bar is sufficient to meet gas demand in      As we discuss later, Meridian Energy is actively pursuing initiatives to stimulate new sources of electricity
   even the driest situation. Furthermore, the supply position would likely have been even better than          demand, such as accelerating the uptake of electric boilers for industrial process heat. Growth in demand
   Figure 2 shows as Ahuroa would probably have more gas in storage. If it had been three-quarters full         from other sources may partially offset the effect of a Tiwai smelter closure.
   coming into this winter (a more likely ‘usual’ level) there would be an extra 8.5 PJ gas supply available.   10 See section 4.5.3 for more explanation.
8                                                                                                               11
  This work is reflected in various company statements and/or production forecasts compiled by MBIE and            Gas Industry Co, Briefing to Incoming Minister, October 2020, page 4.
released in mid-2020.                                                                                           12 Enerlytica, NZ Gas presentation to NZ Downstream 2021 Conference, March 2021.

                                                                                                                                                                                                                  3|P a g e
An added challenge in the current environment is that carbon and related           2 What this report is about
policies are yet to be finalised in many areas. Gas sector participants may
prefer to delay some decisions until policy is clearer. This could have supply-    2.1   Scope
side implications later in the decade depending on the scale of affected           This report was commissioned by Gas Industry Co to update the last bi-annual
projects and associated lead-times. These points highlight the importance of       gas demand and supply study produced in 2019. As with earlier reports, this
ensuring a smooth transition, but further exploration of these issues is outside   study examines the longer-term outlook for gas demand and supply. In
the scope of this report.                                                          particular, we consider the outlook to 2035 under a range of scenarios.

                                                                                   Given the unusual conditions experienced in late 2020 and early 2021, this
                                                                                   report also examines the gas demand and supply position for the balance of
                                                                                   this year and into 2022 in some depth.

                                                                                   2.2   Information sources
                                                                                   Concept has prepared this report based on public information sources, and
                                                                                   our own analysis of information from those sources.

                                                                                   We have also benefited from confidential information provided by industry
                                                                                   participants and wish to express our thanks for their cooperation.

                                                                                                                                                      4|P a g e
3 Outlook for 2021                                                                                       3.3     Gas supply capability for winter 2021
                                                                                                         For the major fields, supply estimates are based on discussions with operators.
3.1        Summary – outlook for 2021
                                                                                                         The estimates were provided on a confidential basis, but operators agreed
Gas supply is expected to be very tight relative to demand this winter (June to
                                                                                                         that they could be published in aggregate form. For smaller fields, estimates
September, inclusive).13 The tight supply situation is expected to contribute to
                                                                                                         are based on recent observed performance. We have also used historical and
high wholesale14 gas and electricity prices. While high gas prices will hurt
                                                                                                         recent OATIS data and other public sources as a cross check on this
wholesale customers who are not protected by longer term contracts, we
                                                                                                         information.
think the tight supply situation is unlikely to compromise physical gas security
for mass market users or for electricity generation.                                                     In aggregate, we estimate average injections into the transmission system to
                                                                                                         be 398 TJ/day over winter.15 This is around 100 TJ below the peak level of
The very tight conditions for this winter reflect two unusual factors:
                                                                                                         system production observed in calendar 2020. Most of the decline is due to
•       Unexpected major problems at New Zealand’s largest gas field - cutting                           reduced deliverability at Pohokura. There are also changes in expected
        national gas supply by around 15%.                                                               deliverability for other fields, but these largely offset each other.

•       Ongoing uncertainty about the Tiwai smelter’s future slowed the pace of                          The other main source of gas for the coming winter is the Ahuroa underground
        new renewable power station development in 2016-2020. Without this                               gas storage facility. Ahuroa is capable of delivering up to 65 TJ/day into the
        factor, more renewable generation would have been onstream for this                              pipeline system. However, this can only be sustained if the facility has
        winter, lowering the demand for gas-fired generation.                                            sufficient gas in storage at the outset of winter to maintain that level of
                                                                                                         withdrawal.
Had these factors not applied, there would have been ample gas supply,
including in a dry year.                                                                                 We have used public disclosures to estimate the volume of gas that will be in
                                                                                                         storage at the beginning of June 2021. We estimate this will be around 3.5 PJ.
3.2        Methodology focuses on critical winter months                                                 Based on this volume, the average rate of withdrawal available from Ahuroa
We focus on the balance between gas supply and demand in the June to                                     over the winter is 30 TJ/day.
September months – which we refer to as ‘winter’. History shows gas demand
is typically highest in these months due to increased space and water heating                            Based on the above data, we have calculated the volume of gas available for
requirements. In addition, power generation demand for gas generally also                                delivery in the period June to September 2021. The respective estimates are
peaks in these months because it is colder (lifting power demand) and ‘dry                               48.6 PJ from production and 3.5 PJ (net) from Ahuroa storage.
years’ disproportionally reduce hydro generation in winter.                                              3.4     Gas demand for winter 2021
In the following sections we describe the methodology we have used to                                    Estimates for each major segment of gas demand have been compiled using
prepare gas demand and supply projections for the 2021 winter months.                                    the approach set out below.

13                                                                                                       15
     June to September is typically the most challenging four-month period in a sustained ‘dry’ event.     Note that this figure excludes flows of gas which do not enter the open access transmission system, such
14   Wholesale refers to sales in the spot market and for shorter term contracts.                        as any gas flowing from Kapuni to the cogeneration plant at Whareroa.

                                                                                                                                                                                                       5|P a g e
3.4.1 Gas demand for residential/commercial/agricultural users                                      for refined product in 2021, especially aviation fuel. The resulting overall
Although data on gas consumption by residential, commercial and agricultural                        demand estimate for industrial users (ex petrochem) is 5.2 PJ for winter 2021.
users is not available on a monthly basis, pipeline flow data for so-called
                                                                                                    3.4.3 Petrochemical manufacturing
allocated gates is a reasonable proxy. These allocated gates are the points on
                                                                                                    We define petrochemical demand as gas use at the Kapuni ammonia urea
the pipeline system that interconnect with distribution networks and typically
                                                                                                    plant (owned by Ballance) and the Waitara Valley and Motunui methanol
serve residential, commercial and agricultural users.
                                                                                                    plants (owned by Methanex).
Allocated gate data is available for daily flows. Examination of this data shows
                                                                                                    We estimated demand for ammonia urea manufacturing using the same
a distinct seasonal profile which typically peaks in winter. However, the size
                                                                                                    approach as large industrial users. The resulting estimate is 2.5 PJ for winter
and timing of the peak can vary from year to year. To compile our demand
                                                                                                    2021.
estimate, we reviewed historical data to identify the period with the highest
gas flows over four consecutive months. We considered data from 2018 to                             Our approach to projecting Methanex’s demand differs from other segments
2020 to account for year-to-year variation and avoid reliance on the 2020 data                      because methanol production levels are typically quite sensitive to gas supply
which may have been affected by the aftermath of the Level 4 Covid-19                               conditions. Indeed, Methanex in February 2021 announced that it would
lockdown. The peak demand was 13.1 PJ recorded in the 4 months to                                   mothball the Waitara Valley plant until further notice due to gas supply
September 2019, although the prior and subsequent years were quite similar.                         constraints.17 We have projected gas demand in winter 2021 based on two
                                                                                                    distinct tranches:
3.4.2 Gas demand for larger industrial users (except petrochemicals)
A similar approach was used for larger industrial users excluding                                        •    Gas use at the Motunui plants is projected to be up to 178 TJ/day
petrochemicals (e.g. food processing, steel making, pulp and paper making).                                   (=peak usage observed in January 2021) multiplied by 122 days (the
                                                                                                              number of days in June-September). This equates to 21.7 PJ over
We reviewed daily gas flow data since 2018 to identify the period with the                                    winter 2021.
highest flows. In this case we focussed on the four months beginning in June                             •    Gas use at the Waitara Valley plant is projected to be zero as per
(rather than any consecutive four months) because demand for these users                                      Methanex’s announcement in February 2021. However, if the plant
tends to peak outside the winter period.16 The peak demand was 6 PJ recorded                                  were to operate, we expect it would use up to 50 TJ/day which
in the 4 months to September 2019, although the prior year was quite similar.                                 equates to 6.1 PJ over winter 2021.
Demand in 2020 was 5.5PJ and may have been affected by Covid-19 lockdown
                                                                                                    3.4.4 Gas demand for power generation
measures.
                                                                                                    We separate gas demand for electricity generation into two components –
We reduced this estimate by 0.8 PJ to reflect an assumption that gas use at                         cogeneration and remaining gas demand for power stations. Cogeneration
the Marsden Point refinery will be around 50% of levels recorded prior to                           refers to plants in which gas is used to create process heat (for an associated
2020. This assumption appears reasonable in light of continuing weak demand                         industrial use such as food processing) and to generate electricity.18 Gas use

16                                                                                                  18
     This is likely to be due to reduced processing of dairy products in the winter period.           There are various definitions for cogeneration, and the demarcation between a cogeneration plant and
17   See www.rnz.co.nz/news/business/437055/methanex-to-mothball-waitara-valley-plant-in-taranaki   a power station is not always clear.

                                                                                                                                                                                              6|P a g e
for cogeneration has been fairly stable over time and we have used historical Figure 3: Winter hydro electricity generation
data to forecast cogen gas demand for winter 2021.
The remaining gas demand is more complex to forecast because it is strongly
influenced by hydro inflows and storage levels. This means observed demand
since 2018 does not provide a robust indicator of the possible gas demand in
an extended dry period. A further complicating factor is that some thermal
power stations can run on coal or diesel, and higher operation from these fuels
will reduce the need for gas-fired generation, all other factors being equal.
We start by using recent electricity sector data to estimate the expected need
for ‘responsive’ generation in winter 2021. This is estimated by taking the
difference between projected electricity demand and ‘non-responsive’
sources of supply such as wind farms (which have intermittent output) and
geothermal plants (which tend to run constantly at or close to full output).
Source: Concept analysis
The requirement for responsive generation in winter 2021 can be met by
hydro- or thermal-power stations. Figure 3 shows the level of winter hydro For our analysis, the “wettest” scenario reflects the highest level of hydro
generation over 38 years. It clearly shows how hydro generation can vary generation observed in the 38 years. The “wet” hydro scenario reflects the
depending upon starting storage and the level of hydro inflows over winter. 10th highest percentile of hydro generation. The “mean” hydro scenario uses
We consider this dataset to be sufficiently long to capture a representative the average. The “dry” hydro scenario reflects the 10th lowest percentile of
range of hydro storage and inflow conditions. hydro generation. The “driest” scenario uses the lowest observed hydro
generation.
The balance of New Zealand’s responsive generation requirement for winter
2021 will need to be met from thermal power stations. We estimate that
around 12 PJ could be met by coal fired generation in Huntly Rankine units.
We estimate that approximately 30 GWh of electrical energy can be supplied
by the diesel-fired Whirinaki station during winter period. This figure aligns
the amount of energy Transpower assumes can be supplied by Whirinaki in its
security of supply monitoring,19 and reflects potential fuel constraints
encountered when running Whirinaki at a high output.
19 See www.transpower.co.nz/system-operator/security-supply/hydro-risk-curves-explanation
7|P a g e3.5 Gas supply will be tight for winter 2021 Figure 4: Supply-demand balance for Winter 2021
Figure 4 draws the supply and demand estimates together. The first column
shows a stack representing the expected demand for gas in winter 2021. The
red and green segments are comprised of relatively predictable residential,
commercial, industrial, and petrochemicals demand. These can be regarded
as firm sources of demand.20
The blue segments show potential demand that is increasingly uncertain
because it depends on the need to run gas-fired power stations (including
cogeneration). The navy segment shows gas demand in a ‘wet’ scenario (when
need for gas is lowest as there is ample hydro generation). The increasingly
lighter blue segments correspond to the rising gas demand as hydro
conditions become dryer.
The top green segment (with the dotted border) is the amount of gas the
Waitara Valley methanol plant would have consumed had it not shut down
from February 2021 due to lack of firm gas supply.
The second column shows the expected supply available from producing gas
fields and the Ahuroa gas storage facility. As shown, this level of supply is
unlikely to meet aggregate demand - even if this winter turns out to be very
wet and gas demand for power generation is low. The size of the gap will
increase if New Zealand experiences a dry winter.
While the chart shows a gap between potential gas demand and expected
supply, we do not think this will compromise gas supply to mass market users
or electricity generators. This is because:
1) a significant amount of fuel for thermal generation can be provided by
sources other than gas – principally coal-fired generation in Huntly
Rankine units, and (to a much lesser extent) diesel-fired generation at
Whirinaki or Huntly unit 6
20 Firm in the sense that they will take gas if it is available.
8|P a g e2) there is the potential for some ‘demand diversion’ which could Figure 5: Spot and forward gas prices
temporarily reduce gas and/or electricity demand and preserve supply for
higher-value users. This could entail:
a) some gas users reducing demand and on-selling some of their
entitlement to gas-fired power stations
b) some electricity consumers reducing demand.
Barring any major plant failure in the gas supply chain, we expect sufficient
gas to be available to meet physical demand for residential, commercial and
small industrial users. However, the tight supply position is contributing to
high prices for gas in the spot market and for shorter term contracts. These
high prices will hurt gas users who are not protected by longer term contracts.
This issue is particularly relevant for wholesale customers on fixed term
contracts which are coming to an end and who face sizeable price increases
due to much tighter supply conditions.
Source: Concept analysis of emsTradepoint data and MBIE data
Another factor contributing to higher gas spot prices is the recent increase in
gas demand for power generation to offset lower hydro generation caused by Having said that, it is important to note that most gas customers do not pay
drought conditions. Tight supply in the electricity market has raised wholesale the spot price for gas. Indeed, spot trades traditionally account for less than
electricity prices and increased the ability of generators to pay for gas. 5% of total gas sales. Most customers prefer to enter into contracts with a
supplier ahead of the gas delivery date and pay the price agreed in the
The expectation of continuing high gas spot prices for 2021 (especially in
contract. Although contract prices are confidential to the counterparties, the
winter) is borne out by market data. Figure 5 shows spot gas prices (a 30-point
so-called ‘wholesale natural gas price’ published by MBIE each quarter is a
moving average in red) for the period up to 31 March 2021. From that date
fairly good proxy for the prevailing gas price for large contracts.
forward, the chart shows forward prices for gas deliveries later in 2021 (in
green). As shown in Figure 5, contract prices are much less volatile than spot prices.
At times spot prices have been below contract prices such as 2016-2017 when
There has been a clear rise in gas spot prices in the early part of 2021. This
there was ample supply. In the last two years spot prices have been above
coincides with the confirmation that ongoing supply problems are expected
contract prices reflecting tight supply. Customers (and suppliers) who chose
at Pohokura for 2021 and continuing dry conditions. The chart also shows that
not to contract ahead will be exposed to spot prices, which may turn out to
gas prices for short term contracts in winter are also high, reflecting an
be higher or lower than contract prices. Similarly, gas customers who have
expectation of rising gas demand with winter.
contracted for gas can choose to sell some at the spot price if they are able to
reduce their usage.
9|P a g eAnother indicator which indirectly supports the expectation of continuing high • industrial gas users may not be able to alter their gas demand because
gas prices in the spot market in 2021 is the forward contract price for of the notice periods needed to ramp production up or down
electricity. As shown in Figure 6, electricity contract prices for winter 2021 are • altering industrial production levels (and gas use) may disrupt product
above $250/MWh. After allowing for other operating costs, the implied supply chains, cause a loss of contracts, adversely impact on plant life
breakeven fuel price that gas-fired generators could pay for gas is above or maintenance costs, or have health and safety implications. This in
$20/GJ, depending on conversion efficiency. turn may mean that a turn down needs to meet minimum volume
and/or duration requirements to recover the associated costs
Figure 6: Electricity prices and estimated value of gas for power generation • the ability to turn down will be affected by the starting position of a
gas user. If it is already running close to its minimum stable demand,
$40 $400
it will have little or no ability to turn down further
Gas netback • industrial users may face different reporting requirements if they are
$35 $350
considered to be trading gas, making them reluctant to sell gas unless
ASX Otahuhu prices
Electricity contract price $/MWh
$30 $300 there is a core operational reason for doing so.
Gas netback value $/GJ
$25 $250 More generally, electricity sector participants will likely also be considering
$20 $200 non-gas sector options if conditions remain very dry, such as reducing
$15 $150
aluminium production at Tiwai. There is also a possibility that a large inflow
event will suddenly change the outlook (though the probability declines as
$10 $100
winter approaches as precipitation will fall as snow). All of these factors are
$5 $50
examples of ‘frictions’ which apply to real-world decisions, and which may
$- $- hinder gas diversion which otherwise appears economic to undertake.
Apr-21 May-21 Jun-21 Jul-21 Aug-21 Sep-21 Oct-21 Nov-21 Dec-21
Elec and gas data.xls
In summary, if it remains dry power generators are likely to continue to bid
Source: Concept analysis of data as at 8 April 2021. Values quoted on a carbon inclusive basis to be comparable to eTp spot prices.
aggressively for any discretional gas that becomes available. This includes gas
that arises from demand diversion by other gas users. While this dynamic
If current market conditions continue, power generators are likely to be able helps to keep the lights on, it is painful for wholesale gas customers not
to offer high gas purchase prices to encourage some other gas users to scale covered by existing longer-term contracts. In particular, commercial and
back their demand, allowing gas to be diverted to power generation. industrial customers whose existing term contracts are coming to an end will
Historically, very large gas users (especially Methanex) have been among the often face a difficult choice between re-contracting at a much higher price,
most important sources of such demand response. taking spot exposures or scaling back their operations to reduce gas usage.
However, even though generators may have an apparent ability to pay a high 3.6 Peak daily demand
gas price to encourage gas diversion from other large industrial users, it may
The preceding analysis focuses on whether sufficient gas will be available to
not always occur. The reasons include:
maintain security of supply over the winter months if there is high demand for
gas-fired generation due to dry conditions.
10 | P a g eA distinct but related question is whether security can be maintained on a day demand tends to be more sensitive to gas market conditions than that of
if there is extremely high gas demand. For example, this could arise due to a other users. Given the tight conditions expected throughout winter 2021, we
combination of extremely cold weather (lifting heating demand for gas) and consider it reasonable to exclude their usage when seeking to estimate the
sustained calm and dry conditions (lifting power demand for gas). level of peak ‘firm demand’ in 2021.
To examine this issue, we compare the peak system-wide daily demand for The peak day in 2018-2020 was on 16 July 2020. Our peak daily demand
gas with the combined supply from all gas sources. We start by looking at estimate for residential, commercial and industrial users (labelled “mass
historical data for 2011 to 2020. We use published data for withdrawals from market & industrial” on the chart) is the level of usage observed on that day.
the national pipeline system to represent demand, noting this may not The only adjustment made to this figure is to reduce demand at the Marsden
capture all gas flows (e.g. from Kapuni to the Whareroa cogen plant). Point refinery by 50% as discussed in section 3.4.2.
In addition, it is important to note the system peak demand includes the effect Likewise, we adopt the demand levels observed on 16 July 2020 for Ballance
of diversity, i.e. users do not all have their peak use on the same day. The and gas-fired generation as their respective peak daily estimates for 2021. The
estimated supply deliverability is based on the P99 output for each gas source, resulting figure for gas-fired generation is 172 TJ. As a point of comparison,
and the combined total is used to represent potential daily supply. This the absolute level of peak demand for gas-fired generation (excluding Huntly
assumes there is no diversity effect to consider on the supply side of the Rankine units) in 2018-2020 is 180 TJ which occurred on 31 January 2018. We
system. have not used that figure because we understand coal operation at Huntly
may have been restricted at the time, increasing the need for other gas-fired
To estimate the supply position in winter 2021, we start with the estimated
generation. Coal restrictions are not expected to apply in winter 2021, given
peak deliverability from supply sources. For gas fields, we have used the
our understanding that Genesis is likely to be able to import sufficient coal to
average daily deliverability estimates adopted for the analysis in section 3.3.
meet its needs.21
We consider this to be reasonable given that very tight supply conditions
means that fields will run at (or very close) to full output on most days. In any case, had we adopted the slightly higher figure it would not materially
alter the results of the overall analysis. For completeness, we note that the
For Ahuroa, we assume that deliverability on the peak day will be 65 TJ rather
generation estimate assumes that the Huntly Rankine units will be running
than the average winter level of 30 TJ/day. This is because we expect average
entirely on coal if they are required. That assumption appears reasonable in
withdrawals over winter to be limited by the gas available in storage, whereas
light of the announcement by Genesis that it would prepare three Rankine
peak deliverability will be limited by the physical capacity of the compressors
units for potential coal-fired operation for this winter.
and related plant at Ahuroa.
The other source of gas demand to consider is methanol production. We have
For demand, we start by identifying the day in 2018-2020 when the combined
assumed that demand to be 178 TJ/day for the reasons set out in section 3.4.3.
demand from all gas users except Huntly Rankine units and Methanex reached
its peak level. We exclude these two users because as discussed earlier, their
21If Genesis did face constraints on its ability to obtain coal supplies, this would increase gas demand (all
other factors being equal) and have a material adverse effect on the gas supply/demand outlook for winter
2021.
11 | P a g eFigure 7: Estimated peak daily demand and deliverability costs. For this reason, if such response occurred, we expect that it would be
800
accompanied by very high spot prices for gas.
700
3.7 Current tight supply reflects two unusual factors
Daily demand/supply (TJ/day)
600
We think the tight conditions for this winter reflect two unusual factors:
500
400
• Unexpected major problems at New Zealand’s largest gas field, Pohokura.
300
Despite efforts to address these issues, the field production capability is
200
expected to be around 50% of its previous levels this winter.24
100 • The pace of new renewable power station development has been slowed
0 by uncertainty over the future of the Tiwai aluminium smelter. Absent this
2011 2012 2013 2014 2015 2016 2017 2018 2019 2020 2021
factor, more renewable generation would have been onstream for this
Historical peak demand Mass market & industrial Ballance
Generation Methanex Total Supply winter, lowering the demand for thermal generation.25
Source: Concept analysis
The resulting peak demand and deliverability estimates are shown in Figure 7.
The analysis indicates there was a positive deliverability margin of around 10-
15% in most years between 2011 and 2020.22 However, there is a marked
change in 2021. Indeed, if all gas users operate consistent with the estimates
noted above, projected deliverability in winter 2021 would fall short of peak
demand by around 80 TJ/day.
As noted earlier, Methanex’s gas demand has generally been responsive to
short-term emergency gas system conditions in the past. While there is no
certainty of such response in winter 2021, if demand response did occur there
would be sufficient deliverability to satisfy peak demand for all other gas users
while maintaining some gas for Methanex.23 Having made this observation,
flexing gas use would undoubtedly disrupt Methanex’s operations and impose
22The headroom was much higher in the 2016, in part due to retirements of thermal power stations. 24
When fully operational, roughly half of Pohokura’s gas comes from offshore wells.
23We note that Methanex is not the only user which tends to respond to system conditions. Some other 25
This view is borne out by announcements to proceed with new generation developments by Contact and
gas users reduce their demand by deferring usage or switching to alternative fuels at times. However, those Meridian shortly after the Tiwai smelter indicated it would continue operation until 2024 (or later).
effects should already be captured in the peak demand estimates derived from analysis of historical data.
12 | P a g eFigure 8: Supply-demand balance for Winter 2021 plus 'lost' supply
Figure 8 shows the effect of these two factors. The column labelled ‘lost
supply’ shows the estimated impact of the Pohokura supply issues (in purple)
and the delays in renewable generation development (in blue).
The combined impact tightens the gas supply demand balance by around 25
PJ in winter. Had these factors not applied, there would have been ample gas
supply, including in a dry year.26
26
This is because the sum of the ‘missing supply’ bars plus the coal bar is sufficient to meet gas demand in Figure 8 shows as Ahuroa would probably have more gas in storage. If it had been three-quarters full
even the driest situation. Furthermore, the supply position would likely have been even better than coming into this winter (a more likely ‘usual’ level) there would be an extra 8.5 PJ gas supply available.
13 | P a g e4 Outlook for 2022-2035 Ultimately, the availability of gas for all users depends on producers’
willingness to invest more capital in supply-side assets. The investment
4.1 Summary – outlook for 2022-2035 requirements are potentially very large. Gas Industry Co estimates the
The tight supply conditions being experienced this year appear likely to industry needs to invest $300-500 million every 3 to 5 years to produce
continue into 2022. There is a possibility this will be avoided if remedial work existing reserves and maintain production levels. Some industry experts
at the Pohokura field can be undertaken over the coming summer. However, project even higher annual requirements. For example, Enerlytica recently
the timing of this work is uncertain and even if it could be undertaken in the projected that over $2 billion would be required during the 2020s to maintain
coming summer there is no guarantee it will be successful. current production levels.
By 2023-2024 there is more confidence that tight conditions will ease. This The level of investment will be influenced by wholesale customers’ willingness
reflects an expectation that planned work programmes at Kapuni, Kupe, to sign multi-year contracts. Looking forward, we expect mass market and
Mangahewa, Maui, and Turangi will have been undertaken by then and will industrial gas customers to continue to be attractive to producers as a source
bring more gas to market.27 In addition, committed new renewable power of contracts to underpin investment. Similarly, we expect petrochemical
projects will be on stream, reducing mean gas demand for power generation. producers (especially for methanol production) to remain as a foundation to
Together these factors are projected to lift supply available to other gas users underpin investment in reliable gas supply.
by around 30-45 PJ per year by 2024. If the Tiwai smelter closes at the end of
2024 (the middle case assumption) that will further increase gas available to The demand segment that we think will have the greatest challenge in
other users.28 securing gas is power generation. In particular, power generators may face
increasing difficulty in contracting supply for the portion of their demand that
Looking out further, there is sufficient gas ‘in the ground’ to meet mass is unpredictable because producers will not invest in supply-side assets
market, industrial and power generation demand until at least 2035 (and likely without relatively firm sale commitments. The question then becomes how
significantly beyond). Out to 2027, that production could come largely from power generators obtain their flexible fuel needs during the transition to
existing reserves but beyond then is likely to require development of 100% renewable electricity – a transition that is expected to last for many
contingent resources. years. This challenge will become even greater as Genesis reduces coal use at
Moreover, there is likely to be sufficient headroom in the supply outlook to the Huntly power station.
support operation of 1-2 methanol units on a steady basis until at least 2030, An added challenge in the current environment is that carbon and related
depending on the rate at which other gas demand recedes and how quickly policies are yet to be finalised in many areas. Gas sector participants may
contingent resources are developed. It is also possible that there would be prefer to delay some decisions until policy is clearer. This could have supply-
sufficient gas to operate a third unit, albeit on a less certain basis. side implications later in the decade depending on the scale of affected
projects and associated lead-times. These points highlight the importance of
27This work is reflected in various company statements and/or production forecasts compiled by MBIE and 28As we discuss later, Meridian Energy is actively pursuing initiatives to stimulate new sources of electricity
released in mid-2020. demand, such as accelerating the uptake of electric boilers for industrial process heat. Growth in demand
from other sources may partially offset the effect of a Tiwai smelter closure.
14 | P a g eensuring a smooth transition, but further exploration of these issues is outside 4.3 Gas supply scenarios for 2022-2035
the scope of this report. We have developed a range of scenarios for gas supply capability31 in the
2022-2035 period. These scenarios are intended to span the plausible range
4.2 Projections consider a range of supply and demand scenarios
of supply from domestic sources.
In this chapter we look further ahead to the period from 2022 to 2035. Gas
demand and supply in these years will be strongly influenced by decisions that We have given separate consideration to gas supply from reserves and
have yet to be made. On the supply side, producers will be making decisions contingent resources. Reserves have a higher level of certainty because they
about whether to commit capital to produce from existing reserves and to are identified accumulations that have already been assessed as commercially
convert undeveloped (but identified) gas resources into reserves. justified for production. Having said that, there is still uncertainty about the
volume of gas which may be recovered. In addition, market conditions can
Similarly, major gas users will be making decisions on whether to commit
change in the future which can alter the commercial status of a project to
capital expenditure to allow future use of gas in their facilities. The investment
produce gas.
requirements are potentially very large. Gas Industry Co has estimated that
the industry needs to invest $300-500 million every 3 to 5 years to produce Contingent resources are also known accumulations of gas, but these are not
existing reserves and maintain production levels.29 Some industry experts currently assessed as commercially justified for production. This means there
project even higher annual requirements. For example, Enerlytica recently is more uncertainty about their future contribution to supply.
projected that over $2 billion would be required during the 2020s to maintain
In principle, gas may also be supplied from sources that are yet to be identified
current production levels.30
– such as new onshore fields or as-yet unidentified accumulations in existing
Given the uncertainties applying during this period, we have used scenario- fields. We have not made any assumptions about future supply from these
based approaches to examine possible outcomes. These scenarios are sources, although the pattern of updates from past disclosures of reserves and
necessarily broad brush in nature, and should be interpreted as representing resources would suggest that there is likely to be material additional potential
different possible future states for the gas sector. It is important to emphasise gas from both these sources.
that the scenarios are not based on detailed bottom-up forecasts – especially
Finally, gas could be imported if required. The latter source is not limited by
on the supply-side of the industry.
supply-side factors, but rather viability depends on commercial factors.
The scenarios focus on annual demand and supply, rather than winter or peak
In the next sections we describe how the estimates of supply capability from
daily measures. This is because there is too much uncertainty to make robust
existing reserves and resources have been compiled.
projections of winter or peak demand. The only exception is winter 2022. This
period is little more than a year away allowing us to make reasonable 4.3.1 Base case - gas supply from existing 2P reserves
estimates of the winter supply margin. The gas production profiles released by MBIE in July 2020 are the foundation
for developing the scenarios. The profiles published by MBIE show field
29 31
Gas Industry Co, Briefing to Incoming Minister, October 2020, page 4. The charts that follow show scenarios of gas supply capability. The volume of gas which is produced in a
30 Enerlytica, NZ Gas presentation to NZ Downstream 2021 Conference, March 2021. given year could be lower than the supply capability.
15 | P a g eYou can also read