Nordic PPAs - Effects on renewable growth and implications for electricity markets - Oxford Institute for Energy Studies
←
→
Page content transcription
If your browser does not render page correctly, please read the page content below
February 2021

                                                                                          Nordic PPAs –
                                       FCEffects
                                          Heading       Heading
                                                 on renewable growth
                        and implications forFCelectricity  markets
                                               Subheading Subheading

    1. Nordic renewable growth and the emergence of PPAs

    The Nordic power market has stood out in its European context as an early example of cross-boundary
    market integration and strong renewable growth. Hence, it is being looked to for inspiration by many
    throughout Europe, as being able to blend the basis of an energy-only market, with very high growth
    levels in intermittent renewable power generation. Furthermore, the Nordic market has, over the past
    decade, seen support schemes for renewable expansion being rolled back and becoming increasingly
    irrelevant, while renewable growth has continued to expand. 1
    The need to find methods to channel investments into renewable power production which are
    independent from government schemes has led to the evolution of a specific long-term Power Purchase
    Agreement (PPA) with additionality which, in the Nordic context, and particularly in Sweden, has come
    to mean that the investment or purchase helps generate the construction of new renewable capacity,
    see Figure 1.
    PPAs have not traditionally been a contract form exclusive to renewable power production. They have,
    rather, been a relatively standard form of long-term contract structure, historically associated both with
    the nuclear, as well as the hydropower sectors within the Nordic power market. Long-term contracts do
    exist in some form or another in most other energy and commodity markets, offering stability, risk
    hedging, and a planning horizon for actors. In the Nordic market and regulatory environment, PPAs
    have, however, evolved to serve not only as a tool for providing cash flow certainty to investors, lenders,
    and producers, but also price certainty to buyers. Partly through the development of the additionality
    component, they have also become an efficient tool for the transfer and maximization of green benefits
    between contract parties.

    1
     Energimyndighetens stöd till vindkraft, Swedish Energy Agency, ER 2015:16, p. 5 and Kortsiktig Marknadsanalys 2020,
    Energiläget 2020, Swedish Energy Agency, ET2020:1, p. 16–19. For a cursory overview of the Swedish power system and
    market, see also Energy in Sweden 2020 – An Overview, ET2020:11.

Energy Insight 84
 SHORT PAPER:                                                                                 Elin Akinci, ELS Analysis
                                                                                                               Author
                                                                                           Samuel Ciszuk, ELS Analysis

                                                                                                  , Research Fellow, OIES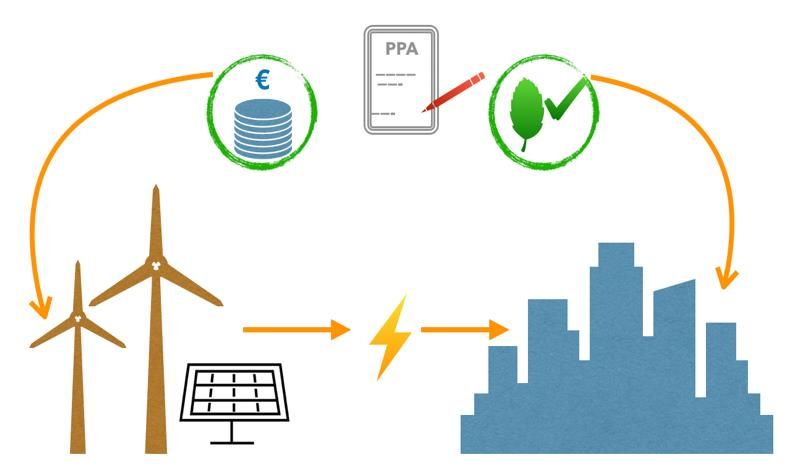
Figure 1: Nordic wind power installations, cumulative and growth in 2019

Source: Wind Europe

This paper’s focus is on the Nordic power market but, within that market, specifically on the Swedish
power system which, for about two decades, has seen high growth in renewable production, chiefly in
onshore wind.2 This growth has taken off even further over the past decade, since the government
support system of Green Certificates was allowed to become irrelevant to the market. So much new
wind capacity had been coming onstream that an oversupply of certificates was created, and
rebalancing the system would have proven very costly, while bringing little benefit. 3 Today, as detailed
below, construction of new wind capacity takes place without direct government support. The increasing
levels of intermittent production are, however, continuing to grow in the face of collapsing power prices,
which increasingly feeds a system-wide cannibalization trend, where stable plannable production
capacity is being squeezed out. At the same time, renewable production capacity keeps being signed
on the basis of PPAs which have not seen price declines corresponding to the price falls in the spot
market. This raises the question of whether PPAs with additionality 4 (meaning that new renewable
projects are being built as a result of the PPA) create a subset of the power market on both the buy and
sell sides which is to some extent shielded from the market’s price signal.

2
  Energiläget 2020, Swedish Energy Agency, ET2020:1, p. 12–15 and the report’s statistical supplement Energiläget i siffror
2020.
3
  ‘Aktörer ifrågasätter rimligheten med elcert i 15 år till’, Montel News, 7 October 2020 and ‘Priskollaps i elcertifikatsystemet’,
Sveriges Radio, 19 February 2020.
4
  ‘Additionality’ in the Swedish context has come to mean that a PPA is tied to new renewable capacity construction; in other
words, not just to renewable capacity which results in growth of the overall renewable market share.

    The contents of this paper are the authors’ sole responsibility. They do not necessarily represent the views                      2
                          of the Oxford Institute for Energy Studies or any of its Members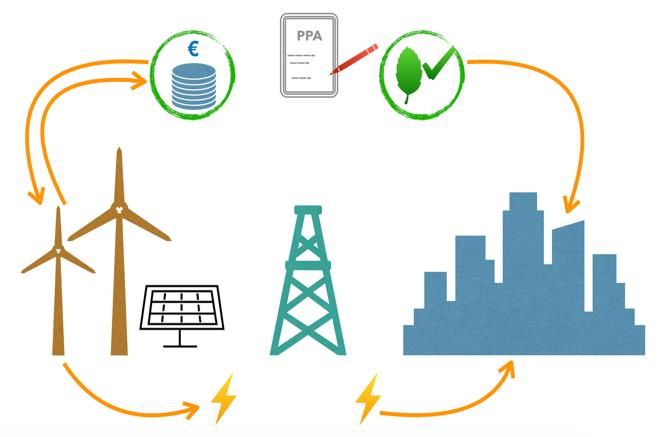
Swedish wind power capacity has been growing noticeably for about two decades, increasing
significantly after a Green Certificate scheme was launched in 2003. By 2006 it had garnered serious
investor interest and political credibility, which set the wind power sector off on a very high growth
trajectory. Wind power growth was between 30 and 43 per cent every year until 2012, with installed
capacity growing from 822 MW in 2007 to 3,607 MW in 2012 (see Figure 2). This fast growth then
plateaued somewhat, particularly after 2014, as wind power capacity had outgrown the certificate
allowance. Some attempts to reform the system, to catch up with the previous growth, were made, but
with the exception of 2018–2019, the prices of Swedish Green Certificate (see Figure 3) have been
virtually irrelevant in contributing to growth since 2016. 5 From around 2013 and onwards, new types of
deals, based on private-sector bilateral PPAs with additionality, started to gain prominence in the
Nordics, initially driven by high-profile multinationals like Google and IKEA. These types of deals spread
quickly and came to deliver an increasing amount of the growth that has been achieved in wind power
expansion since 2013–2014, when the initial green PPAs were first widely noticed. 6
Figure 2: Total installed wind power capacity in Sweden and yearly wind power capacity
growth rates 2007–2023 (forecast)

Source: ELS Analysis, Refinitiv

The lack of transparency in the PPA market means that the exact part it has played in the growth of
wind power capacity is hard to quantify, particularly since a PPA-based project will still be drawing
Green Certificates as applicable. The wind power capacity growth rate in relation to the Green
Certificate price will, however, reveal some of the key trends in question. Green Certificate prices under
200 SEK/MWh have been a harbinger of plunging wind power growth rates, with a delay of one to two
years. The initial, widely talked about, early renewable PPAs (signed in 2012–2013) started being
visible in the growth of installed capacity during 2014, but these represented more of a blip. At the same
time, some hopes for a regulatory tightening of the Green Certificate system helped raise prices for
early 2013 (as seen in Figure 3), although this effect proved rather short lived. Consequently 2015–
2017 saw lower wind capacity growth rates, yet the increased growth seen in 2018 had seen no Green
Certificate price foundation in the previous two years. Green Certificate prices then again spiked
momentarily in 2018–2019, due to a mixture of attempts to reform the system and some very supportive
weather events, but this effect did not last long enough, nor was it sufficiently high on its own, for many

5
  Revised regulations for the Green Certificate scheme were passed by the Swedish parliament in 2015 and again in 2017,
raising the mandatory certificate quotas in line with rising renewable targets.
6
  ‘Miljarder står på spel om svensk vindkraft’, Dagens Nyheter, 4 November 2019; ‘Utländska investerare tror på förnybar
energi’, Dagens Industri, 29 May 2013 and ‘Svensk vindkraft ska driva Googles finska datacenter’, news item from 4 June 2013
on Swedish Wind Energy Association’s website (svenskvindenergi.se).

    The contents of this paper are the authors’ sole responsibility. They do not necessarily represent the views               3
                          of the Oxford Institute for Energy Studies or any of its Members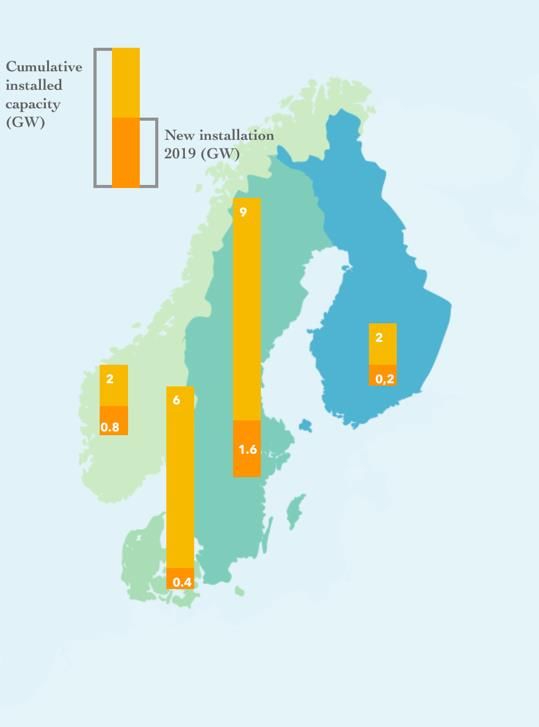
more long-term investment decisions to be made.7 Something else was clearly driving the market from
the middle of the decade and was resulting in the growth rates for installed wind capacity seen from
2018 onwards. This can only have been the emergence of the PPA structure as a tool enabling growth
and secure investments, since there were no other major factors involved during this period. Interviews
with actors and stakeholders, undertaken by the authors, underline this, with representatives from the
banking sector even spelling out the fact that no bank in the Nordic region has entered into the financing
of a wind project without it having some form of PPA structure at its base.
Figure 3: Price development for Swedish Green Certificates (Elcertifikat) 2007–2020

Source: ELS Analysis, Refinitiv

As shown in Figure 2, since 2015 total installed wind capacity in Sweden has grown from 6,029 MW,
to 9,061 MW in 2019, with the installed capacity for 2020 likely coming in very near 10,826 MW, while
the outlook for 2023, based on projects with FID, appears to be coming in at 15,672 MW. This means
that growth rates for new wind capacity installation have returned to levels of around 20 per cent for the
2019–2021 time period, with some signs even pointing to growth levels having to be revised up further
for 2022–2023, as more FIDs are taken on projects with relatively quick turnarounds.
From a system perspective, wind power production is expected to reach 19 TWh in Sweden during
2020, rising to 26 TWh in 2025, and 40 TWh in 2035, according to the EU reference scenario for
Sweden modelled by the Swedish Energy Agency (SEA). By 2040 wind production is forecast to reach
54 TWh, rising to 60 TWh by 2045. SEA has a scenario with higher wind power growth, taking
production to 47 TWh as soon as 2025, 80 TWh in 2035, and 96 TWh in 2045. A study completed in
the spring of 2020 by the Swedish Wind Energy Association (SWEA) forecasts wind power growth that
is even a little higher than that – reaching 82.7 TWh in 2035 and 104.8 TWh in 2045, see Figure 4.

7
  See note 5, as well as En svensk-norsk elcertifikatsmarknad, årsrapport för 2018, a joint report by the Swedish Energy
Agency and Norway’s Water and Energy Directorate, ET2019:4 (Swedish edition), p. 6 and 9. The year 2018 started with a cold
spell during February and March which elevated power demand. The summer saw record temperatures with lower-than-
expected wind production, and also a drought which had an impact on hydropower in Norway and Sweden in the second half of
the year. This put a floor under power prices.

    The contents of this paper are the authors’ sole responsibility. They do not necessarily represent the views          4
                          of the Oxford Institute for Energy Studies or any of its Members
Figure 4: Swedish Power Balance with EU-guideline Reference Scenario and ELS Analysis
Long-Term Demand Prognosis
Given that the price effects from intermittent production are already visible on the Nord Pool market,
continued wind power growth, as envisaged even in the SEA’s reference scenario, is bound to speed
up the already evident cannibalization of plannable power production, chiefly nuclear capacity. The
growth in wind power, heavily localized in the sparsely populated northern part of Sweden, is also bound
to come up against some severe transmission capacity bottlenecks. This could throw the timing of some
of the growth between 2023 and 2030 seriously into question, although the Swedish TSO is escalating
debottlenecking works. 8 Nevertheless, growth is set to continue, and anecdotal evidence collected
through the interviews made by the authors, and Swedish financial media reports, indicate no noticeable
slowing in new wind power project FIDs as a result of the 2020 coronavirus pandemic.
1.1 Actors in the PPA market
There are four main different types of actors who make it possible for a PPA to be entered into between
buyers and sellers. PPAs are negotiated bilaterally between an owner/producer and a buyer, but they
can also involve a lender in the form of a bank to finance the construction of a new renewable project.
Furthermore, a balancing agent is needed so that the owner/producer can fulfil his delivery obligations
(as stipulated in the contract) to the buyer, in cases of low wind production, see Figure 5.
8
Långsiktig marknadsanalys 2018, Svenska Kraftnät, 2019, p. 31.
The contents of this paper are the authors’ sole responsibility. They do not necessarily represent the views 5
of the Oxford Institute for Energy Studies or any of its MembersFigure 5: Actors Involved in a PPA Set-Up
LENDER: BANK
PPA XX-YEAR
CONTRACT
OWNER/ BUYER
PRODUCER
BALANCING AGENCY
Source: ELS Analysis
Owner/producer: An owner/producer is the party which owns or manages a renewable asset. These
actors can be divided into the following categories:
• Independent electricity producers.
• Larger utilities and energy companies.
• Infrastructure investment companies.
• Renewable energy fund managers.
With a high degree of simplification, it is possible to divide these categories into two groups:
The main interest of the first two owners/producers listed above is to produce electricity and, through
entering into a PPA with a buyer, price-secure their project by calculating marginal production cost,
insurance, and balancing cost, as well as a certain rate of return. This group is, to varying degrees,
dependent on external financing of the project. Hence it needs to secure a stable cash flow in order to
service its loans; securing a fixed price for a certain baseload volume through a PPA achieves that. The
producer also minimizes his exposure to the price volatility of the Nord Pool spot market.
The latter two categories can be part of the producer’s financing plan (and would thus partly own the
project), but a wind power project can also be fully owned by both investment companies and fund
managers. The motivation to invest in a wind power project looks somewhat different for them, in the
sense that their interest is not chiefly to produce electricity – they are also driven by wishing to add
green values to their overall portfolio. Demands from clients to place money in green investments have
increased sharply in recent years and fund managers are looking for projects that can provide a secure
and long-term return, which wind and solar projects can offer in a contractual set-up like the PPA.
Buyers: By entering into a renewable PPA, the buyer can claim that all of his contracted volumes in
the PPA come from renewable sources, even though the electricity actually taken from the grid into the
buyer’s facilities mirrors the overall energy mix of the power system. (This is particularly the case in
terms of wind power, given its intermittent and weather-dependent production profile.) However, the
fact that a buyer can claim that volumes contracted in a PPA are 100 per cent renewable helps the
company to reach its green targets. There is also a market logic behind entering into a PPA on the part
of the buyer, as the company reduces its exposure to volatility in the spot market and secures a long-
term price with delivery security.
The contents of this paper are the authors’ sole responsibility. They do not necessarily represent the views 6
of the Oxford Institute for Energy Studies or any of its MembersThere are mainly three categories of buyers:
• Large multinationals with a relatively high electricity consumption, such as IKEA and
Google. The green values that benefit the companies’ general climate footprint are the
driving factor behind the increased interest from these players to enter into PPAs. Also,
given that the cost of electricity does not constitute one of the company’s largest expenses,
the price level for electricity becomes somewhat less important in relation to the PR value
and the financial value, for instance in the form of green loans, which a PPA entails.
• Larger electricity and energy companies, as described above, can be both a seller and a
buyer. These players have their own assets but can enter into PPAs to cover their
customers’ demand. An electricity and energy company that does not itself produce or
manage a sufficiently high proportion of renewable energy can in this way, through a PPA
with a wind power project, achieve both the company’s own green target as well as those
set by the government.
• There is a growing interest among industrial customers to cover parts of their total energy
need with PPAs. Within the buyer’s segment, industrials are the ones most sensitive to both
energy costs and secure deliveries. Through a PPA they can secure a certain volume for a
fixed price over a longer period of time, which makes both their production and cost
planning much easier. Section 3, however, describes how PPA prices in the Nordics are
currently traded with a premium to current spot prices at Nord Pool. Given the price
sensitivity of industrial customers, their willingness to sign PPAs should decrease in such
a price relationship. However, there has not yet been a slowdown in demand for PPAs
among industrial customers in the Nordics. In fact the opposite seems to be taking place.
This can be explained by the fact that stability, at a price level that is still competitive
compared with the rest of Europe, takes precedence over volatility, together with the added
green value that such a PPA provides.
Balancing agent: With wind power’s weather-dependent (intermittent) production, a so-called
balancing agent becomes crucial for the producer to be able to guarantee the deliveries stipulated by a
PPA. Hence, the producer enters into an agreement with an electricity trader, which guarantees the
wind power producer’s deliveries at times when he cannot fulfil his own delivery obligations with his
own production. The balancing agent has access to a number of other renewable (not just wind power)
and non-renewable power sources, which makes it possible to cover the shortfall that occurs when the
wind does not blow. In many cases, the wind power producer and the balancing agent have agreed on
a fixed tariff for these volumes, but there are also solutions where the wind power producer is buying
his balancing power at the spot price.
2. PPA Contract structures
PPA contracts are today the single most important driving factor behind the rapid expansion of wind
power in Sweden, and have begun to spread across Europe as an accelerator for the transition to
renewable electricity production. In the Nordic market, long- or medium-term offtake agreements have
been signed between large electricity users (as well as electricity traders) and, for example, hydropower
producers, for decades. However, the PPA agreement which now forms the basis for growth in the solar
and wind power industry has developed some novel features, which in a significant way differentiate it
from its predecessors. This differentiation is caused both by practical conditions and financial
requirements.
In addition, the PPA has emerged as the legally accepted link between a buyer and specific renewable
production, after Swedish court rulings in recent years have made it more difficult for buyers to claim
electricity purchases from specific facilities and energy sources, when there was no direct geographical
connection. PPA-agreements are considered as legally enabling a buyer to claim that the electricity
purchased comes from the plants specified in a PPA, without a dilution effect stemming from the
electricity mix in the rest of the Nordic electricity grid. This is made possible by a PPA being considered
The contents of this paper are the authors’ sole responsibility. They do not necessarily represent the views 7
of the Oxford Institute for Energy Studies or any of its Membersas establishing that the producer provides the buyer with the agreed electricity volumes over a certain
period of time, for example over a month or a quarter, despite intermittent electricity not being able to
maintain stable deliveries every hour during the period and a need to resort to supplies being balanced
from the wider power mix of the electrical system.
For a majority of today’s PPA customers, it is of fundamental importance to be able to attribute their
power purchases to entirely renewable sources and also to contribute to additionality – namely the
construction of new renewable capacity. This is an effect of the companies’ sustainability goals and
commitments to their own customers. PPA thus also contributes very high corporate social
responsibility (CSR) and PR values in PPA customers’ own marketing. In addition, the agreements
have very real values, as large electricity consumers themselves face increasing accounting
requirements for their sustainability work, and regulatory pressure to gradually tighten their own
environmental goals.
Companies’ interest in acting proactively during the transition has been emphasized by the emergence
of the additionality concept where additionality, especially in the Nordic market, has meant that PPA is
linked to new (additional) production capacity which the agreement has made possible. PPA contracts
with additionality are seen as an opportunity to maximize the PR value for a buyer, with opportunities
to use the resulting facility in their marketing; in many cases they even get to put their company name
on the turbines. The strong legal link between the plant and the electricity buyer that PPA enables also
means that additionality maximizes the positive effect that renewable electricity has on the consumer’s
reported climate footprint and enables, for example, access to green financing (green loans), which
means reduced capital costs for the entire company.
Securing guarantees of origin and access to green finance, together with the PR values achieved for a
larger consumer by entering into a PPA with wind or solar energy producers, thus constitute a strong
complement to the way in which PPA minimizes the price risk and secures renewable electricity. The
willingness to reduce and manage risks is also reflected through factors such as the contractual parties’
respective creditworthiness being weighed into the contract and the pricing agreed. The parties often
undertake to inform each other promptly about any changes in their respective credit ratings, as a way
of keeping each other informed of the risk of contract unfulfillment rising or falling.
Work to standardize the PPA agreements is ongoing in several forums. The agreement template which,
however, seems to have received the greatest acceptance and dissemination in Europe is the one
developed by the European Federation of Energy Traders (EFET). Nevertheless, the bilateral nature of
each agreement means that there is a very large number of variations in how the agreements ultimately
are formulated. Some main options can, however, be discerned:
2.1 Financial & physical PPA
Financial PPA
A financial PPA enables the buyer to receive green certificates and certificates of origin, even though
the physical electricity might not be needed in the specific market. Instead, the agreement involves a
payment link between PPA-buyer and producer who, at agreed intervals, settle the price difference
between the price achieved when selling the electricity on the market and the fixed PPA price, see
Figure 6. The adjustment generally takes place with the help of a balancing agent. For example, if the
market price of electricity is trading below the PPA price, the PPA-buyer pays the producer the
difference between the price the producer realized for the electricity on the market and the agreed PPA
price. In cases where the market price trades above the PPA price, the PPA-buyer receives the excess
income relative to the agreed contract volume.
The contents of this paper are the authors’ sole responsibility. They do not necessarily represent the views 8
of the Oxford Institute for Energy Studies or any of its MembersFigure 6: Model of a Financial PPA: A producer sells power on the market, after which the
PPA-buyer and the producer settle eventual price differences from the agreed PPA-price
amongst each other. Meanwhile, the PPA-buyer receives all the green certificates related to
the power produced
Source: Authors
The signing of financial (sometimes also referred to as synthetic or virtual) PPAs is unusual in the Nordic
region today. They occur, for example, when multinational companies have entered into PPAs in the
Nordic market with the aim of securing certificates of origin and green certificates for use in the wider
European market. If the buyers do not really need as much physical electricity for delivery in the Nordic
region as the PPA entails, the buyer can reap the sustainability benefits of having entered into a virtual
PPA, without having to take physical delivery of the electricity, see Figure 6.
Physical PPA
A PPA for physical electricity supply is the most common form of contract in the whole of Europe, since
PPAs are mainly entered into by large electricity buyers who want to hedge against price fluctuations.
A less common variety of physical PPA is one which includes a direct line between buyer and producer;
this can be described as a large electricity consumer having a wind or solar plant built on or at an owned
plant, but nevertheless contracting it to be financed and run by external parties. It is much more common
for sellers and buyers to enter into a normal physical PPA, where the buyer can draw the corresponding
electricity volumes entered by the producer into the electricity system, up to the contractual limit, see
Figure 7.
Figure 7: Model of a Physical PPA: The buyer takes delivery of the power produced
Source: Authors
Just as for the remaining trade in electricity on the deregulated Nordic market, it is not a question of a
PPA-buyer receiving the very electrons produced by the facility mentioned in the PPA (except in the
case where there is a direct link), as the buyer receives power out of the system’s overall electricity mix.
The contents of this paper are the authors’ sole responsibility. They do not necessarily represent the views 9
of the Oxford Institute for Energy Studies or any of its MembersLegally, however, the buyer can count electricity as coming from that particular seller and the
facility/facilities designated in the PPA, up to the agreed volume for a fixed price, see Figure 6. In the
physical contract, no settlement is needed between the market price and the contract price (as is the
case for the financial contract) during normal operation. However, the parties need to agree on how to
handle periods of maintenance and unplanned shutdowns with both buyers and sellers, as well as who
will act as the balancing agent and acquire volumes for the producer when the producer is in deficit, or
sell the producer’s surplus on the market, when production is high.
2.2 Approaches to volume risks
Baseload or pay-as-produced
An electricity buyer, through PPA, can decide to buy a baseload (a fixed volume of electricity) over time
from a renewable producer, at the agreed PPA price. In a baseload structure, the producer is
responsible for underperformance vis-à-vis the buyer. The producer thus carries the entire risk of
production fluctuations. The baseload structure thus determines a fixed volume which the producer
must deliver at the PPA price and which is settled on a monthly, quarterly, or annual basis, see Figure
8. The producer is responsible for the price risk if the deliveries undershoot the PPA’s stipulated
volumes and he then needs to compensate with spot market purchases – but he could reap potential
benefits from selling any excess production on the electricity market when production is high.
Figure 8: Model of an annual baseload PPA. Production overshooting the contracted baseload
volume finances balancing purchases during deficit period, as well as providing potential
profit
Source: ELS Analysis
An alternative is to buy the entirety, or a percentage, of the electricity produced, under a so-called pay-
as-produced agreement (p-a-p). The buyer pays a fixed price for the volume produced, regardless of
how much it is, and thereby takes part in the volume risk, but also in the volume upside.
The contents of this paper are the authors’ sole responsibility. They do not necessarily represent the views 10
of the Oxford Institute for Energy Studies or any of its MembersFigure 9: Model of a pay-as-produced PPA
Source: ELS Analysis
P-a-p contracts are normally cheaper than baseload contracts, as they involve a greater risk for the
buyer, see Figure 9. However, large buyers, including retailers, with their own trading departments can
manage such risks and take advantage of them. Large consumers who do not conduct their own trading
generally tend to enter into baseload contracts. Consumers who still enter into p-a-p contracts need a
balancing agent to physically handle the surpluses in relation to their own demand, as well as the
deficits. Large multinational buyers of financial PPAs, who are largely driven by maximizing the
acquisition of certificates of origin and green certificates, can to a greater extent also find p-a-p
structures attractive, since they allow them to maximize their acquisition of certificates. The risk from
their point of view is mainly how much volatility is created by periods with high renewable production,
and whether the difference between the PPA price they have to pay, and a market price reflecting
oversupply, becomes too great, given the value and benefit of the certificate.
Baseload contracts can be specified in more detail, according to a production facility’s specific
production profile during a typical day or a typical month, on a monthly basis, quarterly basis, or on an
annual basis.
This means that a PPA can be structured with different baseload volumes for different periods over the
course of a year. In this way, the renewable producer hedges a larger part of its production during
periods with, for example, more wind or sun, and reduces his risk of being exposed to deficits and
having to make balancing purchases on the market during periods with less wind or fewer hours of
sunshine.
In the same way, p-a-p contracts can be structured with more flexibility in time, but with less flexibility
in volume, by the buyer buying all production up to a production profile for each month, day, or quarter.
Such arrangements place most of the price risk on the buyer, while the seller bears most of the volume
risk, as the volume up to the agreement’s level must be guaranteed regardless of any weather deviation.
The end product will be a p-a-p contract which comes very close to a periodicized baseload structure,
depending on how well the volumes have been defined.
2.3 PPA as a hedging tool
Risk level calculations
The largest recurring risk factor for wind projects lies in their intermittence. Weather dependence results
in intermittent income from electricity sales, while electricity buyers expect stable deliveries. The risk is
financially increased through the built-in so-called cannibalization which occurs in wind and solar
The contents of this paper are the authors’ sole responsibility. They do not necessarily represent the views 11
of the Oxford Institute for Energy Studies or any of its Membersproduction – in other words, all wind producers in a region will generate surpluses and deficits at about
the same time. In this way, they will raise and depress the price of electricity on the market jointly,
reducing their income per unit sold in the event of a surplus, as well as jointly increasing the costs for
the electricity they have to buy in the event of a deficit vis-à-vis contracted PPA volumes.
In order to quantify and manage these risks, curves are drawn up for each wind and solar project,
detailing how much power the facilities could generate given historical wind or solar frequencies and
strengths. These annual production curves are then adjusted according to risk, in order to produce risk-
adjusted production profiles which show how likely it is that the plant in question will be able to exceed
certain production levels. In Figure 10, the curve P90, for example, shows the production rate at a
supply level which is likely to be exceeded 90 per cent of the time. The production rate P75 is adjusted
for production levels which are likely to be exceeded 75 per cent of the time. Similarly, a P50 rate shows
production levels which are likely to be exceeded half the time, see Figure 10.
Figure 10: Model curves over different risk profiles for wind production in a PPA
Source: ELS Analysis
When financing new wind and solar power projects in the Nordics, banks and financial institutions
normally apply the most conservative risk calculation, P90. It is usually from this production level that
lenders want to see around 70 per cent of production sold in advance through long-term PPAs. Other
financiers and investors, such as infrastructure and pension funds, as well as venture capital and
investment companies, more often tend to move in the range between P75 and P90. Since much of the
financing is calculated on a conservative production profile, this leaves a significant upside in terms of
how much electricity the producer can then actually hope to be able to produce in excess of the project’s
PPA commitments. It is from this excess earning that the project can hope to finance the balancing that
needs to be done when weather conditions push production below the PPA-assured sales levels, and
also to achieve their profit margins.
Volume settlement period/balancing period
It is of fundamental importance for the electricity producer to choose a time period for the volume
settlement. A PPA most often stipulates a set volume which must be delivered at all times, and only in
the case of a pure p-a-p structure would no settlement be made for under- or over-delivery.
A wind or solar producer, however, has a de facto production profile. Solar power produces more in
direct sunlight and less in clouded weather. At night, solar power produces no electricity at all. Wind
power produces at all hours, but in different amounts depending on wind strengths. Production can also
vary even more over a year due to geographical locations, than because of basic meteorological
conditions. Whether production should be counted against an average of one month, a quarter, or
adjusted annually, will be of great importance for a renewable producer’s opportunity to achieve a profit
The contents of this paper are the authors’ sole responsibility. They do not necessarily represent the views 12
of the Oxford Institute for Energy Studies or any of its Membersmargin, and minimize the needed compensatory purchases (balancing) from the spot and day-ahead
markets to meet contract volumes without becoming too expensive, see Figures 11, and 8 and 9.
Figure 11: Model of a monthly baseload wind PPA, where agreed power offtake shifts
according to the specified production profile
Source: ELS Analysis
The individual production rate for a wind project, for example, shows significantly lower average
production during the summer months, when it blows less, than during the winter months. The part of
the project’s production profile that meets the lowest part of the curve is to be regarded as the project’s
theoretical PPA capacity, but it depends on which risk level the actors choose. The production profile
curve itself shifts, depending on the level of risk it is meant to reflect, which makes this reasoning
theoretical. As described in section 2.2, concerning risk level calculations, this is where PPAs are most
tailored to specific production assets. Depending on the level of risk acceptable to the parties, wind
producers sell electricity through PPAs for volumes just below the curve and hope to be able to finance
balancing purchases with the help of the excess production, which most often takes place over the
agreed ‘baseload’ which the PPA parties (including the financiers) have considered sufficiently safe.
Banks and investors usually apply a more conservative risk curve, which in itself gives producers a
certain additional volume margin for sales, both through PPAs and on spot markets.
However, this does not take into account the fact that wind speeds can vary greatly hour by hour. While
the theoretical production rate on a monthly and annual basis is similar to a theoretical curve such as
that in Figure 12, a more realistic curve is full of short but frequent spikes and troughs. 9 This is because
the wind:
does not blow at all,
is so strong that turbines have to be switched off, or
falls somewhere in between on that scale.
In any case, production will still fall outside the production profile’s monthly average. The positive
production margin that the wind producer has on average, according to the facility’s individual
production plan, must be large enough to finance the purchases in the spot market and day-ahead
market which the producer must make for those hours and days when actual output undershot his PPA
commitments. How much of the price curve a wind farm can capture is its ‘capture rate’, which can be
seen as a measure of a facility’s possible profit margin.
9
Anpassning av elsystemet med en stor mängd förnybar elproduktion, Svenska Kraftnät, 2015, p.26.
The contents of this paper are the authors’ sole responsibility. They do not necessarily represent the views 13
of the Oxford Institute for Energy Studies or any of its MembersFigure 12: Theoretical model of a wind power project’s risk profile, with more wind blowing
during autumn and winter and less wind during summer. Production is sold from that
capacity, at a certain chosen level of risk, which can be expected according to the project’s
production profile (orange curve). When production falls below contracted volumes in a PPA
(black horizontal line), the producer needs to make compensatory purchases in order to meet
contractual commitments on the power market. This is mostly done with the help of a so-
called balancing agent.
Source: ELS Analysis
The relationship between a wind turbine’s installed theoretical capacity and its baseload differs greatly
and is further complicated by the fact that the greater the expansion of wind power, the more the
electricity price in the spot market will fluctuate with wind production levels. At low levels of wind output,
wind producers will be forced into the spot market to balance their baseload production at rising prices,
while electricity prices will be pushed down at times with high wind output when wind power producers
sell power which exceeds PPA-contracted volumes on the spot market.
Banks and financiers have, in past years, generally required wind producers to secure at least 70 per
cent of their baseload production through PPAs in order to obtain financing. It may not sound like much,
but for reference it is worth noting that the Swedish TSO, Svenska Kraftnät, from a system balancing
point of view, only expects wind power during a peak load hour to have an availability of around 11 per
cent of total installed capacity, given its intermittent nature.10 The market effect, where the spot price
for electricity negatively correlates with the price which wind producers seek on a pure supply and
demand basis, emphasizes this even more. Earnings on the production which exceeds baseload will
be relatively low, while the cost of balancing purchases will be comparatively high.
Balancing agent
As also described in section 1.1, most PPA structures require an actor who can offer balancing services
to the contract parties. The balancing agent is an electricity trader who de facto provides a trading desk
for the parties. Few renewable electricity producers have their own marketing function that can operate
in real time at Nord Pool, and this also applies to large consumers and electricity customers who buy
electricity through PPAs. In addition, banks and project financiers, as a rule, require that the producer
10
Ibid.
The contents of this paper are the authors’ sole responsibility. They do not necessarily represent the views 14
of the Oxford Institute for Energy Studies or any of its Membersalso hedges the remaining price risk from underperformance against the volume requirement in the
respective PPA.
The traders help the producer or buyer to purchase or sell surpluses or deficits in relation to the agreed
contract level; they thus first and foremost provide a service, although the balancing agent can also
help with risk management and take some risk on himself. As part of the producer’s own risk
management, some form of fixed price or wholesale price agreement is often arranged with the
balancing agent for purchase and sale assignments. Unlike the PPA-price, this price, however, tends
to be indexed to Nord Pool. Given the cannibalization which occurs between wind producers, a fixed
price agreement gives the producers a certain security, to avoid hitting the peak during price spikes,
when they have to supplement their own production, or the trough when they sell a surplus. In
exchange, the balancing agent complements his own possible trading profits (the company often sits
on a broader portfolio) with a fixed fee for the balancing service, which reduces the trader’s own
exposure to the market price.
3. PPAs & the Nordic electricity market
To understand how PPAs interact with and affect the electricity market, in this part of the report PPA
prices will be set in relation to other electricity prices. The relationship between them is a crucial factor
in understanding the role which PPAs play in the Nordic electricity market.
Unlike other commodity and energy markets, the frequency of new electricity market PPAs signed is
rather low.11 The reason for this is that PPA contracts are negotiated bilaterally and with a long tenure.
Furthermore, in the Nordic region, PPAs are almost exclusively linked to new renewable construction
and are therefore strongly connected to the region’s growth in renewable capacity. As described in
section 2, the trend is moving toward a standardization of PPAs, but the agreements still reflect specific
conditions between the parties involved in the negotiation and are designed accordingly. This means
that transparency is relatively low and prices essentially unknown, hence no daily PPA price data is
available. In this report, however, a price level of €30/MWh is assessed, through authors’ own interviews
with market stakeholders and from other similar material obtained by BloombergNef, 12 see Figure 13.
This figure is assessed as the price level at which most PPAs in Sweden are entered into. This price
level will be used below as a benchmark, when PPA prices are put in a wider power market comparison.
PPAs are seeing strong growth around Europe and are today a prerequisite for new wind and solar
power projects, as government support systems are being phased out. Depending on the region, either
solar or wind power serves as the basis for benchmark PPA prices, which is a contributing factor to the
huge price differences between regions. Even within the same category, prices differ greatly from each
other. In the spring of 2020, BloombergNef presented a study based on a survey 13 in which a number
of market participants, during the period January to March 2020, were asked at what price level they
had signed their PPAs. A main conclusion from the report was that PPAs connected to solar installations
were generally more expensive than those for land-based wind. Sweden stood out in the survey for
having the lowest average PPA prices, and the price level found in that survey corresponds strongly
with the material gathered for this report. The United Kingdom topped the survey for both solar and
wind, while Spain emerged as having the lowest PPA prices for solar in Europe, see Figure 13.
11
Pexapark, quote.pexapark.com.
12
Sweden, Spain the Cheapest European Markets for Wind and Solar Corporate PPAs, BloombergNEF, April 2, 2020.
13
Ibid.
The contents of this paper are the authors’ sole responsibility. They do not necessarily represent the views 15
of the Oxford Institute for Energy Studies or any of its MembersFigure 13: Maximum & minimum PPA price for solar and onshore wind
To put the Nordic PPA prices in relation to the rest of Europe, Figure 14 shows last year’s price
developments in some of Europe’s key markets. It is important to note that the data collected for this
graph is from Pexapark’s 14 own collection of market insights and it does not reflect actual PPA
transaction prices.15 Nevertheless, it gives an understanding of the difference in PPA price levels across
the main regions.
Figure 14: Regional PPA price comparison
REGIONAL PPA PRICES (NOMINAL)
45
40
35
€/MWh
30
25
20
15
Nordic PPA Spain PPA German
Source: Pexapark
14
Pexapark is a software and advisory service company focusing on post-subsidy renewable energy sales and risk
management.
15
Pexapark provides a PPA price reference service: Pexaquote. PPA prices quoted by Pexapark are based on fair value
models. The models used reflect pricing methodologies applied by leading offtakers and they are regularly recalibrated to
transaction price evidence, where available. Using these models and daily-updated price information from exchanges,
PexaQuote calculates fair values for all PPA prices published. For further detailed information: quote.pexapark.com.
The contents of this paper are the authors’ sole responsibility. They do not necessarily represent the views 16
of the Oxford Institute for Energy Studies or any of its MembersIt becomes very clear in this graph that the Nordic PPA prices are traded significantly lower in
comparison with the rest of Europe. In a way, this is not entirely unexpected as Nordic electricity prices
are also traded at a much lower level than electricity prices in the rest of Europe. This indicates
something important, namely that there is a certain impact from the developments in electricity markets,
for example on Nord Pool, and the pricing of PPAs. A discussion of whether it is possible to talk about
a price correlation or not, and whether it can form the basis for effective price signals, is given at the
end of this section. What can be argued, however, is that there exists a relationship between them, as
the spot price in the electricity market is used as a reference price initially in bilateral PPA negotiations.
Another significant factor in determining the PPA price level is the marginal production cost, and thus
whether PPAs are linked to new installations of solar and wind power. In Sweden, the trend has been
PPAs linked to new installations. In cases similar to the Swedish model, the marginal production cost,
together with any balancing fees, insurance, and a certain profit margin for the seller, will be absolutely
decisive for pricing and will set a clear price floor.
In other regions, PPAs are not solely linked to new renewable installations but can instead relate just
to green values, so the contract can then be linked to capacity already in operation.
In addition to price-level disparities between different markets in Europe, PPA prices in the rest of
Europe are traded at a discount compared to the spot prices in each market. This was also the case in
the Nordics up until the turn of this year, when conditions changed and PPA prices came to trade with
a premium, see Figure 15. The logic behind entering into a PPA for a lower price than the prevailing
spot price is easier to understand than the reverse, given the cash flow security the buyer provides the
producer with, ahead of a project being built. That the Swedish market has moved to the opposite
position, with no signs of that changing, could, however, reflect the country’s ambitious climate targets
and strong popular backing for them – raising the value of the green benefits derived by buyers from
PPAs relative to the power price.
Figure 15: the Nordic system spot price and authors’ own assessed transactional PPA price
level for Sweden
Source: ELS Analysis, Refinitiv
It becomes clear when looking at historical PPA prices alongside historical Nordic spot prices at Nord
Pool, see Figure 15, that there was a shift by the end of 2019, when the Nordic spot prices fell
drastically. As a result, PPA prices are now traded with a premium.
There are many factors that can be included as contributing to the price declines in the Nordic electricity
market over the past year – not least with the effects of COVID-19 having a dampening effect on
The contents of this paper are the authors’ sole responsibility. They do not necessarily represent the views 17
of the Oxford Institute for Energy Studies or any of its Membersdemand and price development in general. However, the underlying factors relating to market
developments, which were evident even before the pandemic, were that the market was driven by
oversupply. The rapid growth in installed wind power capacity has been the driving force behind the
supply growth and this caused prices to fall. A contributing factor to wind power in Sweden being able
to expand at the pace witnessed in recent years comes from the price hedging opportunity which PPAs
offer to producers and sellers. In this way, it can be argued that the growth of PPAs has had a price
impact on Nord Pool spot as the supply growth, which has pushed prices down, was made possible by
PPAs. An important question, however, is: whether the current low spot prices at Nord Pool will in turn
affect demand for PPAs (as these are now significantly more expensive than spot prices) and whether
this may in turn then affect future wind power expansion negatively?
At the time of writing, it is still too early to say whether the current low spot prices will actually have an
impact on PPA demand. If this is the case, it can be stated that there is a mutual impact between the
prices, as fewer signed PPAs will, in all likelihood, affect supply in the electricity market in the long run
and, as a result, over time will cause prices to recover. The price signal, in this respect, would then be
obtained, albeit in a delayed, possibly diluted, as well as a short-term, form.
With the current market situation and price relation between PPA prices and spot prices, it makes
perfect sense for producers and sellers to want to secure their project finance through a PPA. However,
it becomes more difficult to understand why a buyer would want to lock his price at a higher level than
the market price, as is the case in Sweden this year. Even here, it is, however, not without logic. As
described above, the full value in a company’s PPA calculation must be taken into account, rather than
just the electricity price itself, when a deal like this is to be set. The CSR and PR values which a
company can extract from a PPA are enhanced by the value of being able to present itself as proactive
in the sustainability field towards customers, competitors, and authorities. This is a trend increasingly
driven down from end-customer-facing companies into the B2B segment of companies, as regulations
and values (as, for instance laid out in the EU taxonomy) create rankings which enable or disable
access to cheaper green credit, certain parts of forthcoming stimulus packages, and other benefits. A
company rising in the sustainability rankings could today reduce the company’s entire cost of raising
capital. Another contributing factor is also that there is a rather broad consensus that electricity prices
in the Nordic market will rise in the medium term. This makes current PPA price levels very competitive,
especially as the buyer shields himself from the volatility risk.
As mentioned above, it is still too early to draw any conclusions on whether the sharp fall in prices,
which has shaped the market over the past months, will lead to a reaction on the buyer side, and
whether the willingness to sign PPAs will decrease. What can be said, however, is that no such reaction
has occurred so far, despite relatively low prices over the longer period and very low Swedish Green
Certificate prices for several years. The addition of green values to companies’ long-term business
plans is increasing in priority, which drives PPA deal making. Government direct requirements for
companies to contribute to the national climate agenda remain high, and additional requirements for
banks to rate companies’ climate footprints are growing stronger through, for example, the EU’s
common taxonomy for environmentally sustainable investments. That PPAs continue to be signed
despite the fact that prices are set with a premium to spot, does not need to be illogical in this context
as long as prices fit within the buyers’ overall cost calculation. Given how Nordic region PPA prices
compare with those seen in other European markets, see Figure 14, it might not be hard to envisage
that the additional values extracted from the PPA compensate for the spread between Nordic spot
prices and Nordic PPA prices for many Nordic industrial and commercial actors. With that said, both
PPA producers and sellers will likely come under higher pressure in bilateral negotiations as a result of
the price difference. Buyers may well want to negotiate better terms for themselves when it comes to
risk sharing, and also to the length of the agreement. It is indeed likely that agreements will tend to be
of shorter duration in the future.
A driving factor for both sellers, but above all for buyers, to sign a PPA is to protect themselves from
the volatility of the spot market. This means that the degree of volatility, and the signal that volatility
gives to the market, will not fully reach either buyers or sellers who hold a PPA. However, the high
degree of volatility which we see in the Nordic electricity market today is, from a systemic and holistic
The contents of this paper are the authors’ sole responsibility. They do not necessarily represent the views 18
of the Oxford Institute for Energy Studies or any of its Membersmarket perspective, more important to understand than the price level itself. The last year has been
driven by low prices in general, but also by very volatile prices, with spikes during periods when the
market has not normally seen prices rise, such as was seen this summer. This is largely due to the fact
that intermittent production from, especially, wind has led to oversupply in the market when the
conditions for wind power are good, and a growing deficit when wind power produces less.
The high degree of volatility sends clear signals to the market that the supply varies and at times is
constrained. The share of the supply that has grown through the use of PPAs has, however, protected
itself against this volatility and will thus not be reached by these signals. From a power system
perspective this is problematic, as the part of the supply which currently both drives prices down and
contributes to the high level of volatility, is also the part which has shielded itself from the effects on the
market and from the signals the market is sending as a result.
4. Conclusion
PPAs are not a new phenomenon but they have come to take on a new shape in the Nordic markets,
tied to new renewable power installations. Other sources of supply are finding it hard to attract long-
term investments in the current climate, and have not been able to use the new PPA structures to their
advantage. Over the past decade, as government support schemes have been phased out, particularly
in Sweden, PPAs have gradually filled the void and become vital to renewable capacity growth. With
ambitious national climate targets throughout the region, government support has given market players
an impetus to invest in renewable power production and to extract the green values associated with it.
These values are both CSR- and PR-related, as well as strictly financial.
This paper has identified that there is a logic behind entering into long-term renewable PPAs for both
buyers and sellers, as well as for investors. Even in a market where PPA price levels are set above the
market level, or with a premium to current spot prices, the growth in PPAs is expected to remain. This
is, to a high degree, because Nordic power prices, and therefore also their PPA prices, are so low
compared to the rest of Europe, but it is also because of the worth assigned to green values by
corporates, as well as their wish be compliant in meeting government targets. Furthermore, minimizing
the volatility risk in an increasingly volatile spot market makes sense, particularly when power prices
can be secured at relatively low levels for the long term.
A main conclusion from this paper is that PPA-fuelled renewable growth is having a significant impact
on both long-term system stability and short-term market developments. Weather-dependent
intermittent production capacity is the fastest growing source of power supply in the market, causing
low, but volatile, prices. These are a signal of a largely oversupplied market, but also of a market which
is starting to move off balance when wind production, at times, is low. The oversupply generated by the
booming growth in, chiefly, onshore wind in Sweden has pushed prices down to levels where producers
of plannable power are struggling with their profitability. As a result, mothballings and shut downs have
started to occur. This rising volatility should be a clear market signal to actors, however, since as the
actors involved in PPAs have shielded themselves from the volatility, it could be argued that they have
also, to a large degree, shielded themselves from the market signal.
It will ultimately become an issue of striking a balance between system stability and meeting climate
targets. This will likely result in regulatory actions, but it should really open up discussions about the
need for a new, more flexible, market design.
The contents of this paper are the authors’ sole responsibility. They do not necessarily represent the views 19
of the Oxford Institute for Energy Studies or any of its MembersYou can also read