Johns Creek Strategic Economic Development Plan: 2016-2021 - February 2016
←
→
Page content transcription
If your browser does not render page correctly, please read the page content below
Johns Creek Strategic Economic Development Plan: 2016-2021
                                                February 2016

                                                          1
CITY OF JOHNS CREEK
       2 0 1 6 - 2 0 2 1 S T R AT E G I C E C O N O M I C D E V E L O P M E N T P L A N

      PREPARED FOR:

      CITY OF JOHNS CREEK
      12000 FINDLEY ROAD, SUITE 400
      JOHNS CREEK, GA. 30097
      WWW.JOHNSCREEKGA.GOV
      678.512.3200

      PREPARED BY:

      STRATEGIC PLANNING GROUP, INC.
      830-13 NORTH A1A, SUITE 402
      PONTE VEDRA BEACH, FL 32082
      WWW.SPGINC.ORG
      800.213.PLAN

      T.Y. LIN INTERNATIONAL
      260 PEACHTREE STREET, SUITE 900
      ATLANTA, GA. 30303
      WWW.TYLIN.COM
      404.841.7886

      FEBRUARY 2016

Strategic Planning Group, Inc.                                                            2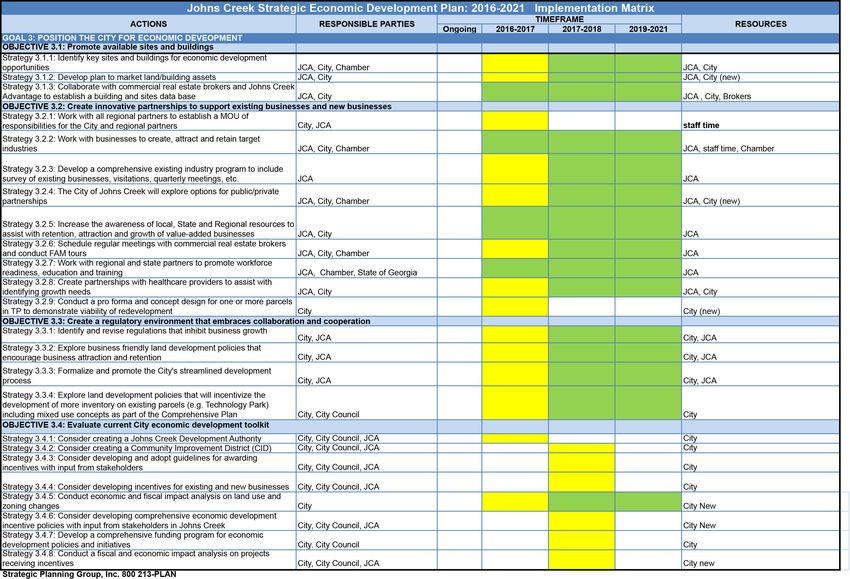
ACKNOWLEDGEMENTS
Special recognition is given to the following participants for their valuable insight and the time donated
to assisting in the development of this Strategic Economic Development Plan (SEDP) for the City of Johns
Creek.

Task Force Members:
Steve Broadbent – City Council
Bob Gray – City Council
Tom Tate – Johns Creek Advantage
Rees Waite – Johns Creek Advantage
Susan Grissom – Johns Creek Chamber of Commerce
Dan Callahan – Johns Creek Chamber of Commerce

City Council:
Mike Bodker – Mayor
Steve Broadbent – Mayor Pro Tem
Lenny Zaprowski – Post 1
Cory Davenport – Post 3
Bob Gray – Post 4

City Manager:
Warren Hutmacher

Special Appreciation to:
Justin Kirouac, Assistant City Manager
Courtney Bernardi, CEO Johns Creek Advantage

 Strategic Planning Group, Inc.                                                                      3
TABLE OF CONTENTS
Acknowledgments . . . . . . . . . . . . . . . . . . . . . . . . . . . . . . . . . . . . . . . . . . . . . . . . . . . . . . . . . . . . . . . . . . . . . . . . . . . . . 3
Table of Contents . . . . . . . . . . . . . . . . . . . . . . . . . . . . . . . . . . . . . . . . . . . . . . . . . . . . . . . . . . . . . . . . . . . . . . . . . . . . . .4
Johns Creek Profile “Where Are We Now?”. . . . . . . . . . . . . . . . . . . . . . . . . . . . . . . . . . . . . . . . . . . . . . . . . . . . . . . . .6
        Demographics. . . . . . . . . . . . . . . . . . . . . . . . . . . . . . . . . . . . . . . . . . . . . . . . . . . . . . . . . . . . . . . . . . . . . . . 7
        Socio-Economics. . . . . . . . . . . . . . . . . . . . . . . . . . . . . . . . . . . . . . . . . . . . . . . . . . . . . . . . . . . . . . . . . . . . . 8
        Employment/Businesses. . . . . . . . . . . . . . . . . . . . . . . . . . . . . . . . . . . . . . . . . . . . . . . . . . . . . . . . . . . . . . . 9
        Johns Creek Labor Shed. . . . . . . . . . . . . . . . . . . . . . . . . . . . . . . . . . . . . . . . . . . . . . . . . . . . . . . . . . . . . . . .10
        Where Johns Creek residents work. . . . . . . . . . . . . . . . . . . . . . . . . . . . . . . . . . . . . . . . . . . . . . . . . . . . . . 11
        Office Market Sector. . . . . . . . . . . . . . . . . . . . . . . . . . . . . . . . . . . . . . . . . . . . . . . . . . . . . . . . . . . . . . . . . . 11
        Johns Creek Office Market Sector. . . . . . . . . . . . . . . . . . . . . . . . . . . . . . . . . . . . . . . . . . . . . . . . . . . . . . . .12
        Atlanta Industrial Market. . . . . . . . . . . . . . . . . . . . . . . . . . . . . . . . . . . . . . . . . . . . . . . . . . . . . . . . . . . . . . .13
        Retail Market. . . . . . . . . . . . . . . . . . . . . . . . . . . . . . . . . . . . . . . . . . . . . . . . . . . . . . . . . . . . . . . . . . . . . . . . 14
Economic Development Issues Identification and Prioritization “Which direction should we go?”. . . . . . . . . 17
        Why Economic Development. . . . . . . . . . . . . . . . . . . . . . . . . . . . . . . . . . . . . . . . . . . . . . . . . . . . . . . . . . . 17
Target Industry Process. . . . . . . . . . . . . . . . . . . . . . . . . . . . . . . . . . . . . . . . . . . . . . . . . . . . . . . . . . . . . . . . . . . . . . . . 19
Target Industries. . . . . . . . . . . . . . . . . . . . . . . . . . . . . . . . . . . . . . . . . . . . . . . . . . . . . . . . . . . . . . . . . . . . . . . . . . . . . 19
Review of Existing Target Industries. . . . . . . . . . . . . . . . . . . . . . . . . . . . . . . . . . . . . . . . . . . . . . . . . . . . . . . . . . . 19
        State of Georgia. . . . . . . . . . . . . . . . . . . . . . . . . . . . . . . . . . . . . . . . . . . . . . . . . . . . . . . . . . . . . . . . . . . . . .19
        Atlanta Region . . . . . . . . . . . . . . . . . . . . . . . . . . . . . . . . . . . . . . . . . . . . . . . . . . . . . . . . . . . . . . . . . . . . . . 20
        Fulton County Target Industries. . . . . . . . . . . . . . . . . . . . . . . . . . . . . . . . . . . . . . . . . . . . . . . . . . . . . . . . .21
        DeKalb County Target Industries. . . . . . . . . . . . . . . . . . . . . . . . . . . . . . . . . . . . . . . . . . . . . . . . . . . . . . . . .21
        Cobb County Target Industries. . . . . . . . . . . . . . . . . . . . . . . . . . . . . . . . . . . . . . . . . . . . . . . . . . . . . . . . . .21
        Sandy Springs Target Industries. . . . . . . . . . . . . . . . . . . . . . . . . . . . . . . . . . . . . . . . . . . . . . . . . . . . . . . . . 21
        City of Roswell Target Industries. . . . . . . . . . . . . . . . . . . . . . . . . . . . . . . . . . . . . . . . . . . . . . . . . . . . . . . . .22
        City of Alpharetta Target Industries. . . . . . . . . . . . . . . . . . . . . . . . . . . . . . . . . . . . . . . . . . . . . . . . . . . . . . 22
        Johns Creek Target Industries Overview. . . . . . . . . . . . . . . . . . . . . . . . . . . . . . . . . . . . . . . . . . . . . . . . . . . . . 22
        Technology Park at Johns Creek. . . . . . . . . . . . . . . . . . . . . . . . . . . . . . . . . . . . . . . . . . . . . . . . . . . . . . . . .23
Recommended Johns Creek Target Industries. . . . . . . . . . . . . . . . . . . . . . . . . . . . . . . . . . . . . . . . . . . . . . . . . . . 24
        Johns Creek Target Industry Process. . . . . . . . . . . . . . . . . . . . . . . . . . . . . . . . . . . . . . . . . . . . . . . . . . . . . .24
        Office Users. . . . . . . . . . . . . . . . . . . . . . . . . . . . . . . . . . . . . . . . . . . . . . . . . . . . . . . . . . . . . . . . . . . . . . . . . .25
        Johns Creek Economic Recruitment. . . . . . . . . . . . . . . . . . . . . . . . . . . . . . . . . . . . . . . . . . . . . . . . . . . . . .25
Primary Target Businesses/First Tier. . . . . . . . . . . . . . . . . . . . . . . . . . . . . . . . . . . . . . . . . . . . . . . . . . . . . . . . . . . 25
Second Tier Targets. . . . . . . . . . . . . . . . . . . . . . . . . . . . . . . . . . . . . . . . . . . . . . . . . . . . . . . . . . . . . . . . . . . . . . . . .27
        Professional/Business Services. . . . . . . . . . . . . . . . . . . . . . . . . . . . . . . . . . . . . . . . . . . . . . . . . . . . . .27
Third Tier Targets. . . . . . . . . . . . . . . . . . . . . . . . . . . . . . . . . . . . . . . . . . . . . . . . . . . . . . . . . . . . . . . . . . . . . . .28
Fourth Tier Targets/Retail. . . . . . . . . . . . . . . . . . . . . . . . . . . . . . . . . . . . . . . . . . . . . . . . . . . . . . . . . . . . . .29

  Strategic Planning Group, Inc.                                                                                                                                   4
Other Considerations. . . . . . . . . . . . . . . . . . . . . . . . . . . . . . . . . . . . . . . . . . . . . . . . . . . . . . . . . . . . . . . . . .29
SWOT Analysis . . . . . . . . . . . . . . . . . . . . . . . . . . . . . . . . . . . . . . . . . . . . . . . . . . . . . . . . . . . . . . . . . . . . . . . . . . . . . . . 29
Strengths, Weaknesses, Opportunities and Threats (SWOT). . . . . . . . . . . . . . . . . . . . . . . . . . . . . . . . . . . . . . . 29
SWOT Analysis. . . . . . . . . . . . . . . . . . . . . . . . . . . . . . . . . . . . . . . . . . . . . . . . . . . . . . . . . . . . . . . . . . . . . . . . . . . . .31
       Strengths. . . . . . . . . . . . . . . . . . . . . . . . . . . . . . . . . . . . . . . . . . . . . . . . . . . . . . . . . . . . . . . . . . . . . . . . . . 31
       Weaknesses. . . . . . . . . . . . . . . . . . . . . . . . . . . . . . . . . . . . . . . . . . . . . . . . . . . . . . . . . . . . . . . . . . . . . . . .32
       Opportunities. . . . . . . . . . . . . . . . . . . . . . . . . . . . . . . . . . . . . . . . . . . . . . . . . . . . . . . . . . . . . . . . . . . . . . 32
       Threats. . . . . . . . . . . . . . . . . . . . . . . . . . . . . . . . . . . . . . . . . . . . . . . . . . . . . . . . . . . . . . . . . . . . . . . . . . . .32
       SWOT Summary. . . . . . . . . . . . . . . . . . . . . . . . . . . . . . . . . . . . . . . . . . . . . . . . . . . . . . . . . . . . . . . . . . . . . 33
SWOT Themes . . . . . . . . . . . . . . . . . . . . . . . . . . . . . . . . . . . . . . . . . . . . . . . . . . . . . . . . . . . . . . . . . . . . . . . . . . . . . . . .34
Strategic Plan Framework. . . . . . . . . . . . . . . . . . . . . . . . . . . . . . . . . . . . . . . . . . . . . . . . . . . . . . . . . . . . . . . . . . . . . . .35
       Goals, Objectives and Strategies. . . . . . . . . . . . . . . . . . . . . . . . . . . . . . . . . . . . . . . . . . . . . . . . . . . . . . . . .35
       Organizational Responsibilities. . . . . . . . . . . . . . . . . . . . . . . . . . . . . . . . . . . . . . . . . . . . . . . . . . . . . . . . . .35
       Implementing the Strategic Plan. . . . . . . . . . . . . . . . . . . . . . . . . . . . . . . . . . . . . . . . . . . . . . . . . . . . . . . . .36
       Conclusion. . . . . . . . . . . . . . . . . . . . . . . . . . . . . . . . . . . . . . . . . . . . . . . . . . . . . . . . . . . . . . . . . . . . . . . . . . 36
Strategic Action Plan. . . . . . . . . . . . . . . . . . . . . . . . . . . . . . . . . . . . . . . . . . . . . . . . . . . . . . . . . . . . . . . . . . . . . . . . . . 37
       Action Plan for Change. . . . . . . . . . . . . . . . . . . . . . . . . . . . . . . . . . . . . . . . . . . . . . . . . . . . . . . . . . . . . . . . 38
       Overview of Goals. . . . . . . . . . . . . . . . . . . . . . . . . . . . . . . . . . . . . . . . . . . . . . . . . . . . . . . . . . . . . . . . . . . . 38
Recommendations for ED Structuring. . . . . . . . . . . . . . . . . . . . . . . . . . . . . . . . . . . . . . . . . . . . . . . . . . . . . . . . . . . . .44
       Roles of Public-Private Organizations. . . . . . . . . . . . . . . . . . . . . . . . . . . . . . . . . . . . . . . . . . . . . . . . . . . 44
       Public/Private EDO Structure and Governance. . . . . . . . . . . . . . . . . . . . . . . . . . . . . . . . . . . . . . . . . . . 45
       Advantages & Limitations of Public-Private EDOs. . . . . . . . . . . . . . . . . . . . . . . . . . . . . . . . . . . . . . . . . 46
       Limitations. . . . . . . . . . . . . . . . . . . . . . . . . . . . . . . . . . . . . . . . . . . . . . . . . . . . . . . . . . . . . . . . . . . . . . . . .47
       Conclusion. . . . . . . . . . . . . . . . . . . . . . . . . . . . . . . . . . . . . . . . . . . . . . . . . . . . . . . . . . . . . . . . . . . . . . . . .47
Implementation Matrix “How We Get There?”. . . . . . . . . . . . . . . . . . . . . . . . . . . . . . . . . . . . . . . . . . . . . . . . .48
Appendix. . . . . . . . . . . . . . . . . . . . . . . . . . . . . . . . . . . . . . . . . . . . . . . . . . . . . . . . . . . . . . . . . . . . . . . . . . . . . . . .51
       Appendix A: Retail Gap Analysis. . . . . . . . . . . . . . . . . . . . . . . . . . . . . . . . . . . . . . . . . . . . . . . . . . . . . . . 51
       Appendix B: Community Development Districts. . . . . . . . . . . . . . . . . . . . . . . . . . . . . . . . . . . . . . . . . . 66
       Appendix C: Example of Local Incentive (Ormond Beach). . . . . . . . . . . . . . . . . . . . . . . . . . . . . . . . . . .67
       Appendix D: Existing Industry Survey (Example). . . . . . . . . . . . . . . . . . . . . . . . . . . . . . . . . . . . . . . . . . 69
       Appendix E: Existing Industry Survey. . . . . . . . . . . . . . . . . . . . . . . . . . . . . . . . . . . . . . . . . . . . . . . . . . . .72
       Appendix F: Johns Creek Shopping Center Census. . . . . . . . . . . . . . . . . . . . . . . . . . . . . . . . . . . . . . . . .75
       Appendix G: Example of a Memorandum of Understanding. . . . . . . . . . . . . . . . . . . . . . . . . . . . . . . . .77

  Strategic Planning Group, Inc.                                                                                                                                   5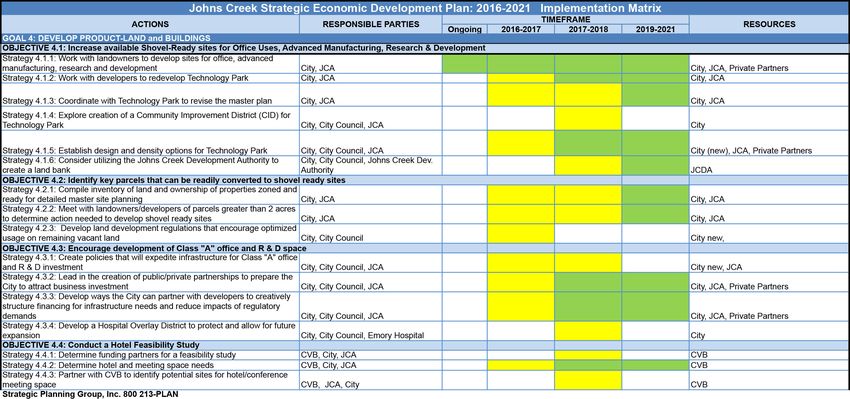
SEDP: 2016-2021                                                Profile: Where Are We Now?

JOHNS CREEK PROFILE
                                                            Technology Park Johns Creek was established in
“WHERE ARE WE NOW?”                                         1981 as a second business campus for its neigh-
The City of Johns Creek incorporated in 2006. The           bor to the south, Technology Park Atlanta. The
city consists of approximately 32 square miles and          park was envisioned as Atlanta’s center for high
has a population of approximately 83,000 resi-              tech employment where working, living and recre-
dents. The city is located in the northeast portion         ation could all take place in the same environment.
of Fulton County, adjacent to Gwinnett County on            Technology Park Johns Creek is the first southeast-
the south and Forsyth County on the northeast.              ern US property to win the prestigious FIABCI Prix
Historically a bedroom community to the great-              d’Excellence Award for “Best Office/Industrial Prop-
er Atlanta area, Johns Creek consists primarily             erty Worldwide,” a globally recognized award from
of newer (30 years or less) subdivisions and res-           the Paris-based International Real Estate Federa-
idential uses with the majority of commercial               tion. Today, businesses in Technology Park Johns
and retail uses located along linear arterial strips.       Creek employ more than 10,000 employees, and
                                                            the Park contains nearly 6 million square feet of
Figure 1: Johns Creek Location Map.                         developed office and industrial space. While envi-
                                                            sioned as a work/live/play development, the Park
                                                            was nonetheless planned as a 1980s suburban of-
                                                            fice park using the “campus” concept of separate
                                                            and highly buffered development parcels or pods.

                                                            Today, Johns Creek is acknowledged as one of the
                                                            premier communities in the Atlanta region, and is
                                                            home to some of the best schools in the country.

                                                            Figure 2: Technology Park at Johns Creek.

Source: City of Johns Creek, 2015.

While the city only recently incorporated, the area
known as Johns Creek developed as a premier golfing
destination starting in the late 1960s. The prestigious
Atlanta Athletic Club (AAC) is a private club dating back
to 1898. AAC moved to the present Johns Creek loca-
tion in the late 1960s and is known nationally and in-
ternationally for its facilities, having been chosen as a   Source: Strategic Planning Group, Inc., 2015.
Platinum Club every year by the Club Leaders Forum.

  Strategic Planning Group, Inc.                                                                            6
SEDP: 2016-2021                                          Profile: Where Are We Now?

Figure 3: Technology Park.                              Johns Creek’s population is slightly less than its sur-
                                                        rounding communities, with the exception of Al-
                                                        pharetta. All of these communities are projected
                                                        to experience similar growth trends through 2019.

                                                        Figure 5: Comparative Population Estimates.

                                                        Source: U.S. Census, American Community Survey, 2015;
                                                        Strategic Planning Group, Inc.

Source: City of Johns Creek, 2015.                  Johns Creek’s Race and Ethnicity is unique in
                                                    its composition. The city has a highly diverse
DEMOGRAPHICS                                        racial composition as shown below. Accord-
Johns Creek is largely built-out. The city’s 2014 ing to the U.S. Census, White residents repre-
population estimate is 83,213 residents and is pro- sent 63.5% of Johns Creek residents, followed by
jected to increase to 89,818 residents by 2019, a 23% Asian, 9.3% Black and 5.2% Hispanic/Latino.
gain of 6,605 residents. The largest demograph-
ic is within the 40-49 age group whose children Figure 6: Racial Composition Comparison.
(10-19 age) represents the second largest group.

Figure 4: Demographics.

                                                        Source: U.S. Census, American Community Survey, 2015;
                                                        Strategic Planning Group, Inc.

Source: U.S. Census, American Community Survey, 2015;
Strategic Planning Group, Inc.

  Strategic Planning Group, Inc.                                                                                7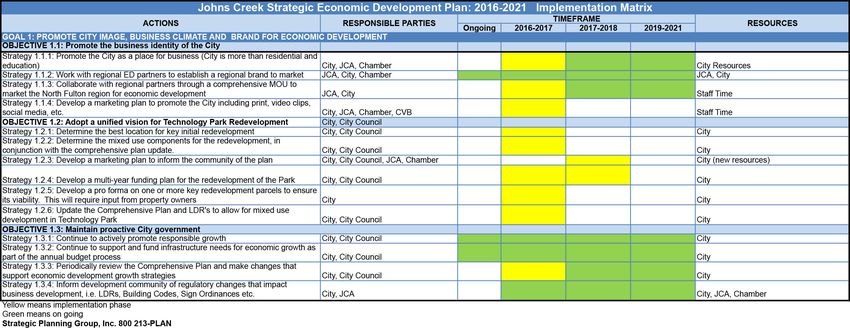
SEDP: 2016-2021                                               Profile: Where Are We Now?

The city’s Asian population is primarily com- As would be expected with its high education
posed of three ethnicities: Indian, Korean and levels, the city has a very high household me-
Chinese as shown in the following graphic. dian income. This is significantly higher than
                                               the other areas of North Fulton/Atlanta which
Figure 7: Asian Population.                    can be linked to the city’s high quality of life.

                                                        Figure 9: Median Income.
                                                                                 Median Income

                                                                     $109,224
                                                                                   $86,355
                                                                                              $79,579
                                                                                                        $63,134
                                                                   Johns Creek
                                                                                 Alpharetta
                                                                                              Roswell
                                                                                                        Sandy
                                                                                                        Springs
                                                        Source: U.S. Census, American Community Survey, 2015;
Source: U.S. Census, American Community Survey, 2015;
                                                        Strategic Planning Group, Inc.
Strategic Planning Group, Inc.

                                                        Figure 10: Comparative Housing Ownership.
SOCIO-ECONOMICS
Johns Creek residents are highly educated with
61% having a college degree or higher. Johns Creek
residents have the highest percentage of gradu-
ate degrees compared to the rest of North Fulton.

Figure 8: Comparative Educational Attainment.

                                                        Source: U.S. Census, American Community Survey, 2015;
                                                        Strategic Planning Group, Inc.

                                                        EMPLOYMENT/BUSINESSES
                                                        Of the North Fulton market, Johns Creek has the
                                                        smallest number of business establishments. Sandy
                                                        Springs, due to its favorable location on Atlanta’s
                                                        perimeter has the highest number of businesses.

Source: U.S. Census, American Community Survey, 2015;
Strategic Planning Group, Inc.

 Strategic Planning Group, Inc.                                                                                   8
SEDP: 2016-2021                                           Profile: Where Are We Now?

Figure 11: Number of Business Establishments.           Johns Creek’s business establishments are
                                                        predominately small (1-4 employees).

                                                        Figure 13: Johns Creek Size of Businesses.

Source: U.S. Census, American Community Survey, 2015;
Strategic Planning Group, Inc.

When analyzing the North Fulton market, the Source: U.S. Census, American Community Survey, 2015;
trends for the number of businesses and number Strategic Planning Group, Inc.
of employees changes. While Johns Creek still has
the smallest number of employees, it is interesting Most of the city’s employment is found within the
to note that Alpharetta has more employees Service and Retail sectors.
than Roswell, indicating larger firms (commercial
and retail) being located within its boundaries. Figure 14: Employees by SIC code.

Figure 12: Total Employees.

                                                        Source: U.S. Census, American Community Survey, 2015;
                                                        Strategic Planning Group, Inc.
Source: U.S. Census, American Community Survey, 2015;
Strategic Planning Group, Inc.
                                                        JOHNS CREEK LABOR SHED
                                                        Based on U.S. Department of Labor statistics,
                                                        only 2,171 residents reside and work within

 Strategic Planning Group, Inc.                                                                                 9
SEDP: 2016-2021                                      Profile: Where Are We Now?

the city.    Slightly over 29,000 Johns Creek      The following graphic provides information as to
residents work/commute outside of the city         the general directions of where Johns Creek em-
while almost 17,000 Johns Creek employees          ployees are coming from as well as distance trav-
live outside the city and commute into the city.   eled. It is interesting to note that 3,500 employees
                                                   drive greater than 50 miles to jobs in Johns Creek.
Figure 15: Employee Commute Pattern.
                                                   Figure 17: Direction of Commute Patterns.

Source: U.S. Census, On the Map, 2015.             Source: U.S. Census, On the Map, 2015.

The city has a large labor shed as shown be- WHERE JOHNS CREEK RESIDENTS WORK
low. Each dot or concentration of blue dots in- As shown below, most Johns Creek residents work
dicate the location of Johns Creek workers. in close proximity to State Road 400, primarily with-
                                                in Roswell and Alpharetta although a significant
Figure 16: Labor Shed.                          number work in Sandy Springs and North Atlanta.

                                                   Figure 18: Resident Commute Patterns.

Source: U.S. Census, On the Map, 2015.

                                                   Source: U.S. Census, On the Map, 2015.

  Strategic Planning Group, Inc.                                                                10
SEDP: 2016-2021 Profile: Where Are We Now?
OFFICE MARKET SECTOR has seen positive absorption since the 4th quarter
The Atlanta office market is divided into eight geo- 2013 and asking rents are increasing. Office lease
graphic submarkets for purposes of analysis by most rates for the 1st quarter 2015 averaged slight-
of the commercial brokers within the Atlanta region. ly under $20 for all classes of space (A, B and C).
Johns Creek falls within the North Fulton market. The
majority of workers drive less than 25 miles from home. Figure 21: North Fulton Office Submarket.
Figure 9: Atlanta Office Submarkets.
Source: SavillisStudley, 2015. Source: DTZ, 2015.
Most of the major commercial real estate bro- Figure 22: North Fulton Office Vacancy.
kers maintain their own inventory of office space.
As of the second quarter 2015, the Atlanta of-
fice market has 221.5 million sq. ft. of total space.
Figure 20: Atlanta Submarket Occupancy.
Source: DTZ, 2015.
The North Fulton Existing Office Inventory is approx-
imately 28 million sq. ft. which represents 12.6%
Source: DTZ, 2015. of the Atlanta market, while the North Fulton sub-
market accounts for 13.6% of the region’s vacancy.
The Atlanta office market is rebounding from the
Great Recession. As shown below, the North Ful-
ton market experienced significant retraction, but
Strategic Planning Group, Inc. 11SEDP: 2016-2021 Profile: Where Are We Now?
Table 123: Comparative North Fulton Office
Inventory, 2nd Quarter 2015.
Existing Inventory Total Vacancy N Fulton
Class Atlanta N Fulton % Atlanta N Fulton % Vacancy
A 112,508,526 15,408,694 13.7% 15,139,176 2,052,447 13.6% 13.3%
B 89,103,490 11,365,658 12.8% 14,543,897 1,647,373 11.3% 14.5%
C 19,920,804 1,139,580 5.7% 2,884,230 96,521 3.3% 8.5%
Total 221,532,820 27,913,932 12.6% 32,567,303 3,796,341 11.7% 13.6%
Source: Strategic Planning Group, Inc., 2015.
JOHNS CREEK OFFICE MARKET SECTOR lack of new inventory, vacancies have declined from
Based on interviews with local commercial real historic levels and lease rates have begun to recover.
estate brokers, Johns Creek represents about
3% of the North Fulton office market. The city Figure 23: Atlanta Industrial Market.
has slightly over 3 million sq. ft. of office space
with almost 377,000 sq. ft. of vacant space. Av-
erage rental rates within Technology Park are
among the lowest in the market at $17.92 sq. ft.
Table 2: Johns Creek Office Market.
Technology Remainder
Park of City Total
Inventory 2,618,879 473,750 3,092,629
No of Buildings 27 14 41
Vacant Stock 315,698 60,825 376,523
Vacancy Rate 12.10% 12.80% 12.17%
Total Net Absorption 101,893 (6,633) 95,260
New Construction - - -
Average Rental Rate $17.92 $20.56
Source: CoStar; Strategic Planning Group, Inc.
In a more detailed analysis of leasable space in non-
single user buildings, over 1 million sq. ft. of inven-
tory exists, 32% (or 348,000 sq. ft.) of which is avail-
able. Most of the vacancy is in Class B space. Within
Class A properties, there is a current vacancy of 17%.
ATLANTA INDUSTRIAL MARKET
Atlanta’s industrial market was also impacted by the Source: DTZ, 2015.
Great Recession, but began to recover in 2011. With
Strategic Planning Group, Inc. 12SEDP: 2016-2021 Profile: Where Are We Now?
Johns Creek falls within the North Center Atlan- As of the 1st Quarter 2015, warehouse lease rates
ta Industrial submarket. The North Center sub- are almost $4 per sq. ft. and flex space is $8 per sq.
market is the largest of Atlanta’s industrial sub- ft.
markets, with an inventory of approximately
128 million sq. ft. The submarket has 257,000 Figure 26: Warehouse/Flex Asking Rents.
sq. ft. of available space (10% vacancy).
Figure 24: Atlanta Industrial Submarkets.
Source: DTZ, 2015.
RETAIL MARKET
Johns Creek falls within the Roswell/Alpharetta/
West Gwinnett Retail Submarket.
Figure 27: Atlanta Retail Submarkets.
Source: NAI Brannen Goddard, 2015.
The two largest industrial submarkets are the
Northeast and the South Atlanta markets.
Figure 25: Atlanta Industrial Submarket Occupancy.
Source: SavillsStudely, 2015.
Source: DTZ, 2015.
Strategic Planning Group, Inc. 13SEDP: 2016-2021 Profile: Where Are We Now? Johns Creek lies within the primary and/or second- ary markets of seven major regional retail centers: Avalon, Gwinnett Place Mall, Mall of Georgia, North Point Mall, Perimeter Mall, the Forum and the Col- lection at Forsyth. The following graphic shows Johns Creek’s relative position to the surrounding region- al retail center markets at 5, 10 and 15 mile radii. Figure 28: Johns Creek Competitive Retail Shed. Source: Strategic Planning Group, Inc., 2015. SPG analyzed special retail market statistics from Nelson (Claritas) to determine what retail gaps exist within the City of Johns Creek. The following table summarizes the analyses (see appendix for details). Within a 5 mile radius of McGinnis Ferry Road and SR 141, there is an estimated retail gap of $1.1 billion. However as mentioned, the city falls within the larg- er retail markets of seven retail centers. At 10 miles, there is a net surplus of $3.8 billion, meaning there is more supply than demand (again showing the competition from the surrounding regional centers). Strategic Planning Group, Inc. 14
SEDP: 2016-2021                                                                Profile: Where Are We Now?

Table 3: Johns Creek Regional Retail GAP Analysis.
                                                                           5-Mile Radius          10-Mile Radius        15-Mile Radius
                                                                            Opportunity            Opportunity           Opportunity
                           Retail Stores                                    Gap/Surplus             Gap/Surplus         Gap/Surplus
       Total Retail Sales & Eating, Drinking Places                         $1,128,823,684          -$3,846,696,312     -$2,572,629,434

       Motor Vehicle & Parts Dealers-441                                        $395,682,017        -$2,138,285,114     -$2,401,033,922
       Furniture & Home Furnishings Stores-442                                    $50,464,705          -$24,208,917         -$32,676,404
       Electronics & Appliances Stores-443                                        $12,377,213          -$53,924,513         -$77,832,156
       Building Material, Garden Equipment Stores -444                          $110,996,547           -$56,011,626        $208,423,605
       Food & Beverage Stores-445                                              -$124,175,354            $17,964,273        $465,833,583
       Health & Personal Care Stores-446                                          $59,047,939           $44,987,893        $221,260,739
       Gasoline Stations-447                                                    $195,267,744            $64,576,734          $86,924,000
       Clothing & Clothing Accessories Stores-448                               $133,591,222           -$90,711,510          $85,879,210
       Sporting Goods, Hobby, Book, Music Stores-451                              $36,027,760          -$10,152,727          $79,929,196
       General Merchandise Stores-452                                           $221,072,996          -$124,989,748        $263,774,667
       Miscellaneous Store Retailers-453                                          $41,467,323           $73,538,750        $219,748,694
       Non-Store Retailers-454                                                    $15,893,407       -$1,114,812,847     -$1,249,757,453
       Foodservice & Drinking Places-722                                         -$18,889,835         -$434,666,962       -$443,103,193
       GAFO *                                                                   $470,125,426          -$291,943,855        $404,763,645
       General Merchandise Stores-452                                           $221,072,996          -$124,989,748        $263,774,667
       Clothing & Clothing Accessories Stores-448                               $133,591,222           -$90,711,510          $85,879,210
       Furniture & Home Furnishings Stores-442                                    $50,464,705          -$24,208,917         -$32,676,404
       Electronics & Appliances Stores-443                                        $12,377,213          -$53,924,513         -$77,832,156
       Sporting Goods, Hobby, Book, Music Stores-451                              $36,027,760          -$10,152,727          $79,929,196
       Office Supplies, Stationery, Gift Stores-4532                              $16,591,529           $12,043,560          $85,689,132
       *GAFO (General Merchandise, Apparel, Furniture and Other) represents sales at stores that sell merchandise normally sold in
       department stores. This category is not included in Total Retail Sales Including Eating and Drinking Places.

Source: Claritas, Inc., 2015.
                                                                           Table 4: Johns Creek Retail Inventory.
Based on CoStar data, Johns Creek had slightly over                        •     655,409 sq. ft. Retail (RBA), in 29 bldg.
655,000 sq. ft. of retail space and a vacancy of 12.3%                     •     80,608 sq. ft. Vacancy
in 2014.                                                                   •     Vacancy Rate 12.3%
                                                                           •     Lease $14.85
                                                                           Source: CoStar, City of Johns Creek, 2015.

  Strategic Planning Group, Inc.                                                                                                     15
SEDP: 2016-2021 Profile: Where Are We Now? The city analyzed its shopping centers during July 2015 and found a retail vacancy rate of 18%. As shown, the majority of shopping centers located in the western portion of the city are experiencing large vacancy rates (orange dots represent 21-40% vacancies and red represents 41-80% vacancies). Figure 29: Johns Creek Shopping Center Vacancies. Source: City of Johns Creek, 2015. Strategic Planning Group, Inc. 16
Economic Development Issues.
                  SEDP: 2016-2021                                         Which Direction Should We Go?

ECONOMIC DEVELOPMENT ISSUES                              will become Class B, and the Class B will become
                                                         Class C, resulting in a reduction in property taxes.
IDENTIFICATION AND PRIORITIZATION
“WHICH DIRECTION SHOULD WE GO?”                          Figure 30: Johns Creek Vacant Parcels.
As stated in the city’s Request for Proposal, “Johns
Creek needs a strategy for addressing the economic
needs of the entire city to assure continued and en-
hanced economic health, tax base expansion, quali-
ty job creation and support for municipal services.”
The economic challenges facing the city and the
economy of the region mandate the need to diversi-
fy and expand the economic base in order to assure
the future prosperity of the city and its residents.
Specifically, there is a need to address the long-term
pertinent challenges which the city faces including:

        1. Limited availability of land – Few par-
           cels of land are currently zoned and/
                                                         Source: City of Johns Creek, 2015.
           or available for development, creating
           challenges in meeting prospect site
           needs in a largely “built out” community      WHY ECONOMIC DEVELOPMENT?
           and creating cost issues.                     To achieve economic prosperity, the city needs
        2. Few economic incentives are currently         new investments, increased public/private part-
           available.                                    nerships and increased high paying job creation. It
        3. Redevelopment and revitalization needs        also needs to maintain and protect the assets that
           and opportunities in the city.                have resulted in its reputation as one of Atlanta’s
        4. Pipeline of employees for the workforce.      premier communities (i.e. municipal services/facili-
                                                         ties, quality education and high income households).
To continue to provide its citizens with the quality
municipal services and facilities the city needs to be Figure 31: Reasons for Johns Creek Strategic
able to increase and diversify its revenue streams. Economic Development Plan.
Today, about 72% of its revenue is from proper-
ty and sales taxes. The relative growth of both is
threatened without major intervention on the part
of local government. Technology Park is a major
contributor to both sources of revenues, yet it is
over 30 years old and its design as a 1980s subur-
ban business campus is outdated. With limited
undeveloped land, there are few options for rede-
velopment other than the Technology Park. With-
out structural changes, the existing Class A offices Source: Strategic Planning Group, Inc., 2015.

 Strategic Planning Group, Inc.                                                                       17
Economic Development Issues.
SEDP: 2016-2021 Which Direction Should We Go?
Given the city’s limited undeveloped land, it is im- Figure 33: Revenue per Acre, Asheville.
portant to analyze property tax revenue in terms
of revenue per acre versus revenue per parcel.
Municipalities throughout the United States have
begun to analyze revenue potential on an acre ba-
sis. Simply stated, parcels of land with mixed use
or high intensity generate more revenue, which
can more easily be seen in the following graphics.
In a major revenue study by Urban3 comparing 15 dif-
ferent cities, a single family home generated $3.70 in
general funds per acre while a Walmart generated $7
per acre. This compared to $53 per acre for a two story
mixed-use building (over 7x higher than a Walmart), Revenues and job creation are also higher on a de-
or almost $106 per acre for a 3 story mixed-use devel- velopment acre basis. A more recent study of Ashe-
opment. The study found that a six story mixed-use ville, North Carolina, demonstrated that a Walmart
development generated $415 per acre, the equiva- on 34 acres generated only $6,500 per acre in to-
lent of 1,200 single family homes or 59 Walmarts. tal county/city taxes and $47,500 in sales taxes
per acre compared to a six story downtown mixed-
Figure 32: Comparison of Revenue Generation by use development on 0.2 acre which generated
Acre. $634,000 in property taxes per acre and $83,600 in
sales tax per acre (176% more than the Walmart).
Figure 34: Comparison of Development Types by
Acre Revenue.
Source: Urban 3, 2015.
In an analysis for Asheville, North Carolina, the an-
nual tax yield per acre showed similar results.
Strategic Planning Group, Inc. 18Economic Development Issues.
SEDP: 2016-2021 Which Direction Should We Go?
TARGET INDUSTRY PROCESS Numerous economic development groups, including
In having a discussion on the appropriate target in- state, regional and county organizations within the
dustries for Johns Creek, it is important to provide overall market area, have prepared detailed target
some perspective regarding the correlation between industry studies that can directly assist the city in its
the target industries identified for the Atlanta Region, economic development efforts. Most of the industries
Fulton County and the City of Johns Creek Strategic discussed below are referred to as “Target Industries”
Economic Development Plan (SEDP). The recommen- which for this report means “value added”. A city,
dations in the SEDP were developed to complement unlike a state, region or county, is more dependent
target industries already identified in the region. on property taxes for revenue. Therefore, a city’s tar-
Economic development staffs seek out target indus- get industries or businesses also may include retail.
tries usually in conjunction with regional economic
development agencies, state economic develop- REVIEW OF EXISTING TARGET INDUSTRIES
ment agencies and large utility providers through State of Georgia
hosting site selection events and by attending target Site Selection Magazine, an important data source for
industry related national and regional trade shows. site selectors and economic development profession-
als, gave the State of Georgia a first-place finish in Site
Communities can and should work to influence Selection’s ranking of state business climates for 2014
the target industry decision makers to invest in a (the latest ranking) and for 2013. The magazine notes
community by providing the right data and hav- that the state has been a strong performer for sev-
ing that data organized and made easily under- eral years, thanks in part to its Quick Start workforce
standable. This data should be available on the training program, logistics infrastructure and eco-
web and efforts need to be made to meet with nomic development leadership, among other factors.
regional commercial real estate brokers to up-
date the data and to assist with broker needs. Figure 35: Atlanta Business Clusters, 2014.
TARGET INDUSTRIES
Target industry businesses bring quality job growth
to a community, thus making a significant econom-
ic contribution. Most communities use a measure-
ment of paying an average annual wage that is at
least 115/125 percent of a state, metropolitan sta-
tistical area (MSA), or local average wage in order
to qualify for a target industry job creation incen-
tive. Communities select the types of target indus-
tries that aid in providing economic diversification,
pay higher wages, retain young professionals, en-
hance economic growth, meet a variety of skill
sets and leverage local assets and infrastructure.
Source: Harvard Business School, 2014.
Strategic Planning Group, Inc. 19Economic Development Issues.
SEDP: 2016-2021 Which Direction Should We Go?
Atlanta Region The major target clusters for the Atlanta MSA are
The Institute for Strategy and Competitiveness at identified as the following:
Harvard’s Business School has been studying the na- 1. Apparel, ranked 3rd nationally
tion’s major metropolitan areas (MSAs) as to each 2. Communication Equipment and Services, ranked
area’s competitive business clusters. As shown 3rd nationally
in the graphics below, the Atlanta region (Atlan- 3. Music and Sound Recording
4. Transportation and Logistics, ranked 4th nationally
ta-Sandy Springs-Roswell MSA) shows a high con-
5. Distribution and Electronic Commerce, ranked 5th
centration of employment in ten major sectors:
nationally
6. Video Production and Distribution, ranked 5th
1. Business Services
nationally
2. Distribution and Electronic Commerce 7. Business Services, ranked 7th nationally
3. Transportation and Logistics 8. Insurance Services, ranked 9th nationally
4. Education and Knowledge Creation 9. Marketing, Design and Publishing, ranked 9th
5. Hospitality and Tourism nationally
6. Communications Equipment and Services
7. Financial Services Figure 36: Atlanta Cluster Porttfolio.
8. Insurance Services
9. Marketing, Design, and Publishing
10. Information Technology and Analytical Instru-
ments
While these concentrations of employment are im-
portant, they are not in themselves considered true
business clusters, which compete on a national/re-
gional scale (import revenues from outside of Atlanta/
Georgia) and are considered as major target sectors.
Business clusters are important in developing em-
ployment and target industry strategies. Studies
about what businesses consider in site location have
shown that the presence of businesses similar to
theirs (clusters) was a consideration when selecting Source: Harvard University, 2014.
a site. Brookings Institution has shown that “strong
clusters foster innovation through dense knowledge The Atlanta Regional Commission (representing
flows and spillovers, strengthen entrepreneurship Cherokee, Clayton, Cobb, DeKalb, Douglas, Fay-
by boosting new enterprise formation and start- ette, Fulton, Gwinnett, Henry and Rockdale Coun-
up survival, enhance productivity, income levels, ties) has identified the four (4) employment hubs
and employment growth in industries, and posi- and following target industries that comprise 4
tively influence regional economic performance.” major hubs and 16 business sectors to target.
Strategic Planning Group, Inc. 20Economic Development Issues.
SEDP: 2016-2021 Which Direction Should We Go?
Knowledge Hub Fulton County Target Industries
• Information Technology The Fulton County Economic Development Division
• Telecommunications lists seven (7) target industry sectors:
• Corporate and Regional Headquarters • Aerospace Logistics & Transportation
• Professional Services • Clean Technologies
• Corporate and Customer Support Operations • Life Sciences
• Energy & Environment Information
Logistics Hub • Technology
• Supply Chain Management • Financial Services
• Transportation Services • Logistics and Transportation
• Warehousing and Storage
• Wholesale Trade DeKalb County Target Industries
DeKalb County has identified six (6) target business
Production Hub sectors:
• Paper, Plastics, and Chemicals • Health & Life Sciences
• Transportation Equipment • Logistics & Distribution
• Metal and Metal Products • Professional & Business Services
• Computer, Electronic, and Electrical Equipment • Tourism Services & Tour Packages
• Construction & Industrial Supplies
Entertainment Hub • Advanced Manufacturing
• Film, Music, and Television
• Arts and Entertainment Cobb County Target Industries
• Hospitality Cobb County has identified seven (7) target busi-
ness sectors:
Figure 37: Atlanta Region Target Industries. • Aerospace and Advanced Equipment Manufac-
turing
• Information Technology and Software
• Professional and Business Services
• Wholesale Trade and Logistics
• Health Care Services
• Travel and Tourism
• Bioscience
The following cities within the North Fulton Market
are described below:
Sandy Springs Target Industries
Sandy Springs, located within and north of the Atlanta
perimeter, is the second largest city in the Atlanta MSA.
Incorporated in 2005, the city is home to the MSA’s
Source: Atlanta Regional Commission. largest office market with 29 million sq. ft. of office
Strategic Planning Group, Inc. 21Economic Development Issues.
SEDP: 2016-2021 Which Direction Should We Go?
space. It is primarily focusing on four target sectors: JOHNS CREEK TARGET INDUSTRIES OVERVIEW
• Medical and Biotechnology The following chart highlights the critical require-
• Business Services and Logistics ments that Site Selector’s view as the most im-
• Technology portant locational criteria when looking to move or
• Small Businesses expand to a new location. Site location studies are
highly competitive by nature, both at the regional
In addition, Google has recently announced San- level and the local or city level. Today, Johns Creek
dy Springs as one of its Google Fiber cities. Goo- competes with Alpharetta, Sandy Springs, Roswell
gle is building an ultra-high-speed broadband and Peachtree Corners for jobs. From a competitive
network delivering 1 gigabit per second con- standpoint, the city does not have strong compet-
nections. Mercedes Benz has also announced itive transportation access, nor the same broad-
it will locate its North American Headquar- band facilities and redundancy as its competition.
ters in the city and employ over 1,000 people. While the city is largely built out, its existing office and
industrial market is competitive and in most cases, less
City of Roswell Target Industries expensive than its competition. As discussed earlier,
The City of Roswell, which borders the City of Johns the city does have a large amount of vacant office/
Creek to the northwest, is an older city located on industrial space, but little vacant developable land.
Highway 400 and is largely built-out. Its economic de-
velopment efforts focus is on four (4) target sectors:
• Small Business & Professional Services
• Restaurant Industry
• Healthcare
• Logistics
City of Alpharetta Target Industries
The City of Alpharetta, which borders Johns Creek
to the west, has over 600 technology companies,
and more than 20 million square feet of office
space. Unlike its surrounding communities, Al-
pharetta is not built out and has ample vacant land
to expand. The city is focused on industrial devel- Based on business licenses, Johns Creek has 2,573
opment and is not seeking major residential con- businesses within its boundaries. Most of the busi-
struction. The city’s top target industry sectors are: nesses provide services to residents and other busi-
• Corporate and Regional Headquarters nesses within the city, are not primary industries,
• Information Services and therefore are not considered targeted clusters.
• Telecommunications While the city does not have true industry clusters,
• Healthcare IT it does have several large and nationally promi-
• Retail Trade nent businesses like Alcon which manufactures a
significant portion of the nation’s contact lenses.
Strategic Planning Group, Inc. 22Economic Development Issues.
SEDP: 2016-2021 Which Direction Should We Go?
Technology Park at Johns Creek Major tenants include: Alcon, State Farm’s southern
The economic platform for what is now Johns Creek regional headquarters, SAIA, World Financial Group,
had its beginning with the development of the Tech- Nordson Corporation and Emory Johns Creek Hos-
nology Park at Johns Creek in 1981. The park, which pital. Ebix, Inc. is a leading international supplier of
falls within both Fulton and Forsyth counties, con- on-demand software and e-commerce services to
tains approximately 1,900 acres and has over 10,000 the insurance industry. They recently purchased an
workers. 11.6 acre, 100,000 sq. ft. office complex (within the
The portion of the Technology Park located within Technology Park) where it will consolidate and ex-
the City of Johns Creek contains over 3 million sq. pand its workforce. The company moved to Johns
ft. of office and 913,000 sq. ft. of industrial space. Creek from Sandy Springs. Factors concerning its
Table 5: Johns Creek Businesses by 2 Digit NAICS code. Source: U.S. Department of Commerce, 2015.
Number of E mployer Annual
Meaning of employer value of payroll
2007 establishments sales, ($1,000)
Geographic Type of
NAIC S Meaning of 2007 NAIC S code Year shipments,
area name operation or tax
code receipts,
status code
revenue, or
J ohns C reek 31-33 Manufacturing Total 2007 11 D D
J ohns C reek 42 W holesale trade Merchant 2007 70 327,764 20,280
J ohns C reek 44-45 R etail trade Total 2007 161 409,183 47,333
J ohns C reek 51 Information Total 2007 32 N 10,567
J ohns C reek 53 R eal estate and rental and leasing Total 2007 107 67,464 17,090
J ohns C reek 54 P rofessional, scientific, and technical services All 2007 446 257,252 95,134
J ohns C reek 54 P rofessional, scientific, and technical services E stablishments 2007 446 257,252 95,134
J ohns C reek 56 Administrative and support and waste Total 2007 108 171,616 116,963
J ohns C reek 61 E ducational services All 2007 41 31,102 8,889
J ohns C reek 61 E ducational services E stablishments 2007 38 29,658 8,263
J ohns C reek 61 E ducational services E stablishments 2007 3 1,444 626
J ohns C reek 62 Health care and social assistance All 2007 123 77,551 27,802
J ohns C reek 62 Health care and social assistance E stablishments 2007 121 D D
J ohns C reek 62 Health care and social assistance E stablishments 2007 2 D D
J ohns C reek 71 Arts, entertainment, and recreation All 2007 24 D D
J ohns C reek 71 Arts, entertainment, and recreation E stablishments 2007 21 26,075 12,203
J ohns C reek 71 Arts, entertainment, and recreation E stablishments 2007 3 D D
J ohns C reek 72 Accommodation and food services Total 2007 112 85,317 26,576
J ohns C reek 81 Other services (except public administration) All 2007 99 41,262 13,534
J ohns C reek 81 Other services (except public administration) E stablishments 2007 91 D D
J ohns C reek 81 Other services (except public administration) E stablishments 2007 8 D D
D W ithheld to avoid disclosing data for individual companies; data are included in higher level totals
f 500 to 999 employees
N Not available or not comparable
b 20 to 99 employees
e 250 to 499 employees
c 100 to 249 employees
a 0 to 19 employees
Strategic Planning Group, Inc. 23Economic Development Issues.
SEDP: 2016-2021 Which Direction Should We Go?
move involved the availability and cost of a vacant As discussed above, the city’s core businesses are pro-
LEED Gold certified building, and the location of its fessional, scientific, and technical services followed
labor shed. Another major firm located within Johns by health care, finance and insurance, and retail.
Creek but outside the Technology Park is Macy’s Sys-
tem Technology. Figure 38: Johns Creek Businesses by NAICS code.
The 2007 Economic Census data is the latest data avail-
able for the City of Johns Creek and is shown below.
Data on the 2012 Economic Census is just starting to
be released. However, data on manufacturing is the
only data currently available. Economic Census data
from 2012 indicates that the city gained an additional
3 manufacturing companies for a total of 14 compa-
nies. Other than the number of firms, all other data on
manufacturing within the city has been suppressed.
Using the city’s business license data, Strategic Plan-
ning Group (SPG) analyzed Johns Creek’s businesses
Source: US Department of Commerce, 2015.
by NAICS code. As shown below, the city has 2,731
business establishments of which the largest is in six
SPG analyzed the city’s economic base, strengths,
sectors: Professional Services, Health Care, Finance/
weaknesses and opportunities with respect to re-
Insurance, Retail Trade, Other Services and Con-
gional employment growth and state, regional, and
struction.
other competitive city target industries to deter-
mine specific target opportunities for Johns Creek.
Table 5: Johns Creek Businesses by 2 Digit NAICS code.
Sector Description Number of
11 Agriculture, Forestry, Fishing and Hunting
Establishments
1 RECOMMENDED JOHNS CREEK
21 Mining, Quarrying, and Oil and Gas Extraction -
22 Utilities 1 TARGET INDUSTRIES
23 Construction 193
31-33 Manufacturing 28 Johns Creek Target Industry Process
42 Wholesale Trade 184
44-45 Retail Trade 278
48-49 Transportation and Warehousing 9 Figure 39: Target Industry Process.
51 Information 19
52 Finance and Insurance 306
53 Real Estate and Rental and Leasing 111
54 Professional, Scientific, and Technical Services 576
55 Management of Companies and Enterprises 11
Administrative and Support and Waste
56
Management and Remediation Services 129
61 Educational Services 90
62 Health Care and Social Assistance 323
71 Arts, Entertainment, and Recreation 57
72 Accommodation and Food Services 178
81 Other Services (except Public Administration) 237
92 Public Administration -
2,731
Source: US Department of Commerce, 2015.
Strategic Planning Group, Inc. 24Economic Development Issues.
SEDP: 2016-2021 Which Direction Should We Go?
Johns Creek’s primary assets are its quality of life has been the revival of the financial services sector.
and reputation as one of the highest income and
amenity communities in Atlanta, if not the South- Technological and creative sectors have represent-
east. Equally important to the city’s economic de- ed another significant employment driver and are
velopment efforts is the Technology Park at Johns referred to as the TAMI sectors—technology, ad-
Creek, which is home to financial and data service vertising, media and information. There has been a
providers. City residents are highly educated and major change in office users over the last ten years.
have prompted a national ranked school system. Changes in internal office space layouts has result-
ed in a more open format resulting in more em-
Because of Johns Creek’s existing office vacancies ployees per sq. ft. and an increase in parking space
and office turnover rate, SPG recommended target- ratios if the office is not linked to transit or walk/
ed industries are primarily those businesses that oc- live neighborhoods. The second change, attributed
cupy office space. to the millennial generation, is the desire to work
near transit stations, creating a live/work/shop en-
Based on these factors, SPG recommends the follow- vironment. Thirdly, office buildings which were de-
ing: signed to be located in landscaped campus environ-
ments now desire high visibility and quick access.
• High Technology Industries
• Information Technology Johns Creek Economic Recruitment
• Software SPG recommends four levels or platforms to in-
• Financial Services crease employment opportunities within the city.
• Medical Technology First, what are primary targeted business sectors
• Professional Services that are prime users of office space? Second, JCA
should continue to work with existing businesses as
Figure 40: Johns Creek Target Industries. well as commercial real estate brokers to retain ex-
isting businesses and attract regional business not
identified as “targets” but nonetheless are suited
to fill vacancies as they become available. Third,
work with at least two of your existing internation-
al companies (or their parent companies) to bring
more of their business portfolio to the city and/or
to identify linked businesses (forward and backward
linked businesses) that might want to relocate due
to their working relationships with those primary
Source: Strategic Planning Group, Inc., 2015. firms. Fourth, strengthen the city’s retail network.
Office Users PRIMARY TARGET BUSINESSES/FIRST TIER
Employment in major office using sectors include: SPG analyzed primary office users and screened pro-
financial services, information and professional and spective business sectors (NAICS) as to growth po-
business services. Recently, one of the more import- tential (national and within the State of Georgia), the
ant developments for office markets across the U.S. degree of existing sectors currently located in the
Strategic Planning Group, Inc. 25Economic Development Issues.
SEDP: 2016-2021 Which Direction Should We Go?
city, and typical size of the business establishments. 2012 NAICS: 5231/5239 - Securities and commod-
To a large degree, most of the target industries ity contracts intermediation and brokerage/other
can be classified as falling within the North Amer- financial investment activities.
ican Industry Classification System with the ex- This sector is footloose, meaning that it has the
ception of Software (NAICS 5112) and Finance & ability to locate anywhere within a geograph-
Insurance (NACIS 5231/5239). Most of the iden- ic area. It has experienced significant growth na-
tified recruiting sectors are (NAICS) Super sec- tionally. Within Georgia it has recovered from the
tor 54: Professional and Business Services. De- impact of the Great Recession and payrolls have
tail business profiles are found in the Appendix. shown significant growth. While most firms are
small, there are still a large number of firms in
The Atlanta market dominates the state’s overall the 10-49 employee size. Principals and profes-
economy. Because of data suppression and the fact sional staff within these firms have the income
that the 2012 Economic Census data is not available to appreciate and afford the Johns Creek market.
for Georgia, its counties, or local levels, this analysis
focuses on other Census data at the state level, which
should be representative of the Atlanta market.
2012 NAICS: 5112 - Software publishers.
This sector is one of the fastest growing nationally
as well as within Georgia. With the location of Ebix,
there is a chance to grow this sector. One caution is
that the millennials make up a large segment of this
sectors employment base and there has been a trend
for this demographic to locate in downtown mixed
use areas, promoting the work/live/play environ-
ment. Johns Creek does have a strong existing soft-
ware presence in Macys, Ebix and other local firms.
2012 NAICS: 5415 - Computer systems design and
Within Georgia, this sector has a large number of related services1.
firms that employ between 10 and 100 workers, Subsector 5415 has one (1) five dig-
which fits Johns Creek’s current inventory needs. it subsector and four (4) six digit subsectors.
This sector has experienced significant growth at the
national level. Within Georgia, it has experienced
some growth in the number of establishments while
employment has rebounded from its 2009 high.
Johns Creek currently has 157 firms within this sector.
1
Example is Macy’s.
Strategic Planning Group, Inc. 26Economic Development Issues.
SEDP: 2016-2021 Which Direction Should We Go?
2012 NAICS: 6211 - Offices of Physicians.
Subsector 6211 has one (1) five digit subsector
and two (2) six digit subsectors. Nationally, this
sector’s establishments had a 6% growth rate be-
tween 2007-2012, as well 7.6% growth in em-
ployees. Currently, Johns Creek has 65 establish-
ments within this sector. Unlike a lot of the other
four digit sectors, NAICS 5416 establishments are
larger; averaging 10.6 employees per office.
2012 NAICS: 5416 - Management, scientific, and
technical consulting services.
Subsector 5416 has three (3) five dig-
it subsectors and seven (7) six digit subsectors.
Nationally, this sector experienced a 29% employ-
ment growth between 2007 and 2012. Within
Georgia, this sector has experienced solid growth. SECOND TIER TARGETS
Johns Creek currently has 169 establishments in Johns Creek has 2,731 business establishments
the four digit sector Establishments within this within its boundaries and it is reported that the
sector are traditionally small (1-4), with a nation- Technology Park alone has over 10,000 employees.
al average of 6.6 employees per establishment. For that reason, it is critical that the city use some
of its resources to maintain occupancy at the Park,
which currently has vacant space. It is normal for
office parks to experience tenant turn over. This
second tier of target industries is focused on filling
vacancies over the study period. Its primary focus is
on professional, scientific, and technical services as
well as financial and insurance establishments, all of
which are predominately office users. For purposes
of this analysis, those establishments that are con-
sidered first tier prospects have not been duplicated.
2012 NAICS: 54 - Professional, scientific, and
technical services.
Professional Services represents the NAICS Sub-
sector: 541 professional, scientific and technical
services. It is further defined into nine subsectors:
Nationally, professional, scientific and techno-
Strategic Planning Group, Inc. 27Economic Development Issues.
SEDP: 2016-2021 Which Direction Should We Go?
logical firms were impacted by the Great Reces- 2012 NAICS: 5411 - Legal services.
sion but had rebounded by the time of the 2012 At the national level, legal services are going
Economic Census. While the number of busi- through a transition as a result of changes in tech-
nesses had a negligible increase, revenue and nology, which has reduced the number of support
other indicators demonstrated strong growth. staff in most firms. Today, firms require less space
and are looking to both downsize and reduce oc-
cupancy costs, which could favor Johns Creek.
Johns Creek has 27 firms that fall within this sector.
Overall, Legal Services has recovered from the Great
Recession and the number of employees and payroll
has rebounded. This sector is dominated by small
firms (1-4 employees). The number of employee es-
tablishments in Georgia (and nationally) is larger than
employer establishments. Most non-employers are
self-employed individuals operating unincorporated
businesses (known as sole proprietorships), which
may or may not be the owner’s principal source
of income. While larger firms will seek locations in
downtown Atlanta or along the Perimeter Beltway
for visibility and access, smaller firms are more foot-
Professional/Business Services loose and affected by individual business and part-
For the purpose of this study, SPG focused ner location desires and wishes can be impacted by
on the following Professional Service sectors: quality of life issues including proximity to home.
This NAICS subsector represents a major portion of
Johns Creek businesses. While it is important to con-
tinually recruit within this Sector, only two (2) four
digit NAICS sectors are recommended for targeting.
Business Services
NAICS 5411
NAICS 5412 2012 NAICS: 5412 - Accounting, tax preparation,
NAICS 5413 bookkeeping, and payroll services.
At the national level, this sector has shown a 3%
Research & Technical Consulting growth in the number of establishments and a 5.2%
NAICS 5417 growth in employment according to the 2012 Eco-
nomic Census. At the state level however, this sector
was significantly impacted by the Great Recession
and is just now rebounding. Johns Creek currently has
33 businesses that fall within this sector. Like Sector
Strategic Planning Group, Inc. 28Economic Development Issues.
SEDP: 2016-2021 Which Direction Should We Go?
5411, these establishments are footloose and payroll 2012 NAICS: 5417 - Scientific research and develop-
within Georgia average about $55,000. While most ment services.
firms are small (1-4 employees), there are a large Nationally, this sector grew by 5 percent from 2007
number of establishments in the 5-19 employee size. to 2012 according to the U.S. Economic Census.
During that time, employment fell by 11 percent in-
dicating more efficiency and technology utilization.
Within Georgia, this sector is growing and employ-
ment is leveling off. Average payroll is approximately
$70,000. Johns Creek has three (3) firms in this sector.
2012 NAICS: 5413 - Architectural, engineering, and
related services.
This sector was decimated by the Great Recession and
is just now rebounding. Within Georgia, employment
is increasing and the average payroll is $68,000. The
sector is footloose, educated and employees have
incomes that could support living in Johns Creek.
The city currently has 26 firms within this sector.
Third Tier Targets
Johns Creek has the good fortune to have several na-
tional and international firms located within the city.
Novartis International
Novartis International AG, is a large Swiss con-
glomerate consisting of seven major companies.
In addition to Alcon, Norvartis owns Novartis An-
imal Health, Novartis Diagnostics, Novartis On-
cology, Novartis Vaccines and Sandoz. As owner
of Alcon, the corporation has a large investment
in Johns Creek. When Alcon moved its headquar-
ters to Dallas/Fort Worth, it left +/- 80,000 sq. ft.
of vacant space within its old headquarter build-
ing, which Novartis is actively working to fill.
Strategic Planning Group, Inc. 29You can also read