Kid ASA Interim report Q2 2021 - Cision
←
→
Page content transcription
If your browser does not render page correctly, please read the page content below

Kid ASA Interim report Q2 2021

Interim Report Q2 2021
                                                                               Kid ASA

Dear Shareholders
Q2 was yet another successful quarter for the Kid Group. On top of last year’s extraordinary Q2
revenue growth of 23%, we achieved positive growth figures also in Q2 2021 – despite 32% of our
Norwegian and all five Estonian stores closed during April and continued reduced footfall in
Sweden and Finland due to governmental restrictions. Combined with higher gross margin and
strong cost control we have delivered yet another quarter with high profitability.

These are the key takeaways from the second quarter:

    •   Online sales continue to grow significantly and accounted for 11.3% of total revenues. We
        remain confident that our ongoing investment in a new online platform for
        the group will substantiate further growth both online and in physical
        stores. We expect the new platform to go live in all markets before the
        Christmas season.

    •   We continue to expand our product categories as well as introducing new
        assortment. Outdoor furniture was successfully launched in Kid Interior in
        2020, and further expanded in 2021. During Q2, revenues from furniture
        almost doubled compared to Q2 last year, reaching MNOK 17. Based on
        successful pilot testing in Sweden this year, we intend to launch this
        category in Hemtex in 2022.

    •   As a step towards a more integrated and common market approach, the
        marketing function for Kid Interior and Hemtex was reorganised and
        centralised. Campaign planning and marketing material is now produced
        centrally and thereafter adapted to local markets. As a result, we expect
        cost synergies, reduced time to market and sharing of best practices from
        both segments going forward.

    •   As part of the continued integration process in Hemtex, we have
        refurbished the kitchen department in physical stores based on the Kid
        Interior concept. Previously, similar department facelifts have proved successful by
        improving the merchandising of the assortment and improving customer experience, thus
        driving sales growth. Our refurbishing and physical store expansion program is progressing
        according to plan and in line with our financial targets.

    •   Gross margin improved in Q2 due to joint sourcing for Kid and Hemtex. However, we
        remain alerted towards the unstable, global ocean freight situation with increased spot
        rates and delays, as well as increased cost of raw materials. We constantly monitor the
        situation and are prepared to take immediate action to offset the impact of potential
        delays and price increases.

I remain impressed by the organization and its willingness and ability to adapt. I am proud of how
successful we have been to introduce products to inspire our customers. Looking ahead, we will
keep up the good work and we are well prepared for the autumn.

Yours sincerely,

                                                  2
Second quarter in brief
                                                                                                                                                               Interim Report Q2 2021
✓   Group revenues increased by 3.9% and like-for-like growth increased by 2.9% despite reduced footfall following governmental Covid-19
    restrictions. Online sales growth of 23.2% and 5.7% in Kid Interior and Hemtex, respectively.
                                                                                                                                                                             Kid ASA
✓   Gross margin increased by 1.8 percentage points to 63.7%, driven by the effect of last year’s price adjustments, less rebating due to
    strong demand, improved purchasing terms because of joint sourcing with Hemtex and favourable changes in product mix

✓   OPEX-to-sales was 48.8% (46.0%) and was 49.4% (49.6%) when adding back Covid-19 related cost reduction effects

✓   Adjusted EBITDA excluding IFRS16 effects decreased by MNOK 2.4 to MNOK 102.2 (MNOK 104.6)

✓   LTM gearing ratio excluding IFRS16 effects was 1.0 (1.1) at the end of the quarter

                  LFL growth (%), Group                                          Revenue, MNOK                                           EBITDA, MNOK                                  No. of physical stores
                                                                                                                                                                                                   (period end)

                                                                                                             1097                                                                                        279 273                278
                                                                                                                                                                                 275 277          275
                                                                                                                                                                                  12        12    12      12      12            12

                          23,6 %
                                                                                                                                                                        108
                                                                                                              403
                                                                                                  729                                                                             120       117   120       118   118           119
                                            16,6 %                               661 676
                                                                       570
                                                               508                                259
                                                                                 249        258                                                              64
                                                                           244                                                               61         54
                  9,3 %                                        22 1                                                                                                     262
                                                      7,4 %                                                  694
                                                                                                                                        43                                       143 148 143 149 143                            147
                                                                                 411    418 470                                                     119
                                                                                                                                                             150
                                    2,9 %                      287 326                                                        26             116
          0,9 %                                                                                                                         70
                                                                                                                              42
                                                                                                         -           -                                                                                                      -             -
          2020 2021 2020 2021 2020 2021 2020 2021              2020 2021 2020 2021 2020 2021 2020 2021                       2020 2021 2020 2021 2020 2021 2020 2021             2020 2021 2020 2021 2020 2021 2020 2021
              Q1               Q2                Q3       Q4          Q1               Q2           Q3          Q4                 Q1              Q2             Q3        Q4         Q1              Q2              Q3            Q4

                                                                                 Kid Interior       Hemtex                                   Kid Interior          Hemtex         Kid Interior         Hemtex      Hemtex (franchise)

                                                                                                                         3
Interim Report Q2 2021
                                                                                     Kid ASA

Alternative Performance Measures
(Amounts in NOK million)                        Q2 2021      Q2 2020      H1 2021    H1 2020    FY 2020
Revenue                                             676,3     660,5       1 246,1    1 168,5    2 994,7
Like-for-like growth including online sales ¹       2,9 %     23,6 %        3,7 %     12,1 %     14,8 %
COGS                                             -245,5       -251,8      -467,6      -454,5    -1 128,7
Gross profit                                        430,8     408,7        778,5       714,0    1 866,0
Gross margin (%)                                 63,7%        61,9%        62,5%      61,1%      62,3%

Other operating income                                1,4        0,0          2,7        0,4         1,7

Employee benefits expense                        -149,4       -140,2      -289,4      -281,9     -607,1
Other operating expense                          -180,6       -164,0       -350,3     -336,8     -726,6
Other operating expense - IFRS 16 effect             70,4       71,4       143,6      143,8       289,7
OPEX                                             -259,7       -232,7      -496,0      -474,9    -1 044,1
Integration costs                                     0,0        0,0          0,0        1,2         1,2
Opex excluding integration costs                 -259,7       -232,7      -496,0      -473,7    -1 042,9

Adj. EBITDA                                         172,5      176,0       285,3      240,7       824,8
Adj. EBITDA margin (%)                           25,5%        26,6%        22,8%      20,6%      27,5%

Depreciation                                         -17,3      -15,7       -34,3      -30,6      -63,8
Depreciation - IFRS 16 effect                       -65,7      -70,1       -131,8     -138,7      -277,1
Adj. EBIT                                            89,6       90,2        119,2       71,3      483,9
Adj. EBIT margin (%)                                13,2%      13,7%        9,5%       6,1%       16,2%

Net financial income (expense)                        -2,3      -4,5        -19,6       10,1         2,2
Net financial expense - IFRS 16 effect               -6,7       -7,4        -13,8      -15,0       -30,7
Adj. Profit before tax                               80,5       78,3         85,8      66,4       455,5

Adj. Net income                                      63,8       62,0         67,5       52,6      357,0
Adjusted earnings per share                          1,57       1,53         1,66       1,29       8,78

Liabilities to financial institutions            -643,7       -618,9       -643,7     -618,9      -521,8
Lease liabilities - IFRS 16 effect               -735,0       -785,6       -735,0     -785,6     -819,2
Cash                                                 60,7      176,8         60,7     176,8       301,3
Net interest bearing debt                       -1 318,0     -1 227,7     -1 318,0   -1 227,7   -1 039,7

¹ Calculated in constant currency

                                                4
Interim Report Q2 2021
                                                                                          Kid ASA

Financial review for the Kid Group
Q2 2021 was yet another strong quarter for the Kid          Gross margin:
Group both in terms of revenue and profitability.

The Covid-19 cost reduction effect in the quarter is
estimated to MNOK 4.2 (MNOK 23.5) of which the
main part occurred in the beginning of the quarter.

Revenues

Group revenues increased by 3.9% (22.7%) to MNOK
676.3 (MNOK 651.6) based on a constant currency
calculation, and by 2.5% when applying actual
currency (MNOK 660.5). Group revenues on a like-
for-like basis were up by 2.9% (23.6%).
                                                            Employee benefits expenses increased by
Revenues increased in both segments despite
                                                            MNOK 9.2 to MNOK 149.4. The increase was mainly
closed stores in Norway in April and Covid-19
                                                            due to lower Covid-19 cost reduction effects, which
restrictions in Sweden, Finland and Estonia.
                                                            were partly offset by a reduction in bonus
Increased online shopping and compensating sales
                                                            provisions.
initiatives utilizing the omni channel platform
played an important role in driving growth.                 Other operating expenses excluding IFRS16
                                                            increased by MNOK 17.6 to MNOK 110.2. Kid Interior
                                                            had an increase in OPEX due to IT consultant costs
Q2 2020 vs Q2 2021 revenue bridge, MNOK                     as well as increase in online activity resulting in
                                                            higher distribution costs. Hemtex had an increase in
                                                            OPEX due to a combination of higher third-party
                                                            logistic costs, higher online distribution costs and
                                                            less Covid-19 rental rebates.

                                                            OPEX to sales margin was 48.8% (46.0%). When
                                                            adding back Covid-19 related costs reduction effects
                                                            OPEX to sales margin was 49.4% (49.6%).

                                                            Further details on employee benefits and operating
                                                            expenses can be found in the segment sections
Gross margin was 63.7%, up 1.8 percentage points
                                                            below.
compared to Q2 2020.

The increase in gross margin is mainly a                    Adjusted EBITDA decreased by MNOK 3.5 from
consequence of an increased effect of the joint             MNOK 176.0 to MNOK 172.5 mainly due to less
sourcing for Kid and Hemtex resulting in improved           Covid-19 cost reduction effects in Q2 2021 compared
purchasing terms with suppliers and the effect of           to Q2 2020.
last year’s price adjustments, but also less rebating
following strong demand and favourable changes in
product mix.

                                                        5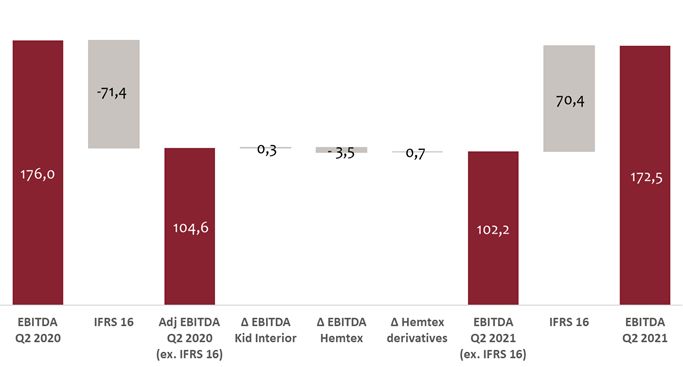
Interim Report Q2 2021
                                                                                           Kid ASA

                                                         For Adjusted EBITDA, Adjusted EBIT and Adjusted
                                                         Net income, a complete overview of adjustments is
Adjusted EBITDA:                                         provided in the following table:

                                                         Adjustments overview                Q2      Q2     H1     H1     FY
                                                         (MNOK)                             2021   2020   2021   2020   2020
                                                         Integration cost related to
                                                                                                                  1,2    1,2
                                                         Hemtex acquisition
                                                         EBITDA, EBIT and profit
                                                                                                                  1,2    1,2
                                                         adjustments before tax

                                                         Tax effects on adjustments (22%)                        -0,3   -0,3

                                                         Net income adjustments                                   0,9    0,9

                                                         Liquidity and borrowings

                                                         During Q2, Kid ASA paid MNOK 178.8 in dividend,
                                                         and MNOK 130 of the revolving credit facility was
EBITDA exclusive of IFRS16 effects decreased by          drawn. Furthermore, the renegotiated agreement
MNOK 2.4 to MNOK 102.2 from MNOK 104.6 last              with Nordea has become effective. Please refer to
year. Gross margins increased and cost control was       note 6 in the Financial Statements for further
strong, but this was offset by less Covid-19 cost        details.
reduction effects.
                                                         Excluding IFRS16 effects, net interest-bearing debt
                                                         was MNOK 582.9 (MNOK 442.1) at the end of the
                                                         quarter, corresponding to 1.0x (1.1x) of the LTM
                                                         EBITDA excluding IFRS16 effects.

                                                         The Group had cash and available credit facilities of
                                                         MNOK 407.7 (MNOK 503.8) as of 30 June 2021. The
                                                         Group has a satisfactorily liquidity position.

                                                         Capital Expenditures during Q2 amounted to MNOK
                                                         24.7 (MNOK 16.8) of which investment in the new e-
                                                         commerce platform accounted for MNOK 3.9 and
                                                         the remaining MNOK 20.8 mainly reflects store
Net financial expense of MNOK 2.3 relates to net
                                                         openings and refurbishments.
interest expenses of MNOK 4.3, other financial
expenses of MNOK 1.5 and net unrealized foreign
exchange gain of MNOK -3.7.

                                                     6
Interim Report Q2 2021
Kid ASA
Segments: Key figures
KID Interior
(Amounts in NOK millions) Q2 2021 Q2 2020 H1 2021 H1 2020 FY 2020
Revenue 418,4 411,5 744,5 698,6 1 862,8
Revenue growth 1,7 % 28,0 % 6,6 % 12,8 % 16,0 %
LFL growth including online sales -0,9% 27,1 % 3,7 % 12,1 % 14,8 %
COGS -152,9 -157,9 -279,7 -275,6 -703,1
Gross profit 265,5 253,5 464,7 423,0 1 159,7
Gross margin (%) 63,5 % 61,6 % 62,4 % 60,6 % 62,3 %
Other operating revenue -0,0 0,5 0,1 0,2
Employee benefits expense -86,1 -86,4 -166,9 -167,0 -374,1
Other operating expense -100,2 -88,2 -189,5 -173,6 -366,4
Other operating expense - IFRS 16 effect 39,3 37,1 79,7 75,8 150,9
EBITDA 118,5 115,9 188,4 158,3 570,4
EBITDA margin (%) 28,3 % 28,2 % 25,3 % 22,7 % 30,6 %
No. of shopping days 71 72 148 149 308
No. of physical stores at period end 149 143 149 143 147
Hemtex
(Amounts in NOK millions) Q2 2021 Q2 2020 H1 2021 H1 2020 FY 2020 ¹
Revenue 257,9 249,0 501,7 469,9 1 131,8
Revenue growth ² 7,7 % 14,7 % 7,1 % 10,7 % 1,1 %
LFL growth including online sales ² 9,8 % 18,0 % 8,8 % 13,0 % 6,7 %
COGS -92,7 -93,2 -187,9 -174,1 -420,7
Gross profit 165,2 155,9 313,8 295,8 711,1
Gross margin (%) 64,1 % 62,6 % 62,6 % 62,9 % 62,8 %
Other operating revenue 1,5 0,0 2,3 0,3 1,4
Employee benefits expense -63,3 -53,7 -122,5 -114,1 -232,1
Other operating expense -80,4 -75,8 -160,8 -162,8 -359,9
Other operating expense - IFRS 16 effect 31,1 34,3 64,0 68,0 138,7
EBITDA 54,0 60,8 96,8 87,2 259,2
EBITDA margin (%) 20,8 % 24,4 % 19,2 % 18,5 % 22,9 %
No. of shopping days 90 90 90 90 91
No. of physical stores at period end (excl. franchise) 118 120 118 120 119
¹ For reason of comparison, Q2 2020 have been restated with Segment Allocated Costs. Refer Note 5 for further details.
² Calculated in local currency
7Interim Report Q2 2021
Kid ASA
Segment: Kid Interior
Revenues in Kid Interior increased by 1.7% to MNOK Other operating expenses excluding IFRS16
418.4. Like-for-like revenues including online sales increased by 13,5% to MNOK 100.2:
were down by -0.9%. • +2.7 percentage points related to rental
cost for like-for-like stores partly due to less
Footfall and revenues decreased in April following
Covid-19 rebates this quarter
temporarily closed stores due to governmental
Covid-19 restrictions, which was compensated by • +1.2 percentage points related to rental
growth in May and June. cost for new stores
• +1.0 percentage points related to increase
Revenues from furniture, which was introduced as
in marketing costs due to timing of
a new category last year, doubled to MNOK 17. campaigns
New sales initiatives utilizing the omni channel • +8.6 percentage points related to an
platform has proven important as a supplement to increase in other OPEX mainly related to
our physical stores. Online growth was of 23.2% with increased use of temporarily IT consultants
online revenues reaching MNOK 38.3 in the quarter. as well as an increase in online activity
resulting in higher distribution costs and
Gross profit increased by MNOK 12.0 compared to higher use of external storage resources to
last year and gross margin increased by 1.9 meet Covid-19 restrictions
percentage points due to the effect of last year’s Covid-19 cost effect during Q2 has been estimated
price adjustments, less rebating due to strong at MNOK 3.7 (MNOK 12.0) of which reduced
demand, improved purchasing terms because of employee expenses accounted for MNOK 1.9
joint sourcing with Hemtex and favourable changes (MNOK 9.0).
in product mix.
EBITDA excluding IFRS16 increased by MNOK 0.4 to
Employee expenses decreased by -0.4% to MNOK
MNOK 79.2 (MNOK 78.8) mainly caused by
86.1:
increased gross margin and less Covid-19 cost
• +3.7 percentage points due to net new and reduction effects compared to Q2 2020.
relocated stores
Q2 2020 vs. Q2 2021 EBITDA bridge, MNOK
• +15.4 percentage points due to less Covid-
19 cost reduction effects in LFL stores,
partly offset by increased staffing level and
salary inflation in stores.
• -17.9 percentage points due to lower bonus
provisions for Q2. MNOK 1.6 (MNOK 8.9)
was provisioned for store bonuses and
MNOK 1.1 (MNOK 9.3) was provisioned for
other management and HQ bonuses Capital Expenditure during Q2 amounted to MNOK
• -1.6 percentage points in headquarter costs 13.8 mainly reflecting openings and refurbishments
due to increased number of employees in of stores.
Kid Interior performing services across
segments (e.g centralised purchasing, One new store was opened, one was relocated, and
marketing and IT) which have been four stores were refurbished during the second
allocated to the Hemtex segment.
quarter. There were no closed stores. The total
Year to date bonus provision amounted to MNOK number of physical stores at the end of the quarter
3.9 (MNOK 18.8) of which store bonuses was MNOK was 149 (143).
1.9 (MNOK 9.5) and other management bonuses
was MNOK 2.0 (MNOK 9.3).
8Interim Report Q2 2021
Kid ASA
Segment: Hemtex
Revenues increased by MNOK 8.9 to MNOK 257.9. • -2.5 percentage points related to retail
In local currency revenues increased by 7.7% to space and cost for net new/closed stores
MSEK 259.8. Like-for-like revenues including online (net decrease in number of stores)
sales were up by 9.8%. • +5.0 percentage points related to retail
space and cost for LFL stores, partly due to
Except for the five stores in Estonia, opened May 3,
less Covid-19 saving this year
all stores have been opened during the quarter, but
with fluctuating footfall following various Covid-19 • +1.1 percentage points related to marketing
costs due to changes to timing of
governmental restrictions. Online growth increased
campaigns
by 5.7% and online revenues were MNOK 36.5 in the
quarter. The Business-to-Business revenues of • +6.6 percentage points related to
Hemtex24H decreased by MNOK 0.3 to MNOK 7.0 increased third party logistics costs as well
as higher online distribution costs
(MNOK 7.3).
• -0.6 percentage points related to other
The joint Kid assortment is continuously being OPEX
introduced in Hemtex and was an important driver
of growth in Q2. During the quarter, Kid and Hemtex • -3.4 percentage points due to changes in
NOKSEK exchange rate
started to use joint marketing material in various
channels driving synergies in production and a
Covid-19 cost reduction effect during Q2 has been
similar concept profile.
estimated at MNOK 0.5 (MNOK 11.5) of which
reduced employee expenses accounted for MNOK
Gross profit increased by MNOK 9.3 and gross
0.3 (MNOK 6.4).
margin increased by 1.5 percentage points due to
joint sourcing with Kid Interior and favourable EBITDA excluding IFRS16 decreased by MNOK 3.4
changes to product mix. to MNOK 23 (MNOK 26.4) caused by increased
gross margin offset by less Covid-19 cost reductions.
Employee expenses increased by 17.9% to
Q2 2020 vs. Q2 2021 EBITDA bridge, MNOK
MNOK 63.3:
• -1.1 percentage points due to net new and
closed stores
• +18.4 percentage points in like-for-like
stores mainly due to less Covid-19 effects
this quarter
• +3.9 percentage points due to more Group
services provided by HQ in Norway, partly
offset by lower bonus provisions. Bonus
Capital Expenditure during Q2 amounted to
provision in Q2 2021 was MNOK 0 (MNOK
MNOK 10.9 and include opening and refurbishment
1.1) related to management incentives
of stores in Q2.
• -3.3 percentage points due to changes in
NOKSEK exchange rate One new store was opened, four stores were
refurbished during the second quarter. There were
Year to date bonus provision amounted to MNOK
0.5 (MNOK 1.1) which was related to management no closed or relocated stores in the period. The total
incentives. number of physical stores (excl. 12 franchise stores)
at the end of the quarter was 118 (120).
Other operating expenses excluding IFRS16,
increased by 6.2% to MNOK 80.4:
9Interim Report Q2 2021
Kid ASA
Events after the end of the reporting
period
recent years. We are constantly monitoring the
The pandemic situation appears to be declining, but
situation and are prepared to take immediate action
with local outbreaks and certain governmental
to offset the impact of potential delays and price
restrictions still affecting our markets in different
increases.
ways. Kid Group is adapting to these restrictions on
a running basis.
There have been no other significant events after
the end of the reporting period.
Following the pandemic situation, raw material
prices and overseas freight costs have increased
and fluctuate more than what we have seen in
Lier, 20 August 2021
The board of Kid ASA
10Interim Report Q2 2021
Kid ASA
Kid ASA - Group figures Q2 2021
Financial statements
11Interim Report Q2 2021
Kid ASA
Interim consolidated statement of profit and loss
(Amounts in NOK thousand) Note Q2 2021 Q2 2020 H1 2021 H1 2020 FY 2020
Unaudited Unaudited Unaudited Unaudited Audited
Revenue 676 317 660 507 1 246 132 1 168 541 2 994 658
Other operating revenue 1 419 45 2 750 371 1 693
Total revenue 677 736 660 552 1 248 882 1 168 912 2 996 351
Cost of goods sold -245 548 -251 813 -467 590 -454 539 -1 128 690
Employee benefits expense -149 433 -140 151 -289 391 -281 894 -607 119
Depreciation and amortisation expenses 9 -82 973 -85 814 -166 020 -169 334 -340 840
Other operating expenses -110 220 -92 590 -206 646 -193 000 -436 973
Total operating expenses -588 173 -570 368 -1 129 647 -1 098 766 -2 513 622
Operating profit 89 564 90 184 119 235 70 146 482 730
Financial income 3 704 9 040 3 706 29 738 32 299
Financial expense -12 772 -20 874 -37 113 -34 646 -60 735
Net financial income (+) / expense (-) -9 068 -11 834 -33 407 -4 908 -28 435
Profit before tax 80 496 78 350 85 828 65 237 454 295
Income tax expense -16 742 -16 347 -18 293 -13 553 -98 196
Net profit (loss) for the period 63 754 62 003 67 534 51 684 356 098
Interim condensed consolidated statement of
comprehensive income *
Profit for the period 63 754 62 003 67 534 51 684 356 098
Other comprehensive income 7 980 -18 994 47 177 -23 134 -56 632
Tax on comprehensive income -1 748 4 137 -10 161 5 066 12 274
Total comprehensive income for the period 69 986 47 146 104 551 33 616 311 740
Attributable to equity holders of the parent 69 986 47 146 104 551 33 616 311 740
Basic and diluted Earnings per share (EPS): 1,57 1,53 1,66 1,27 8,76
12Interim Report Q2 2021
Kid ASA
Interim consolidated statement of financial position
(Amounts in NOK thousand) Note 30.06.2021 30.06.2020 31.12.2020
Assets Unaudited Unaudited Audited
Goodwill 9 69 684 72 024 72 280
Trademark 9 1 513 476 1 515 287 1 515 485
Other intangible assets 9 10 900 9 485 5 623
Deferred tax asset 0 24 125 15 810
Total intangible assets 1 594 060 1 620 920 1 609 197
Right of use asset 9 719 396 797 719 821 683
Fixtures and fittings, tools, office machinery and equipment 9 205 027 180 202 199 512
Total tangible assets 924 423 977 921 1 021 195
Total fixed assets 2 518 483 2 598 841 2 630 392
Inventories 554 258 474 023 482 161
Trade receivables 13 188 7 766 18 381
Other receivables 29 068 15 162 32 725
Derivatives 2 270 0 0
Totalt receivables 44 526 22 928 51 106
Cash and bank deposits 60 716 176 815 301 276
Total currents assets 659 500 673 766 834 542
Total assets 3 177 983 3 272 607 3 464 935
13Interim Report Q2 2021
Kid ASA
Interim consolidated statement of financial position
(Amounts in NOK thousand) Note 30.06.2021 30.06.2020 31.12.2020
Equity and liabilities Unaudited Unaudited Audited
Share capital 48 770 48 770 48 770
Share premium 321 050 321 050 321 050
Other paid-in-equity 64 617 64 617 64 617
Total paid-in-equity 434 440 434 437 434 437
Other equity 676 194 707 837 750 164
Total equity 1 110 634 1 142 274 1 184 601
Deferred tax 316 205 318 112 315 336
Total provisions 316 205 318 112 315 336
Lease liabilities 491 056 560 721 585 131
Liabilities to financial institutions 6 601 700 510 553 461 480
Total long-term liabilities 1 092 756 1 071 274 1 046 612
Lease liabilities 243 937 224 900 234 113
Liabilities to financial institutions 6 41 993 108 333 60 297
Trade payable 56 608 74 163 92 316
Tax payable 46 172 43 553 87 011
Public duties payable 101 962 90 850 167 402
Other short-term liabilities 141 248 149 609 198 883
Derivatives 26 468 49 538 78 364
Total short-term liabilities 658 388 740 946 918 385
Total liabilities 2 067 349 2 130 332 2 280 333
Total equity and liabilities 3 177 983 3 272 607 3 464 934
14Interim Report Q2 2021
Kid ASA
Interim consolidated statement of changes in equity
(Amounts in NOK thousand) Total paid-in equity Other equity Total equity
Balance at 1 Jan 2020 434 440 715 721 1 150 161
PPA adjustment 7 171 7 171
Adjusted Balance at 1 Jan 2020 ¹ 434 440 722 892 1 157 332
Profit for the period YTD 2020 0 51 684 51 684
Other comprehensive income / Cash Flow Hedges 0 -17 969 -17 969
Dividend 0 -48 774 -48 774
Balance at 30 Jun 2020 434 440 707 833 1 142 273
Balance at 1 Jan 2021 434 440 750 164 1 184 601
Profit for the period YTD 2021 0 67 535 67 535
Other comprehensive income / Cash Flow Hedges 0 37 017 37 017
Translation differences 0 317 317
Dividend 0 -178 839 -178 839
Balance at 30 Jun 2021 434 440 676 194 1 110 634
¹ PPA adjustment of deferred tax in Q1 2020.
15Interim Report Q2 2021
Kid ASA
Interim consolidated statement of cash flows
(Amounts in NOK thousand) Note Q2 2021 Q2 2020 H1 2021 H1 2020 FY 2020
Unaudited Unaudited Unaudited Unaudited Audited
Cash Flow from operation
Profit before income taxes 80 496 78 350 85 828 65 237 454 295
Taxes paid in the period -25 000 0 -58 128 -22 103 -50 103
Depreciation & Impairment 9 82 973 85 814 166 020 169 334 340 840
Effect of exchange fluctuations -3 482 -811 8 901 -21 973 -23 147
Change in net working capital
Change in inventory -16 015 95 528 -80 354 29 474 22 777
Change in trade debtors -3 802 -1 771 4 799 16 426 8 685
Change in trade creditors -19 477 -32 449 -9 016 -79 507 -61 333
Change in other provisions ¹ 16 949 31 433 -111 239 -76 023 57 193
Net cash flow from operations 112 642 256 095 6 810 80 865 749 207
Cash flow from investment
Purchase of fixed assets 9 -23 024 -16 791 -36 620 -25 049 -65 398
Net Cash flow from investments -23 024 -16 791 -36 620 -25 049 -65 398
Cash flow from financing
Proceeds from long term loans 130 000 0 130 000 25 000 25 000
Repayment of revolving credit facility 0 -2 0 -80 002 -130 204
Repayment of Term Loans 0 0 -8 678 0 -50 152
Lease payments for principal portion of lease liability -64 817 -84 801 -132 299 -134 944 -274 956
Dividend payment -178 839 -48 774 -178 839 -48 774 -284 474
Net interest -9 943 5 445 -18 729 11 573 -10 575
Net cash flow from financing -123 599 -128 132 -208 545 -227 147 -725 360
Cash and cash equivalents at the beginning of the period 91 441 69 966 301 276 339 246 339 246
Net change in cash and cash equivalents -33 980 111 174 -238 353 -171 329 -41 545
Exchange gains / (losses) on cash and cash equivalents 3 256 -4 325 -2 207 8 897 3 576
Cash and cash equivalents at the end of the period 60 716 176 815 60 716 176 815 301 276
¹ Change in other provisions includes other receivables, public duties payable, short-term liabilities and accrued interest.
16Interim Report Q2 2021
Kid ASA
Note 1 Corporate information
Kid ASA and its subsidiaries` (together the "company" or the "Group") operating activities are related to the resale of home textiles in
Norway, Sweden, Finland and Estonia. The Kid Group offers a full range of home and interior products, including textiles, curtains, bed linens,
smaller furniture, accessories and other interior products. We design, source, market and sell these products through our stores as well as
through our online sales platforms.
All amounts in the interim financial statements are presented in NOK 1,000 unless otherwise stated.
Due to rounding, there may be differences in the summation columns.
Note 2 Basis of preparations
These interim financial statements for the second quarter of 2021 have been prepared in accordance with IAS 34, 'Interim financial reporting'.
The interim financial statements should be read in conjunction with the consolidated financial statements for the year ended 31 December
2020, which have been prepared in accordance with IFRS as adopted by the European Union ('IFRS').
Note 3 Accounting policies
The accounting policies applied in the preparation of the consolidated interim financial statements are consistent with those applied in the
preparation of the annual IFRS financial statements for the year ended 31 December 2020.
Amendments to IFRSs effective for the financial year ending 31 December 2020 are not expected to have a material impact on the group.
Note 4 Estimates, judgments and assumptions
The Preparation of interim financial statements requires management to make judgments, estimates and assumptions that affect the
application of accounting policies and the reported amounts of assets and liabilities, income and expenses. Actual results may differ from
these estimates.
In preparing these interim financial statements the significant judgements made by management in applying the Group's accounting
policies and the key sources of estimation uncertainty were the same as those applied to the consolidated financial statements for the year
ended 31 December 2020.
Note 5 Segment information
Kid Group reports segments in accordance with how the chief operating decision maker makes, follows up and evaluates its decisions.
Within the Group, Kid Interior relates to Norway and Hemtex relates to Sweden with a few stores in Estonia and Finland.
The Group also sells home textiles through the Group's online websites. Over 98% of the products are sold under own brands.
Q2 2021
(Amounts in NOK thousand) KID Interior Hemtex Total
Revenue 418 373 257 944 676 317
COGS -152 851 -92 697 -245 548
Gross profit 265 522 165 248 430 770
Other operating revenue -41 1 460 1 419
Operating expense (OPEX) -146 976 -112 676 -259 652
EBITDA 118 505 54 032 172 536
Operating profit 71 829 17 735 89 564
Gross margin (%) 63,5 % 64,1 % 63,7 %
OPEX to sales margin (%) 35,1 % 43,7 % 38,4 %
EBITDA margin (%) 28,3 % 20,8 % 25,5 %
Inventory 321 000 233 258 554 258
Total assets 2 423 044 754 936 3 177 980
17Interim Report Q2 2021
Kid ASA
Certain group costs have been booked in Kid Interior and in the parent company Kid ASA and are allocated to the respective segments based
on common accepted methodology. For 2020 the cost allocation was performed in Q4 for the entire year but starting 2021 performed on a
quarterly basis. Hence, for reason of comparison, Q2 2020 figures have been restated. Please refer below table for details.
Segment allocated costs
Total year Total year
(MNOK) Q1 2021 Q1 2020 Q2 2021 Q2 2020 Q3 2021 Q3 2020 Q4 2021 Q4 2020 2021 2020
Kid ASA and Kid Interior
Segment allocated employee
0,8 2,3 5,2 2,4 3,2 2,1 5,9 10,0
benefits expense
Segment allocated other operating
1,7 0,1 1,0 0,3 0,3 1,0 2,7 1,7
expense
Hemtex
Segment allocated employee
-0,8 -2,3 -5,2 -2,4 -3,2 -2,1 -5,9 -10,0
benefits expense
Segment allocated other operating
-1,7 -0,1 -1,0 -0,3 -0,3 -1,0 -2,7 -1,7
expense
Note 6 Loans and borrowings
Financing agreements
In April 2021, Kid ASA entered into a renewed agreement with Nordea securing a term loan structure of NOK 611.7 million.
In addition, the group also renewed the existing revolving credit facility, overdraft agreement and the NOK 115 million L/C- and guarantee
facility. During the quarter, the revolving credit facility was drawn in full.
At the balance sheet date, the Group has the following borrowing facilities:
Utilised Total
(Amounts in NOK thousand) 30.06.2021 Facility Interest Maturity Repayment
Total term loan 511 700 611 700¹ 5 years Instalments ²
Of which:
Denominated in NOK 3
395 000 495 000 Fixed rate at 1,876% + 1.25%
Denominated in SEK 4
115 000 115 000 Fixed rate at 1,460% + 1.25%
Revolving credit facility 130 000 130 000 3 months Nibor + 1.10% 3 years At maturity
Overdraft - 247 000 1 week IBOR + 1.10% 12 months At maturity
641 700 988 700
¹Of which 100 can be drawn at Kid’s discretion within two years and with a maximum of two tranches
² NOK 30M in annual instalments with bi-annual payments. First instalment is due in November 2021 for the full yearly payment.
3
Fixed interest rate is secured through an interest rate swap of MNOK 395 maturing May 2029 and subject to hedge accounting
4
Fixed interest rate and denomination in SEK is hedged through a cross currency interest swap of MNOK 115 maturing November 2024
The effect of the change in fair value of the cross currency interest swap is booked against foreign exchange gains/losses in Statement
of profit and loss
Loan covenants
The new loan agreement also made changes to the loan covenants:
(a) the gearing ratio (NIBD/EBITDA) must now be below 2,25 at year end (reduced from 2,5) in accordance with previous agreement
(b) the EBITDA last twelve months at each quarter must exceed 175 MNOK (increased from 150 MNOK), and
(c) CAPEX Year to date was removed
Assets pledged as security
Assets pledged as security for the facilities are the shares in Kid Interior AS and Hemtex AB, NOK 1,200,000 thousand of inventory,
accounts receivables and operating equipment in Kid Interior AS and SEK 300,000 thousand of assets in Hemtex AB.
18Interim Report Q2 2021
Kid ASA
Note 7 Earnings per share
Q2 2021 Q2 2020 H1 2021 H1 2020 FY 2020
Weighted number of ordinary shares 40 645 162 40 645 162 40 645 162 40 645 162 40 645 162
Net profit or loss for the year 63 754 62 003 67 534 51 684 356 098
Earnings per share (basic and diluted) (Expressed in NOK per share) 1,57 1,53 1,66 1,27 8,76
Note 8 Related party transactions
The Group's related parties include its associates, key management, members of the board and majority shareholders.
None of the Board members have been granted loans or guarantees in the current year. Furthermore, none of the Board members are
included in the Group's pension or bonus plans.
The following table provides the total amount of transactions that have been entered into with related parties during the first half of 2021
and 2020:
Related Party Transactions H1 2021 H1 2020
Vågsgaten Handel AS with subsidiaries (Store rental) 559 554
Management for Hire 0 375
Total 559 929
Note 9 Fixed assets and intangible assets
Right of use
(amounts in NOK thousand) Asset PPE Trademark Other Intangibles Goodwill
Balance 01.01.2021 821 683 199 513 1 515 484 5 622 72 281
Exchange differences -9 460 -1 247 -2 008 -147 -2 597
Additions, disposals and adjustments 38 942 40 315 - 6 638 -
Depreciation and amortisation -131 769 -33 554 - -1 214 -
Balance 30.06.21 719 396 205 028 1 513 476 10 900 69 684
Right of use
(amounts in NOK thousand) Asset PPE Trademark Other Intangibles Goodwill
Balance 01.01.2020 822 604 179 233 1 510 165 10 085 65 402
Exchange differences 22 819 4 732 5 122 665 6 622
Additions, disposals and adjustments 93 126 24 470 - 856 -
Depreciation and amortisation -140 830 -28 234 - -2 120 -
Balance 30.06.2020 797 719 180 202 1 515 287 9 485 72 024
19Interim Report Q2 2021
Kid ASA
RESPONSIBILITY STATEMENT KID ASA
We confirm, to the best of our knowledge, that the financial statements for the period 1 January to 30
June 2021 have been prepared in accordance with current applicable accounting standards, and give a
true and fair view of the assets, liabilities, financial position and profit or loss of the entity and the
group taken as a whole. We also confirm that the Board of Directors’ Report includes a true and fair
review of the development and performance of the business and the position of the entity and the
group, together with a description of the principal risks and uncertainties facing the entity and the
group.
Lier, 20 August 2021
The board of Kid ASA
20Interim Report Q2 2021
Kid ASA
Definitions
• Like-for-like revenue are revenue from stores that were in operation from the start of last fiscal year all through the end
of the current reporting period.
• Revenue growth represents the growth in revenue for the current reporting period compared to the comparative period
the previous year. Revenue growth for Hemtex is calculated in constant currency. Revenue growth is an important key
figure for the KID Group and the user of financial statements as it illustrates the underlying organic revenue growth.
• Gross profit is defined as revenue minus the cost of goods sold (COGS). The gross profit represents sales revenue that
the Group retains after incurring the direct costs associated with the purchase and distribution of the goods.
• Gross margin is defined as Gross profit divided by Revenue. The gross margin reflects the percentage margin of the sales
revenue that the Group retains after incurring the direct costs associated with the purchase and distribution of the goods
and is an important internal KPI.
• OPEX to sales margin is the sum of Employee benefits expense and Other operating expenses divided by Revenue. The
OPEX to sales margin measures operating cost efficiency as percentage of sales revenue and is an important internal KPI.
• EBITDA is earnings before tax, interests, amortisation of other intangibles and depreciation and write-down of property,
plant and equipment and right-of-use assets is an important performance measure for Kid. Adjusted EBITDA is defined
as EBITDA less items defined as other income and expenses, which includes inter alia, transaction and integration costs.
These performance measures are important key figures for Kid Group and considered useful to the users of the financial
statements when evaluating operational profitability on a more variable cost basis as they exclude amortisation and
depreciation expense related to capital expenditure, and also items not considered as a part of ordinary operations.
• EBITDA margin is EBITDA divided by Total revenue. The Adjusted EBITDA margin is Adjusted EBITDA divided by total
Revenue. These performance measures are important key figures for Kid Group and are considered useful to the users
of the financial statements when evaluating operational efficiency on a more variable cost basis as they exclude
amortisation and depreciation expense related to capital expenditure, and also items not considered as a part of ordinary
operations.
• EBIT (earnings before interest, tax) is operating profit. Adjusted EBIT is defined as EBIT less items defined as other income
and expenses, which includes inter alia, transaction and integration costs. These performance measures are considered
useful to the users of the financial statements when evaluating operational profitability, also excluding items not
considered as a part of ordinary operations.
• EBIT margin is EBIT divided by Total revenue. The Adjusted EBIT margin is Adjusted EBIT divided by total Revenue. These
performance measures are important key figures for Kid Group and are considered useful to the users of the financial
statements when evaluating operational efficiency, also excluding items not considered as a part of ordinary operations.
• Net Capital expenditure represent the cash flow from the investment spending in property, plant and equipment and
other intangibles, less sale such asset.
• Net Income is profit (loss) for the period.
• Adjusted Net Income is Net Income adjusted for items defined as other income and expenses, which includes inter alia,
transaction and integration costs adjusted for tax effects and change in deferred tax caused by change in tax rate.
• Constant currency is exchange rates that the Group uses to eliminate the effect of exchange rates fluctuations when
calculating financial performance numbers.
21Interim Report Q2 2021
Kid ASA
Disclaimer
This report includes forward-looking statements which are based on our current expectations and projections
about future events. All statements other than statements of historical facts included in this report, including
statements regarding our future financial position, risks and uncertainties related to our business, strategy,
capital expenditures, projected costs and our plans and objectives for future operations, including our plans for
future costs savings and synergies may be deemed to be forward-looking statements. Words such as “believe,”
“expect,” “anticipate,”, “may,” “assume,” “plan,” “intend,” “will,” “should,” “estimate,” “risk” and similar
expressions or the negatives of these expressions are intended to identify forward-looking statements. By their
nature, forward-looking statements involve known and unknown risks and uncertainties because they relate to
events and depend on circumstances that may or may not occur in the future. Forward-looking statements are
not guarantees of future performance. You should not place undue reliance on these forward-looking
statements. In addition, any forward-looking statements are made only as of the date of this notice, and we do
not intend and do not assume any obligation to update any statements set forth in this notice.
Kid ASA, Gilhusveien 1, 3426 Gullaug
Main office: +47 940 26 000, Customer service: +47 00 20 00
www.kid.noYou can also read