Label-free cell-based assay with spectral-domain optical coherence phase microscopy
←
→
Page content transcription
If your browser does not render page correctly, please read the page content below
Label-free cell-based assay with
                 spectral-domain optical coherence
                 phase microscopy

                 Suho Ryu
                 Kyung-A Hyun
                 Jung Heo
                 Hyo-Il Jung
                 Chulmin Joo

Downloaded From: https://www.spiedigitallibrary.org/journals/Journal-of-Biomedical-Optics on 24 Oct 2020
Terms of Use: https://www.spiedigitallibrary.org/terms-of-use
Journal of Biomedical Optics 19(4), 046003 (April 2014)

                Label-free cell-based assay with spectral-domain
                optical coherence phase microscopy
                Suho Ryu,† Kyung-A Hyun,† Jung Heo, Hyo-Il Jung, and Chulmin Joo*
                Yonsei University, School of Mechanical Engineering, Seoul 120-749, Republic of Korea

                                 Abstract. Quantitative measurement of dynamic responses of unstained living cells is of great importance in
                                 many applications ranging from investigation of fundamental cellular functions to drug discoveries. Conventional
                                 optical methods for label-free cell-based assay examine cellular structural changes proximal to sensor surfaces
                                 under external stimuli, but require dedicated nanostructure-patterned substrates for operation. Here, we present
                                 a quantitative imaging method, spectral-domain optical coherence phase microscopy (SD-OCPM), as a viable
                                 optical platform for label-free cell-based assay. The instrument is based on a low-coherence interferometric
                                 microscope that enables quantitative depth-resolved phase measurement of a transparent specimen with
                                 high phase stability. We demonstrate SD-OCPM measurement of dynamic responses of human breast cancer
                                 cells (MCF-7) to 2-picolinic acid (PA) and histamine. © 2014 Society of Photo-Optical Instrumentation Engineers (SPIE) [DOI: 10
                                 .1117/1.JBO.19.4.046003]

                                 Keywords: label-free; cell-based assay; spectral domain optical coherence phase microscopy; cell dynamics; cell biology.
                                 Paper 130859R received Dec. 3, 2013; revised manuscript received Feb. 18, 2014; accepted for publication Mar. 10, 2014; published
                                 online Apr. 7, 2014.

                1       Introduction                                                               activities, such as proliferation, apoptosis, and G-protein-
                Monitoring cellular dynamics and behaviors under diverse con-                      coupled receptor (GPCR) binding.8
                                                                                                      Despite the attractive features, operation of these techniques
                ditions is of great importance to understand fundamental cell
                                                                                                   requires dedicated substrates patterned with either metallic elec-
                functions, and facilitates the development of novel cellular
                                                                                                   trodes or nanostructures.9 These surfaces are costly to fabricate,
                drugs. Conventional cell monitoring technologies1 typically
                                                                                                   and the strategies for surface protection and functionalization
                employ secondary contrast agents such as fluorescence dyes to
                                                                                                   are also required for proper cell adhesion. Therefore, the tech-
                visualize intracellular activities. However, labeling cells with
                                                                                                   niques capable of monitoring label-free cells with commercially
                the exogenous agents involves extra time and cost, and the agents
                                                                                                   available microtiter plates would facilitate cell-based research.9
                may also perturb the intrinsic cellular functions.2 Moreover, the                     Spectral-domain optical coherence phase microscopy (SD-
                labeled cells may not be suitable for longitudinal studies over                    OCPM)10 is an optical microscopy technique capable of pro-
                long periods of time due to photobleaching and potential toxicity.3                ducing depth-resolved quantitative phase images of biological
                    Electrical impedance sensing (ECIS) has been investigated                      specimens. It is characterized by subnanometer level optical
                for label-free cell-based assay.4 ECIS measures electrical imped-                  path-length sensitivity, and demonstrated dynamic measure-
                ance changes of metallic electrodes patterned on a substrate, on                   ment of antigen-antibody interactions.11 Here, we demonstrate
                which cells adhere and interact. Upon external stimuli, the                        SD-OCPM as a viable platform for label-free cell-based assay,
                impedance changes reflect a myriad of cellular responses to                        which can operate with commercial glass-bottom microtiter
                drugs and pH/temperature dependence. Optical alternatives                          plates. We present its capability by measuring the responses
                have also been developed. Commercial optical systems employ                        of human breast cancer cells (MCF-7) to 2-picolinic acid and
                substrates patterned with resonant waveguide grating (RWG)5                        histamine.
                and photonic crystal structures6 to measure changes of refractive
                index (RI) near the cell-substrate interface within ∼200 nm. One                   2       Materials and Methods
                notable application is measuring dynamic mass redistribution
                (DMR). DMR represents relocations of intracellular structures                      2.1      SD-OCPM Principle and Experimental Setup
                due to receptor activation or deactivation.7 The main assumption
                is that the total amount of proteins is the same and spatial redis-                The operation of SD-OCPM is detailed elsewhere.10 Figure 1
                tribution of intracellular structures is induced due to the stimu-                 depicts SD-OCPM setup for label-free cell-based assay. A
                lants.7 The DMR process has been one of the main targets for                       super-continuum laser (SC-400, Fianium Inc., Southampton,
                cellular drug development, and therefore conventional label-free                   United Kingdom United Kingdom) passed through a long-pass fil-
                cell assay systems have focused on measuring the changes                           ter (Chroma Inc., Bellows Falls, Vermont, HHQ550lp) and was
                proximal to cell-substrate interface to measure local variation                    directed to the fiber interferometer. Combined use of the long-
                of RI, or the changes in accumulated intracellular mass.                           pass filter and the single-mode fiber interferometer resulted in
                These methods have been utilized to examine various cell                           the sample light centered at ∼800 nm with a full width at half
                                                                                                   maximum bandwidth of ∼200 nm. The light from the sample
                                                                                                   arm fiber was collimated with a diameter of ∼4.4 mm, and passed
                *Address all correspondence to: Chulmin Joo, E-mail: cjoo@yonsei.ac.kr
                †
                    These authors contributed equally.                                             0091-3286/2014/$25.00 © 2014 SPIE

                Journal of Biomedical Optics                                               046003-1                                           April 2014   •   Vol. 19(4)

Downloaded From: https://www.spiedigitallibrary.org/journals/Journal-of-Biomedical-Optics on 24 Oct 2020
Terms of Use: https://www.spiedigitallibrary.org/terms-of-use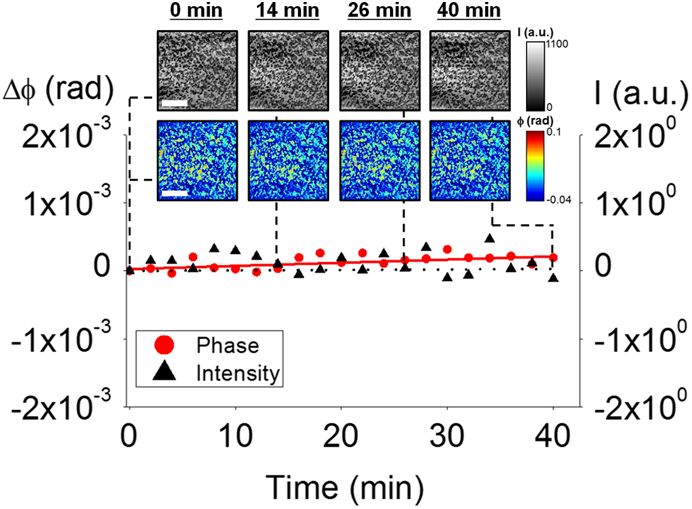
Ryu et al.: Label-free cell-based assay with spectral-domain optical coherence phase microscopy
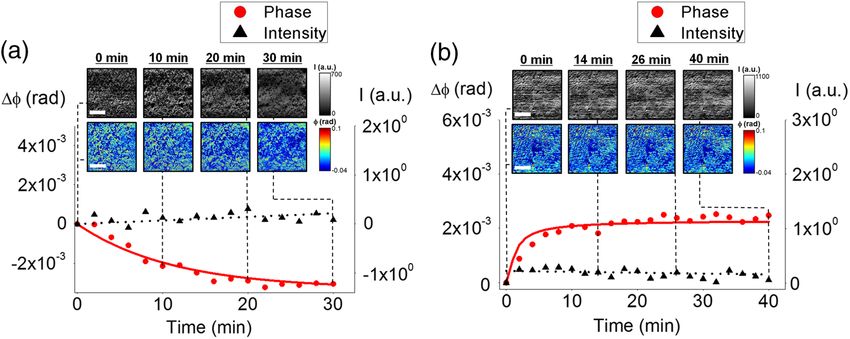
Fig. 1 (a) Experimental configuration of spectral-domain optical coherence phase microscopy (SD-
OCPM) for cell assay. Light from a super-continuum laser was directed into a 2 × 2 fiber-based coupler.
In the sample arm, the output beam was collimated, passed through a galvanometric beam scanner and
subsequently was expanded by the beam expander. The expanded beam was then focused onto the
cell-substrate interface. The reflected light was re-coupled into the fiber and detected by a spectrometer
in the detection arm. (b) The back-reflected light from reference (bottom) and sample (top) surfaces inter-
fere with each other to produce interference fringes. When the receptors on cell membrane are activated,
relocation of intracellular structures proximal to the cell-substrate interface is induced, which results in
a fringe shift in the interference spectrum (full-lined arrow to dashed arrow). Such fringe shifts can be
quantified by examining the phase of the corresponding interference signal in the path-length resolved
information.
through the two-dimensional galvanometric scanner (Thorlabs, and intracellular dynamic responses with subcellular resolution.
Inc., Newton, New Jersey GVS-002). The beam was then focused However, it would compromise the number of cells that can be
on the top surface of a glass bottom microtiter plate with a focusing measured for a given acquisition time. In terms of label-free cell
lens (Thorlabs, Inc., LSM05-BB). The light was reflected from the assay, it is more advantageous to examine large population of
interfaces along the beam path, and re-coupled back into the inter- cells under the introduction of chemicals to obtain robust and
ferometer. The interference signal was detected by a custom-built reliable cellular response. Therefore, lateral resolution was set
spectrometer at the detection arm with a maximum line rate of to be ∼20 μm. We also cultured the cells with high confluency
70 kHz. The SD-OCPM was configured as an inverted microscope (>75%) to minimize the empty regions, thereby performing more
for live cell imaging. valid measurements over the field-of-view (FoV). SD-OCPM
The interference between the reflections from the top (meas- measurement averaged over the FoV therefore represents the
urement) and bottom (reference) surfaces of a substrate produ- collective responses of multiple cells due to the stimulants.
ces an interference spectrum as depicted in Fig. 1(b). As noted The random dynamics such as cell membrane fluctuation would
by Fang et al.5 and in Schröder et al.,7 upon activation of cell be averaged out by examining multitudes of cells.
membrane receptors by external ligands, the cells undergo intra-
cellular mass redistribution which results in alteration of cell 2.2 Data Analysis
adhesion and local scattering properties inside the cell. These The measured interference spectra were transformed from wave-
changes proximal to the cell-substrate interface [red thick length to wavenumber space as described in Mujat et al.12
line on the substrate, Fig. 1(b)] lead to a fringe shift in the inter- Inverse Fourier transform of the spectrum results in path-length
ference spectrum, which is in turn translated into the phase resolved complex-valued information of a specimen. We located
change in the optical path length domain. The coherence length the interference signal between the reflections of the top and
of the light source determines the detection volume. In our setup, bottom surfaces of the microtiter glass substrate and examined
it was measured to be ∼1.4 μm in air, which is much smaller its complex-valued signal. It can be seen that our measurement
than the thickness of MCF-7. We performed confocal micros- is greatly influenced by the reflection from the top surface of
copy imaging of fluorescently labeled MCF-7s. The cells a glass substrate. The contribution of the light scattered from
were labeled with PKH26 (Mini26, Sigma-Aldrich, St. Louis, cell bottom membrane and other intracellular structures
Missouri) and were imaged by a confocal microscope would be significantly smaller compared with that from the
(63 × ∕1.2 NA, Zeiss LSM 510, Germany). The thickness of glass substrate. In order to alleviate this signal leakage problem,
MCF-7 monolayer was measured to ∼12 μm on average. The we adopted the strategy described in Ellerbee and Izatt.13 We
fluctuations from other regions inside the cells would be rejected subtracted the first image from the subsequent time-lapsed
due to a short coherence length. image sets, thereby measuring the changes due to cellular
In this study, we set the lateral resolution to be ∼20 μm to responses only. The amplitude and phase of the differential mea-
measure averaged cellular responses over the entire well, while surements were then averaged over the entire FoV and plotted to
maintaining the ability to resolve individual cells. Higher spatial examine dynamic responses. A small phase drift over time was
resolution can be readily achieved with high NA lenses, and eliminated by referencing the measured phase distribution rel-
would enable to examine heterogeneous cellular responses ative to the cell-free regions in the same image. The FoV of
Journal of Biomedical Optics 046003-2 April 2014 • Vol. 19(4)
Downloaded From: https://www.spiedigitallibrary.org/journals/Journal-of-Biomedical-Optics on 24 Oct 2020
Terms of Use: https://www.spiedigitallibrary.org/terms-of-use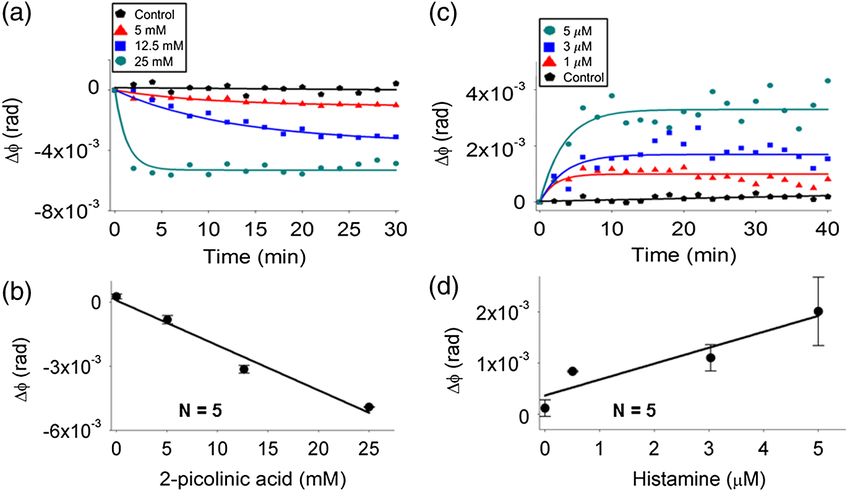
Ryu et al.: Label-free cell-based assay with spectral-domain optical coherence phase microscopy

                SD-OCPM image was 3.3 × 3.3 mm2 per well, and the image
                size was 500 × 500 pixels. The pixel rate was set to 10 kHz.
                The image acquisition was performed at every 2 min.

                2.3     Cell Preparation and Chemicals
                A breast carcinoma cell line (MCF-7) was used to assess the
                capability of SD-OCPM label-free cell-based assay. The cells
                were suspended in Roswell Park Memorial Institute medium
                (RPMI, GIBCO BRL, Gaithersburg, Maryland) at a fixed con-
                centration of 1 × 10⁵ ∕ml. The 100 μl of the sample was loaded                     Fig. 2 Measured phase and intensity fluctuations for the cell-free
                on glass bottom multiwell plates (In Vitro Scientific, Sunnyvale,                  plates. The chamber was initially filled with the incubation buffer
                California, P384-1.5H-N) and incubated for 24 h prior to                           and 5-μM histamine was injected at 1 min. The arrow indicates the
                experiment.                                                                        time for the histamine injection. No notable changes were measured
                    We employed 2-picolinic acid (PA, Sigma-Aldrich, St.                           for the intensity and phase signals.
                Louis, Missouri, P42800) and histamine (Sigma-Aldrich,
                H7125) to induce cellular changes. 2-picolinic acid (PA), a pyri-                  optical cell-based assay technologies that measure the changes
                dine compound with a carboxyl side chain, is known to interrupt                    of RI proximal to the sensor surface, SD-OCPM measures the
                cellular metabolism. It arrests the cell cycles on G1 , leading to                 changes of optical thickness near the top surface of the substrate.
                prohibition of the cell proliferation or cell death.14 On the other                Therefore, SD-OCPM is more immune to bulk RI variation, and
                hand, histamine is an organic compound that regulates cell pro-                    rather sensitive to movement of scattering structures inside the
                liferation through stimulation of histamine receptors on the cell                  probe volume.
                membrane.15 The cellular responses to histamine have been                             SD-OCPM signal fluctuations of untreated live cells were
                investigated with other sensor technologies.16                                     then measured (Fig. 3). Representative SD-OCPM images of
                    The chemicals were prepared by serially diluting 1-M stock                     the cells are also shown in Fig. 3. It can be noted that intensity
                solutions of each chemical with phosphate-buffered saline                          values in the cell-free regions are larger than those in the regions
                solution to obtain the concentrations of 5.0, 12.5, 25.0 mM                        on which the cells adhere. This can be explained by that the
                for PA, and 1, 3, 5 μM for histamine, respectively.                                magnitudes of the reflected light in the cell-free regions are
                                                                                                   greater than other areas due to the larger RI gradient. The
                2.4     Experiment Procedure                                                       phase distribution in the SD-OCPM phase image represents
                                                                                                   the optical path-length delay due to cellular structures within
                For measurement, cell-loaded multiwell plates were placed on a
                                                                                                   the detection volume relative to the cell-free regions. The mea-
                custom-built SD-OCPM specimen stage. We acquired the image
                                                                                                   sured phase and intensity fluctuations exhibited small variations
                prior to the chemical injection as a reference. The responses of
                                                                                                   of ∼427.1 μrad and ∼0.2, respectively. Random cellular dynam-
                the PA-treated and histamine-treated cells were then recorded
                                                                                                   ics such as the intrinsic membrane motion within the probe
                for 30 and 40 min, respectively, right after the introduction
                                                                                                   volume may account for this small fluctuation.
                of the chemicals. Several wells in each measurement were
                untreated as controls.
                                                                                                   3.2     Measurement of Dynamic Cellular Responses
                3     Results
                                                                                                   Having evaluated the SD-OCPM performance, MCF-7 cell
                3.1     System Stability                                                           responses to 2-picolinic acid (PA) and histamine were measured.
                                                                                                   Representative SD-OCPM signals at a PA concentration of
                Prior to measuring cellular responses to the chemicals, SD-                        12.5 mM are shown in Fig. 4(a), along with SD-OCPM intensity
                OCPM performance was first evaluated. The microtiter well                          and phase images of the MCF-7s. It can be noted that the pos-
                was filled with the incubation buffer, and the phase fluctuation                   itive phase distributions that were initially observed at 0 min
                of the interference signal between the reflections from the top
                and bottom surfaces of the glass substrate was recorded. The
                SD-OCPM beam was positioned stationary at the center of the
                FoV. The measured signal-to-noise ratio was ∼50 dB, under
                which condition the theoretical sensitivity is ∼2.2 mrad. The
                measured sensitivity in SD-OCPM was ∼3.3 mrad in air. The dif-
                ference between the theoretical and measured sensitivities may be
                due to the influence of external disturbances such as vibrations
                during the measurement.
                    We also performed SD-OCPM imaging of a cell-free sub-
                strate. A cell-free glass-bottom microtiter plate was initially
                filled with the incubation buffer, and the 5-μM histamine was
                injected at 1 min to examine the effect of bulk RI variation
                on the SD-OCPM phase measurement (indicated by an arrow
                                                                                                   Fig. 3 Measured phase and intensity fluctuations for the live MCF-7
                in Fig. 2). As can be noted in Fig. 2, the histamine introduction                  cells, along with representative SD-OCPM phase and intensity
                did not produce a notable change. The standard deviations of the                   images. Small variations in the measured signals may be due to intrin-
                phase and intensity signals averaged over the entire FoV were                      sic cell membrane fluctuation and random motion of intracellular struc-
                found to be ∼40.2 μrad and ∼0.14, respectively. Unlike other                       tures inside the probe volume. (Scale bar: 1 mm).

                Journal of Biomedical Optics                                               046003-3                                               April 2014   •   Vol. 19(4)

Downloaded From: https://www.spiedigitallibrary.org/journals/Journal-of-Biomedical-Optics on 24 Oct 2020
Terms of Use: https://www.spiedigitallibrary.org/terms-of-use
Ryu et al.: Label-free cell-based assay with spectral-domain optical coherence phase microscopy
Fig. 4 Dynamic cellular responses measured with SD-OCPM. (a) Representative intensity and phase
profiles for 12.5mM PA treated cells, along with the corresponding SD-OCPM images (Scale bar: 1 mm).
Negative signal change can be observed in the phase signal, but no significant change was detected in
the intensity measurement. (b) Representative intensity and phase measurements for 5 μM histamine
treated cells. The representative SD-OCPM images are shown in the insets (Scale bar: 1 mm). The
phase measurement presents a positive signal change in time, whereas the intensity measurement
does not show a marked signal change.
decayed in time. This delay of the SD-OCPM phase signal may were not pronounced as in the PA-treated cells, the averaged
indicate a decrease in the number of cellular structures within phase over the well increased and then became stabilized in
the detection volume. Changes in the SD-OCPM intensity sig- 10 min. The cellular responses were heterogeneous at a single-
nal, on the other hand, were not significant. It may be due to that cell level, but SD-OCPM measured increased cellular responses
changes in the intensity signal were not larger compared with averaged over the entire well. SD-OCPM intensity signal, how-
the power fluctuation of the light source. We separately per- ever did not show a marked change.
formed bright-field microscopy imaging of the cells at the It can be seen that the SD-OCPM phase signal is more sen-
same concentrations, but found no marked changes (data not sitive to small changes of cellular responses. The motion of
shown). This difference can be accounted for by that SD- intracellular structures was found to generate significant
OCPM measures the phase distribution only at the cell-substrate phase variations, and it has been used to measure viscoelastic
interface, while bright-field microscopy images are generated properties inside the cells.17 Joo and de Boer18 have also
from the light transmitted through the cells. Hence, the measured the protein absorption and desorption on the glass
bright-field microscopy would not be able to detect cell detach- substrate based on the phase variation.
ment and intracellular structural changes undergoing only at the We thus used SD-OCPM phase information to examine the
cell-substrate interface. cellular responses as a function of PA and histamine concentra-
Shown in Fig. 4(b) is SD-OCPM measurement of 5-μM his- tions (Fig. 5). The higher PA concentration produced more rapid
tamine-treated MCF-7s. Representative SD-OCPM images of and large phase changes, while the control case did not exhibit a
the cells can also be found in the insets. Although the changes marked change [Fig. 5(a)]. Figure 5(b) shows the magnitudes of
Fig. 5 (a) SD-OCPM phase measurements of 2-PA treated MCF-7s at different concentrations. (b) The
averaged SD-OCPM phase change versus 2-PA concentration. (c) SD-OCPM phase measurements of
histamine-treated MCF-7s at different concentrations. (d) The averaged SD-OCPM phase change versus
histamine concentration. Five measurements were averaged for each concentration.
Journal of Biomedical Optics 046003-4 April 2014 • Vol. 19(4)
Downloaded From: https://www.spiedigitallibrary.org/journals/Journal-of-Biomedical-Optics on 24 Oct 2020
Terms of Use: https://www.spiedigitallibrary.org/terms-of-useRyu et al.: Label-free cell-based assay with spectral-domain optical coherence phase microscopy
the phase changes averaged over five wells at each concentra- modalities would allow for simultaneous quantitative label-
tion. SD-OCPM phase changes were found to have a linear rela- free cell-based assay and direct visualization of cellular
tionship with PA concentration as −210 μrad∕mM [Fig. 5(b)]. morphologies.
Figures 5(c) and 5(d) show the representative cellular responses Its depth-resolved imaging capability based on low-
with different histamine concentrations and the phase changes coherence interferometry may also open up a new avenue for
averaged over five wells for each concentration. Large phase cellular studies. Recent investigations have shown that three-
variations were observed at the higher histamine concentration. dimensional (3-D) imaging capability and high path-length sen-
The SD-OCPM response against histamine concentration was sitivity of SD-OCPM enabled measurement of nanoscale cell
found to vary linearly as þ390 μrad∕μM [Fig. 5(d)]. movement on subsecond scale. Bagnaninchi et al.24 applied
Our results with PA and histamine treated cells agree to ear- SD-OCPM to detect 3-D micromotion of stem cells in scaffolds
lier publications. Fernandez-Pol et al.14 observed completed cell by monitoring derivatives of measured phase information.
detachment and floating after ∼48 h with the 3-mM PA treat- Holmes et al.25 have also demonstrated application of low-
ment. Cytotoxicity of PA on human skin cells has also been coherence interferometry for real-time cellular growth and
reported.19 Cell detachment and death result in a decrease in viability monitoring in 3-D tissue scaffolds. Here, we demon-
the optical thickness proximal to the substrate, which was
strated SD-OCPM as a label-free cell assay system capable
detected as the negative phase changes in SD-OCPM measure-
of measuring DMR and cell adhesion/detachment based on
ment. SD-OCPM measurements with histamine treated MCF-7s
its depth-resolved imaging ability.
are also consistent with the previous reports. For instance, Ferrie
Other quantitative phase imaging techniques have been
et al. measured the responses of human squamous carcinoma
(A431) cells to histamine with the resonant waveguide optical developed to image unstained live cells. These include digital
sensor. They found the increased mass distribution proximal to holographic microscopy,26 Hilbert phase,27 and Fourier phase
substrate interface.16 In addition, Brischwein et al.20 utilized imaging28 techniques. These techniques provide high-contrast
ECIS to measure the response of HELA cells to 25-μM hista- quantitative phase images of live cells in real-time. Yet, they
mine and observed an increased impedance signal, which was operate on the light transmitted through the sample, and so
stabilized within 10 min. cannot measure cellular changes at a specific depth. Here, our
In Figs. 4 and 5, exponential functions were used to fit the focus was on measuring DMR and cellular changes proximal to
SD-OCPM phase signals in time. Temporal responses to the cell-substrate interface, which requires depth-resolved measure-
chemicals have previously been modeled with exponential ment capability.
functions. Malleo et al.21 employed continuous differential As with other label-free interferometric techniques, SD-
impedance spectroscopy to examine HeLa cell responses to OCPM lacks of chemical specificity and specific structural
Polysorbate 20, and reported exponential behaviors in the mea- information that leads to the measured signal. Researchers
sured signal as a function of time. Fang and Ferrie22 have also have employed multimodal techniques to understand the
observed the exponential signal changes for the A431 cells upon main contributors to the scattering signals inside the cells,
the introduction of various types of chemicals with RWG sen- and found that highly scattering structures such as mitochondria,
sors. Our measurements with the PA and histamine exhibited cytoskeletons, and other subcellular structures are the main con-
similar behaviors. For the dependence of cellular responses tributors in coherent imaging techniques.29 Dynamic motion of
on the histamine concentrations, we found the linear depend- intracellular structures inside the probe volume could lead to
ence of the cellular responses on the concentration ranges of the measurable intensity and phase signals in SD-OCPM.
1 to 5 μM, which is consistent with other literatures. For exam- The motion and accumulation of these structures led to phase
ple, Ferrie et al.16 investigated the responses of A431 cells to variations, which have been used to measure viscoelastic proper-
histamine over the range of 2 nM to 100 μM, and observed a ties inside the cells and to perform protein microassay.17,18
linear dependence on the histamine concentration in the range of The scanning feature of SD-OCPM may also compromise
1 to 5 μM. the system stability and acquisition speed. The SD-OCPM
phase noise due to mechanical scanning produced ∼40.2-μrad
4 Discussion noise level averaged over the FoV with the cell-free plates.
Recent advances in high-speed wavelength-swept lasers and
The magnitudes and temporal profiles of SD-OCPM phase mea-
implementations of full-field optical coherence microscopes
surements can be utilized to evaluate efficacy of the drugs and to
would enable high-speed, scan-less, and multiplexed OCPM
design the drugs with a desired performance. Such response can
cell measurement while achieving improved phase stability.30,31
be a useful indicator for DMR occurrence, which represents acti-
vation or deactivation of membrane receptors, as demonstrated
in Ref. 5. For example, Schröder et al.7 have shown the real-time
5 Conclusion
screening of GPCRs of cells against various types of drugs with
RWG sensors. We employed SD-OCPM to measure local phase variations
Label-free cell-based assay with SD-OCPM exhibits several proximal to cell-substrate within ∼1.4 μm in depth to probe
distinct advantages and drawbacks compared with the other cell coverage and local intracellular dynamics. The setup is char-
optical methods.23 It can operate with plain glass-bottom micro- acterized by subnanometer level path-length sensitivity, and
titer plates, which are commercially available and inexpensive successfully monitored dynamic responses of MCF-7 cells to
compared with nanostructure-patterned plates. Moreover, since 2-picolinic acid and histamine. The intrinsic 3-D imaging capa-
the measurement can be performed with transparent plain bilities of SD-OCPM are expected to provide a new dimension
glasses, it can be easily integrated with other conventional of investigation for cell studies. We believe that our present
microscopy technologies such as bright-field and phase contrast work extended the application of SD-OCPM to cell biology
microscopes. Combination of SD-OCPM with other imaging as a label-free cell assay system.
Journal of Biomedical Optics 046003-5 April 2014 • Vol. 19(4)
Downloaded From: https://www.spiedigitallibrary.org/journals/Journal-of-Biomedical-Optics on 24 Oct 2020
Terms of Use: https://www.spiedigitallibrary.org/terms-of-useRyu et al.: Label-free cell-based assay with spectral-domain optical coherence phase microscopy
Acknowledgments 15. V. A. Medina and E. S. Rivera, “Histamine receptors and cancer phar-
macology,” Br. J. Pharmacol. 161(4), 755–767 (2010).
This research was supported in part by the research programs 16. A. M. Ferrie, Q. Wu, and Y. Fang, “Resonant waveguide grating imager
of National Research Foundation of Korea (NRF) (MEST for live cell sensing,” Appl. Phys. Lett. 97(22), 223704 (2010).
No. NRF-2012R1A1A1003867) and Center for BioNano 17. C. Joo et al., “Diffusive and directional intracellular dynamics measured
Health-Guard funded by the Ministry of Science, ICT & by field-based dynamic light scattering,” Opt. Express 18(3),
Future Planning (MSIP) of Korea as Global Frontier Project 2858–2871 (2010).
18. C. Joo and J. F. de Boer, “Spectral-domain optical coherence reflecto-
(H-GUARD_ 2013M3A6B2078959).
metric sensor for highly sensitive molecular detection,” Opt. Lett.
32(16), 2426–2428 (2007).
19. J. Fernandez-Pol, D. J. Klos, and P. D. Hamilton, “Antiviral, cytotoxic
References and apoptotic activities of picolinic acid on human immunodeficiency
1. P. Pozarowski, E. Holden, and Z. Darzynkiewicz, “Laser Scanning virus-1 and human herpes simplex virus-2 infected cells,” Anticancer
Cytometry,” in Cell Imaging Techniques, pp. 165–192, Springer, Res. 21(6A), 3773–3776 (2001).
New York, NY (2006). 20. M. Brischwein et al., “Electric cell-substrate impedance sensing with
2. M. A. Cooper, “Optical biosensors in drug discovery,” Nat. Rev. Drug screen printed electrode structures,” Lab on a Chip 6(6), 819–822
Discovery 1(7), 515–528 (2002). (2006).
3. S. M. Shamah and B. T. Cunningham, “Label-free cell-based assays 21. D. Malleo et al., “Continuous differential impedance spectroscopy of
using photonic crystal optical biosensors,” Analyst 136(6), 1090–1102 single cells,” Microfluid. Nanofluid. 9(2–3), 191–198 (2010).
(2011). 22. Y. Fang and A. M. Ferrie, “Label-free optical biosensor for ligand-
4. I. Giaever and C. R. Keese, “A morphological biosensor for mammalian directed functional selectivity acting on β2 adrenoceptor in living
cells,” Nature 366(6455), 591–592 (1993). cells,” FEBS Lett. 582(5), 558–564 (2008).
5. Y. Fang et al., “Characteristics of dynamic mass redistribution of epi- 23. A. M. Ferrie et al., “High resolution resonant waveguide grating imager
dermal growth factor receptor signaling in living cells measured with for cell cluster analysis under physiological condition,” Appl. Phys. Lett.
label-free optical biosensors,” Anal. Chem. 77(17), 5720–5725 (2005). 100(22), 223701 (2012).
6. B. T. Cunningham et al., “Label-free assays on the BIND system,” 24. P. O. Bagnaninchi et al., “Two-dimensional and three-dimensional
J. Biomol. Screening 9(6), 481–490 (2004). viability measurements of adult stem cells with optical coherence
7. R. Schröder et al., “Applying label-free dynamic mass redistribution phase microscopy,” J. Biomed. Opt. 16(8), 086003 (2011).
technology to frame signaling of G protein-coupled receptors noninva- 25. C. Holmes, M. Tabrizian, and P. O. Bagnaninchi, “Motility imaging via
sively in living cells,” Nat. Protocols 6(11), 1748–1760 (2011). optical coherence phase microscopy enables label‐free monitoring of
8. Y. Fang, A. G. Frutos, and R. Verklereen, “Label-free cell-based assays tissue growth and viability in 3D tissue‐engineering scaffolds,”
for GPCR screening,” Comb. Chem. High Throughput Screening 11(5), J. Tissue Eng. Regener. Med. (2013).
357–369 (2008). 26. J. Kühn et al., “Label-free cytotoxicity screening assay by digital
9. P. H. Lee, “Label-free optical biosensor: a tool for G protein-coupled holographic microscopy,” Assay Drug Dev. Technol. 11(2), 101–107
receptors pharmacology profiling and inverse agonists identification,” (2013).
J. Recept. Signal Transduction 29(3–4), 146–153 (2009). 27. G. Popescu et al., “Erythrocyte structure and dynamics quantified by
10. C. Joo et al., “Spectral-domain optical coherence phase microscopy for Hilbert phase microscopy,” J. Biomed. Opt. 10(6), 060503 (2005).
quantitative phase-contrast imaging,” Opt. Lett. 30(16), 2131–2133 28. N. Lue et al., “Quantitative phase imaging of live cells using fast Fourier
(2005). phase microscopy,” Appl. Opt. 46(10), 1836–1842 (2007).
11. C. Joo et al., “Spectral-domain optical coherence phase microscopy for 29. S. Tang et al., “Imaging subcellular scattering contrast by using com-
label-free multiplexed protein microarray assay,” Biosens. Bioelectron. bined optical coherence and multiphoton microscopy,” Opt. Lett. 32(5),
25(2), 275–281 (2009). 503–505 (2007).
12. M. Mujat et al., “Autocalibration of spectral-domain optical coherence 30. M. V. Sarunic, S. Weinberg, and J. A. Izatt, “Full-field swept-source
tomography spectrometers for in vivo quantitative retinal nerve fiber phase microscopy,” Opt. Lett. 31(10), 1462–1464 (2006).
layer birefringence determination,” J. Biomed. Opt. 12(4), 041205 31. R. Huber, M. Wojtkowski, and J. Fujimoto, “Fourier domain mode lock-
(2007). ing (FDML): a new laser operating regime and applications
13. A. K. Ellerbee and J. A. Izatt, “Phase retrieval in low-coherence inter- for optical coherence tomography,” Opt. Express 14(8), 3225–3237
ferometric microscopy,” Opt. Lett. 32(4), 388–390 (2007). (2006).
14. J. Fernandez-Pol, V. H. Bono, and G. S. Johnson, “Control of growth by
picolinic acid: Differential response of normal and transformed cells,” Biographies of the authors are not available.
Proc. Natl. Acad. Sci. 74(7), 2889–2893 (1977).
Journal of Biomedical Optics 046003-6 April 2014 • Vol. 19(4)
Downloaded From: https://www.spiedigitallibrary.org/journals/Journal-of-Biomedical-Optics on 24 Oct 2020
Terms of Use: https://www.spiedigitallibrary.org/terms-of-useYou can also read