Landbauforschung Applied Agricultural and Forestry Research - Vol. 65 No.1 03.2015
←
→
Page content transcription
If your browser does not render page correctly, please read the page content below
Landbauforschung
Applied Agricultural
and Forestry Research
Vol. 65
No.1 · 03.2015
Landbauforschung                                          Applied Agricultural and Forestry Research

Landbauforschung Applied Agricultural and Forestry        Landbauforschung Applied Agricultural and Forestry
Research ist eine wissenschaftliche Zeitschrift, in der   Research is a scientific journal, concerning the latest
Forschungsergebnisse zu gesellschaftlich relevanten       research results of socially relevant issues related to
Themen veröffentlicht werden, die einen Bezug zur         agriculture, forestry and rural development. The
Landwirtschaft, zur Forstwirtschaft und zur ländlichen    journal is targeted explicitly to interdisciplinary
Entwicklung aufweisen. Die Zeitschrift ist damit          topics.
explizit Disziplinen übergreifend ausgerichtet.
                                                          Particularly welcome are application-oriented
Veröffentlicht werden insbesondere anwendungs-            scientific contributions with an interdisciplinary
orientierte wissenschaftliche Beiträge, die interdis-     approach or with a close connection to other research
ziplinär angelegt sind oder die ausgeprägte Bezugs-       areas. The geographical focus of the journal is
punkte zu anderen Fachdisziplinen aufweisen. Der          Germany and Europe. Articles may be written in
geographische Fokus der Zeitschrift liegt auf             English or German. All articles are subject to a
Deutschland und Europa. Die Sprache der Beiträge ist      double-blind peer review.
deutsch oder englisch. Alle Beiträge unterliegen einer
doppelt anonymen Begutachtung (double-blind peer          Landbauforschung Applied Agricultural and Forestry
review).                                                  Research is published by the Thünen Institute with
                                                          headquarters in Brunswick, Germany. Authors are
Landbauforschung Applied Agricultural and Forestry        responsible for the content of their articles. The
Research wird vom Thünen-Institut in Braunschweig         publishers are not liable for the content.
herausgegeben. Für den Inhalt der Beiträge sind
die Autoren und Autorinnen verantwortlich. Eine           With the submission of a manuscript, the authors
Haftungsübernahme durch die Redaktion erfolgt             grant permission for publication. The guidelines for
nicht.                                                    the submission of manuscripts can be found under
                                                          www.ti.bund.de/en/infothek/publikationen/landbau-
Mit der Einsendung von Manuskripten geben die             forschung/ or obtained from the publishers.
Verfasser/Verfasserinnen ihre Einwilligung zur Ver-
öffentlichung. Die von den Autoren/Autorinnen zu          The print edition is published quarterly. Articles not
beachtenden Richtlinien zur Einreichung der Beiträge      yet assigned to a specific issue are available online
sind unter www.ti.bund.de/de/infothek/publikatio-         (“Online First”)
nen/landbauforschung/ oder bei der Geschäfts-
führung erhältlich.                                       Indexed in: CAB International, Science Citation Index
                                                          Expanded, Current Contents – Agriculture, Biology &
Als Printausgabe erscheinen vier Hefte pro Jahr.          Environmental Sciences, Scopus, Web of Science.
Beiträge, die noch keinem bestimmten Heft zuge-
ordnet sind, werden als Online First – Version            Publisher
veröffentlicht.                                           Johann Heinrich von Thünen Institute

Indexiert in: CAB International, Science Citation Index   Editor in Chief
Expanded, Current Contents – Agriculture, Biology &       Prof. Dr. Andreas Bolte,
Environmental Sciences, Scopus, Web of Science.           Prof. Dr. Peter Weingarten

Herausgeber                                               Managing Editor
Johann Heinrich von Thünen-Institut                       Dr. Matthias Rütze
                                                          Phone +49 40 - 73962 247
Schriftleitung                                            Leuschnerstraße 91
Prof. Dr. Andreas Bolte,                                  21031 Hamburg, Germany
Prof. Dr. Peter Weingarten                                landbauforschung@ti.bund.de
                                                          www.ti.bund.de
Geschäftsführung
Dr. Matthias Rütze                                        Graphic Design and Typesetting
Tel. +49 (0) 40 - 73962 247                               Karin Tamoschat-Depolt, Thünen Institute
Leuschnerstraße 91
21031 Hamburg, Germany                                    Photos cover pages
landbauforschung@ti.bund.de                               Katja Seifert, Thünen Institute (2),
www.ti.bund.de                                            Michael Welling, Thünen Institute (1)

Grafikdesign und Satz                                     ISSN 0458-6859
Karin Tamoschat-Depolt, Thünen-Institut                   Printed on FSC-certified paper
Fotos Umschlagseite                                       All rights reserved.
Katja Seifert, Thünen-Institut (2),
Michael Welling, Thünen-Institut (1)
ISSN 0458-6859
Gedruckt auf FSC-zertifiziertem Papier
Alle Rechte vorbehalten.
Landbauforschung
Applied Agricultural and Forestry Research
Vol. 65 No. 1 03.2015

Inhalt
Content

       Z. Fan, O. Schröder, and J. Krahl
       Analysis of diesel fuels/biodiesel blends and identification of biodiesel using time-resolved laser-induced
       fluorescence spectroscopy (TRLFS)
       Analyse und Identifizierung von Dieselkraftstoffen und Biodieselkraftstoffgemischen mittels zeitaufgelöster
01     laserinduzierter Fluoreszenzspektroskopie (ZLIF)

       Lilli A. Schroeder, Stephen Chaplin, and Johannes Isselstein
       What influences farmers’ acceptance of agri-environment schemes? An ex-post application of the
       ‘Theory of Planned Behaviour’
       Was beeinflusst die Akzeptanz von Landwirten gegenüber Agrarumweltmaßnahmen? Eine ex-post Anwendung
15     der „Theory of Planned Behaviour“

       Stefan Neumeier
       Regional accessibility of supermarkets and discounters in Germany – a quantitative assessment –
29     Regionale Erreichbarkeit von Supermärkten und Discountern in Deutschland – eine quantitative Abschätzung –

       Sonia Starosta und Angela Bergschmidt
       Animal Welfare Reporting in der EU – (was) kann Deutschland von seinen Nachbarn lernen?
47     Farm animal welfare reporting in Germany: what can we learn from our neighbours?

       Maria Sauer, Ioan Padeanu, Neculai Dragomir, Elena Ilisiu, Gerold Rahmann, Walter-Ioan Sauer,
       Sorin-Octavian Voia, and Dinu Gavojdian
       Organic goat meat production in less favoured areas of Romania
59     Ökologische Ziegenfleischproduktion in benachteiligten Regionen in Rumänien
Z. Fan, O. Schröder, J. Krahl · Landbauforsch · Appl Agric Forestry Res · 1 2015 (65)1-14
DOI: 10.3220/LBF1433315502000
                                                                                                                                               1

Analysis of diesel fuels/biodiesel blends and
identification of biodiesel using time-resolved
laser-induced fluorescence spectroscopy
(TRLFS)
Z. Fan, O. Schröder, and J. Krahl *

Abstract                                                                      Zusammenfassung
A method based on time-resolved laser-induced fluores-                        Analyse und Identifizierung von Diesel-
cence spectroscopy (TRLFS) was developed to characterize                      kraftstoffen und Biodieselkraftstoffge-
different fossil diesel fuels and biodiesel blends. The fre-
quency behavior and decay behavior of fluorescence excited                    mischen mittels zeitaufgelöster laser-
at 266 and 355 nm were measured. Differentiation of fuels                     induzierter Fluoreszenzspektroskopie
was achieved by principal component analysis (PCA) of their                   (ZLIF)
fluorescence-lifetimes at characteristic emission wavelengths.
For the quantification of biodiesel in blends, the quenching-                 Durch die zeitaufgelöste laserinduzierte Fluoreszenzspektro-
effect on the fluorescence was determined. The results showed                 skopie (ZLIF) gelingt die Identifizierung verschiedener fos-
that the quenching-effect at the characteristic emission                      siler Dieselkraftstoffe und deren Mischungen mit Biodiesel.
wavelengths (422 nm, 438 nm and 525 nm) with 355 nm                           Das Frequenz- und Abklingverhalten der Fluoreszenz wurde
laser excitation was unique for biodiesel blends. Based on                    bei Anregungswellenlängen von 266 nm und 355 nm be-
that, the identification and quantification of the biodiesel                  stimmt. Die Unterscheidung der Kraftstoffe erfolgte mittels
was possible. TRLFS is useful for in-situ detection of the                    mathematischer Hauptkomponentenanalyse (PCA). Zur
biogenic content of biodiesel blends.                                         Quantifizierung des Biodieselgehalts von Dieselkraftstoffen
                                                                              wurde der Fluoreszenzlöscheffekt genutzt.
Keywords: time-resolved laser-induced fluorescence spectros-                       Im Ergebnis zeigt sich, dass für Biodieselmischkraftstoffe
copy (TRLFS), diesel fuel, biodiesel, identification, quantification          der Fluoreszenzlöscheffekt bei Emissionswellenlängen von
                                                                              422 nm, 438 nm und 525 nm unter der Anregungswellen-
                                                                              länge von jeweils 355 nm charakteristisch ist. Auf dieser Basis
                                                                              sind die Identifizierung der Biodieselsorte und die Quantifi-
                                                                              zierung der Biodieselkonzentration möglich.

                                                                              Schlüsselwörter: Zeitaufgelöste laserinduzierte Fluoreszenz-
                                                                              spektroskopie (ZLIF), Dieselkraftstoff, Biodiesel, Identifizierung,
                                                                              Quantifizierung

*			Coburg University of Applied Sciences and Arts, Technology Transfer Centre Automotive Coburg (TAC),
		 Friedrich-Streib-Straße 2, D-96450 Coburg , Germany
		Contact: zhu.fan@hs-coburg.de
2                                                        Z. Fan, O. Schröder, J. Krahl · Landbauforsch · Appl Agric Forestry Res · 1 2015 (65)1-14

1		 Introduction                                                      Due to interference of the individual spectra by numerous
                                                                      fluorophores, fluorescence of diesel fuels is complex. The
The limited resources of fossil fuels and the negative climate        compounds with large conjugated double-bonds or ben-
impacts of greenhouse gases released from their combus-               zene rings are major sources of fluorescence in diesel fuel.
tion desire for alternative, renewable and CO2-neutral fuels.         The absorption of light in the conjugated system excites a
One such fuel is biodiesel which produced by the triglyceride         π-electron into an anti-bonding π* orbital (π-π* transition).
transesterification from vegetable, animal or waste oil               The fluorescence peaks of aromatic compounds are there-
(Knothe, 2001). Due to the variety of sources of raw materials        fore shifted to longer wavelengths (red shift) with increasing
used and natural variations of the content of the individual          alkylation (Dumke and Tescher, 1988; Khorasani, 1987).
ingredients in raw materials, the optimum performance and                   The fluorescence lifetime from the TRLFS-measurements
emissions of diesel engine operation is a particular challenge.       characterizes the unique fluorescence property of the
Therefore, it is of great economic and ecological importance          fluorophores in diesel fuels and biodiesel blends. Therefore,
to identify biodiesel in diesel fuel blends to achieve optimum        it can be used for characterization and identification of fuels
performance and emissions.                                            (Fan and Krahl, 2013). In our previous work we found that
     In this context Munack and Krahl developed a biodiesel           TRLFS with 266 nm pulsed laser excitation was able to detect
sensor which enables to determine the concentration of bio-           and distinguish the fossil diesel fuels and the biogenic fuels;
diesel (main components are Fatty Acid Methyl Ester – FAME)           especially the blends with different biogenic content.
in conventional diesel fuel. The sensor operates on the mea-                Just like the technique of face recognition and finger-
surement of the dielectric number and is suitable for bio-            print identification, for the exploratory analysis of the oils
diesel and its blends with diesel fuel as well as for the quanti-     and fuels by the means of fluorescence spectroscopy, the
fication of ethanol in gasoline (Munack and Krahl, 2003).             principal component analysis (PCA) can be applied (Guimet,
However this sensor could not identify the composition of             2005; Schmid, 2009; Sikorska et al., 2012; Fan et al., 2013).
conventional diesel fuel and biodiesel.                               PCA was invented in 1901 by Karl Pearson (Pearson, 1901)
     Some analytical laboratory techniques, e. g. GC-MS and           and the application has been widely described in
HPLC, can analyze the fuel components (Glover and Bullin,             literature (Bünting, 1999; Jolliffe, 2002; Scott et al., 2003;
1989; Plank and Lorbeer, 1995; Lechner et al., 1997; Foglia et        Guimet, 2005; Schmid, 2009; Kongbonga et al., 2011;
al., 2005). However these techniques need sample prepara-             Sikorska et al., 2012).
tion and are cost and time intensive, so that they cannot be                Hence the PCA-technique was used to analyze a two-way
applied for in-situ detection of fuels.                               matrix of life times. With this method, we achieved a quick
     Chuck et al., 2010 report about FT-IR spectroscopy, refrac-      and accurate analysis. The result makes the TRLFS-method
tive index and UV-vis spectroscopy to determine biodiesel in          attractive for online identification of diesel fuels and bio-
blends. Their work showed that FT-IR could be used on-vehicle         diesel blends.
for the determination of biodiesel content with refractive                  Caires et al. (2012) reported on quantification of biodiesel
index measurement providing the fatty acid composition.               content in biodiesel blends by a fluorescence spectrophoto-
However because of the cost and complexity both techniques            meter. In their work, the different blends were prepared from
may not be commercially viable. Application of UV–vis for             four refined vegetable oils (canola, sunflower, corn and soy-
on-vehicle is not considered feasible (Chuck et al., 2010).           bean biodiesel; biodiesel content up to 10 % v/v). Using a
     The aim of this paper is to introduce fluorescence sensing       fluorescence spectrophotometer with excitation at 260 nm,
technology to identify different fuels and their biodiesel            the fluorescence behavior at about 470 nm was same for all
blends. Methods based on fluorescence spectroscopy are easy           blends. This means that quantification of biodiesel based on
to use and provide quick and accurate results (Hengstermann           the fluorescence method at this emission wavelength is
and Reuter, 1980; Barbini et al., 1992; Camagni et al., 1991;         independent of the vegetable oil feedstock. However, it is
Patsayeva et al. 2000; Steffens et al., 2011; Scherer et al., 2011;   still doubtful whether this conclusion is really true for other
Ralston et al., 1996; Kulkarni et al., 2008; Zawadzki et al., 2007)   FAME. In our previous work, the fluorescence intensity of
and may be also used in the future to identify the fuels and          blend from CEC Reference Diesel Fuel (DFRef ) and RME at the
determine biodiesel content in the blend. However, these              emission wavelength of maximum intensity (338 nm) excited
methods are challenging in remote sensing application                 by the 266 nm laser was measured. Very little RME
because it requires the use of tunable lasers which usually have      fluorescence was found by the TRLFS at 266 nm laser exci-
too weak inten-sities (Quinn et al., 1994; Ryder et al., 2002).       tation. We reported that the fluorescence quenching-effect
     A method of time-resolved laser-induced fluorescence             must be considered in determining biodiesel concentrations
spectroscopy is suitable for remote sensing applications              (from 0 % to 100 % v/v) in biodiesel blends (Fan and Krahl,
using an intense pulsed Q-switched laser. It has been applied         2013). This means that at least the fluorescence behavior of
in the identification of fossil fuels (Hegazi et al., 2005; Jacob     RME was not same as the other FAME.
et al., 2006). Spectral characterization of crude oils was                  Rapeseed oil and soybean oil are the most important
attempted by using the contour diagrams of equal fluores-             vegetable raw materials for biodiesel in Germany (Bockey,
cence intensities. This served as unique fingerprints for the         2013). So blends with biodiesel from rapeseed oil methyl
crude oils from the TRLFS-techniques (Hegazi and Hamdan,              ester were preferentially studied in this work and soybean oil
2002; Hegazi et al., 2005).                                           methyl ester (SME) as well, because of its importance for
Z. Fan, O. Schröder, J. Krahl · Landbauforsch · Appl Agric Forestry Res · 1 2015 (65)1-14
3
South Europe and North America. Clear fluorescence could coordinate, and so on. The number of principal components
be detected for both biodiesels (RME and SME) when using should be much less than the number of original variables.
the TRLFS-technique with 355 nm laser to detect differences From PCA analysis, usually the terms of component scores
between fluorescence intensity and content of two bio- also called factor scores (the transformed variable values
diesels. Moreover, when excited by the 355 nm laser, the corresponding to a particular data point), and loadings (the
quenching-effect of biodiesel turned out to be unique. Based weight by which each standardized original variable should
on this, not only the identification but also the quantification be multiplied to get the component score) are obtained
of biodiesel in the biodiesel blends could be determined. (Pearson, 1901; Jolliffe, 2002; Abdi et al., 2010). The unfold
principal component analysis (U-PCA), also named multi-way
principal component analysis, is usually applied to analyze a
2 Spectroscopic methods and materials two-way matrix (∈ IRI x (J x K)) obtained after unfolding a three-
way array (∈ IRI x J x K) (Westerhuis et al., 1999; Henrion, 1994).
2.1 Theoretical background In this example, a data set of TRLFS-measurements is “I” the
The fluorescence emission in time-resolved measurements number of samples, “J” the number of emission lengths (λEM)
can be described like monomolecular reactions if the laser and “K” the number of decay times. In this work, the life times
pulse width is very short. Thus, the temporal emission can be of different fuels were calculated from the TRLFS-spectra and
described by the simple exponential decay function I(t) with a two-way array (∈ IRI x F) was built. Here “F” is the number of
fluorescence lifetime τ (Lampert et al., 1983; Lakowicz et al., selected emission wavelengths at which the lifetime was cal-
1991): culated. Then the dataset was analyzed using the PCA-tech-
nique. Compared to the U-PCA, this process avoided un-
t folding the spectra and also greatly reduced amount of data.
−
I (t ) = I t = 0 ⋅ e τ
(1) In this work the TRLFS-data were processed using the
software MATLAB (MathWorks R2010b).
Where It=0 is the fluorescence intensity at t = 0.
According to this equation, the fluorescence lifetime is 2.2 Measuring system
the time at which the fluorescence intensity is decayed to 1/e The TRLFS system, OPTIMOS, delivered by Optimare
(∼ 36.8 %) of the original value. (Wilhelmshaven, Germany) is based on the pulse method
In practice, the influence of the laser pulse width on the (time domain) and harmonic wavelength generation.
fluorescence lifetime must be considered. In this case, the The remote sensing experimental setup is shown in
experimentally measured Iexp(t) is not the true fluorescence Figure 1. All components of the OPTIMOS (Nd:YAG laser with
response function from the sample under investigation. The Q-switch, harmonic generator, delay generator, detector
experimentally recorded Iexp(t) is a convolution of the instru- (ICCD camera with spectrograph) and computer) are integra-
ment response function (excitation laser pulse) Ipulse(t) and ted into an aluminum rack with operation panel. The
the exponential decay function I(t) (Grinvald et al., 1974; OPTIMOS-system has been described in the literature
Terzic et al., 2008): (Optimare , 2005; Fan and Krahl, 2013).
t
I exp (t ) = ∫ I (t' ) ⋅ I (t − t' )dt'
pulse (2) 3th/4th Harmonic
Nd: YAG Laser
0 Generator
Q-switch
Laser pulse 1064 nm
For a complex mixture of N fluorophores, I(t) is the sum of Laser pulse
bifurcated
fluorescence intensities of all fluorophores i: 355 nm/266 nm
fiber optic
t
N − PC:
I (t ) = ∑ I i,t = 0 ⋅ e
τ
i
(3) Process control
Data storage Fluorescence
i =1
Delay Sample in
ICCD Camera
Cuvette
This equation is in accordance with Linear-Mixture-Model Generator
Spectrograph
(LMM) (Bünting, 1999; Martens and Naes, 1998) which is the
basis for the analysis of the overlaying or interfering signals
in this work. Figure 1
With PCA, an orthogonal linear transformation of ob- Schematic diagram of remote sensing experimental setup
servations of the correlated variables into values of uncor- of OPTIMOS-System
related variables in a new coordinate system can be made. In
this system, the greatest variance of the data is on the first
coordinate (also called the first principal component, PC1), The TRLFS measurement was performed on diesel fuels in a
the second greatest variance on the second perpendicular quartz cell. The emission spectra of different diesel fuels were
4                                                                        Z. Fan, O. Schröder, J. Krahl · Landbauforsch · Appl Agric Forestry Res · 1 2015 (65)1-14

recorded in the range 200 to 600 nm with a specific time gate                         right: Aral Diesel (up to 7 % biodiesel), Aral Ultimate
width (2 ns) and gate step (2 ns) excited at 266 and 355 nm.                          Diesel (biodiesel free, new generation high performance
                                                                                      diesel fuel), Shell V-Power Diesel (biodiesel free, new genera-
                                                                                      tion high performance diesel fuel); middle: Co-ordinating
2.3 Fuels                                                                             European Council (CEC) Reference Diesel Fuel by Haltermann
Most of the fuels were bought from filling stations or                                (DFRef , ca. 20 % aromatics), Biodiesel Blend (blend of CEC
delivered by mineral oil or biofuel companies (e.g. Shell,                            Reference Diesel, Biodiesel RME and Octanol), hydrotreated
Aral, China National Petroleum Corporation CNPC) in                                   vegetable oil HVO (Neste Oil); bottom: Diesel Fuel from CNPC
Europe, Asia and North/South America. Additionally, the                               in South China, Diesel Fuel from Argentina, Swedish mil-
Thünen Institute of Agricultural Technology, Braunschweig,                            jöklass 1 (MK1, aromatics free). These spectra represent fluo-
Germany, delivered different biodiesel qualities and blends                           rescence intensities with color bar as a function of wave-
of conventional and advanced biofuels. The fuels were ana-                            length (x-axis) and decay time (y-axis).
lysed by TRLFS without any prior treatment. To validate how                               In contrast to the set of 3D-TRLFS spectra with 266 nm
specific the fluorescence of diesel fuel brand is, the fluores-                       excitation, the fluorescence spectra for the same nine fuels
cences of the diesel fuel brand from up to five filling                               with pulsed 355 nm laser excitation are shown in Figure 3.
stations were tested. No significant differences were de-                                 In Figures 2 and 3, the discriminations of the shapes in
tected between the different filling stations. For study of                           the TRLFS spectra are clearly visible to differentiate with both
the dependence between fluorescence intensity and bio-                                excitations between diesel fuels and their blends with bio-
diesel content, we prepared different biodiesel fuel blends                           diesel. However, it should be noted that for the TRLFS mea-
(0 to 100 % v/v).                                                                     surement with 355 nm laser excitation, the signals of some
                                                                                      fluorophores were lost or shaded out. These fluorophores are
                                                                                      usually PAH with two or three aromatic rings (for example,
3		 Results                                                                           Acenaphthene, Fluorene, Phenanthrene and Naphthalene)
                                                                                      or the derivatives of PAH (for example, 1,3-Dimethylnaphtha-
3.1 Exploratory analysis of diesel fuels                                              lene and 1,6-Dimethylnaphthalene). Their emission wave-
                                                                                      lengths are usually shorter than 355 nm (Bünting, 1999;
3.1.1 TRLFS-spectra of diesel fuels                                                   Jacob et al., 2006; Fan et al., 2013). Therefore, it is recommen-
Figure 2 shows 3D-TRLFS fluorescence spectra of nine diffe-                           ded that for analysis of fluorescence spectra of diesel fuels,
rent fuels with pulsed 266 nm laser excitation (top, left to                          the 266 nm laser should be used.

                      100
                                       Aral Diesel                      Aral Ultimate Diesel                     Shell V-Power Diesel
                      80

                      60

                      40

                      20
                                                                                                                                                         1000
                       0
                      100                                                                                                                                2000
                                CEC Reference Diesel Fuel                Biodiesel Blend                             HVO (Neste Oil)
    Decay time [ns]

                      80                                                                                                                                 3000

                      60                                                                                                                                 4000
                      40
                                                                                                                                                         5000
                      20
                                                                                                                                                         6000
                        0
                                                                                                                                                         7000
                      100
                              CNPC Diesel Fuel, South China            Diesel Fuel, Argentina                        Swedish MK1                         8000
                      80

                      60                                                                                                                                 9000

                      40                                                                                                                               10000

                      20

                       0
                        200      300      400        500    600 200   300      400      500      600 200       300       400       500     600
                                                                      Emission wavelngth [nm]

Figure 2
3D-TRLFS fluorescence spectra of nine different fuels, excitation at 266 nm
Z. Fan, O. Schröder, J. Krahl · Landbauforsch · Appl Agric Forestry Res · 1 2015 (65)1-14
                                                                                                                                                                    5

                    100
                                     Aral Diesel                            Aral Ultimate Diesel                      Shell V-Power Diesel
                     80

                     60

                     40                                                                                                                                     1000
                                                                                                                                                            3000
                     20
                                                                                                                                                            5000
                      0
                    100                                                                                                                                     7000
                               CEC Reference Diesel Fuel                      Biodiesel Blend                           HVO (Neste Oil)
                                                                                                                                                            9000
  Decay time [ns]

                     80
                                                                                                                                                            11000
                     60
                                                                                                                                                            13000
                     40
                                                                                                                                                            15000
                     20                                                                                                                                     17000
                      0                                                                                                                                     19000
                    100
                             CNPC Diesel Fuel, South China                  Diesel Fuel, Argentina                                                          21000
                                                                                                                         Swedish MK1
                     80                                                                                                                                     23000
                     60                                                                                                                                     25000

                     40                                                                                                                                     27000

                     20                                                                                                                                     29000

                      0
                       300         400         500         600 300            400        500         600 300            400         500         600
                                                                           Emission wavelngth [nm]

Figure 3
3D-TRLFS fluorescence spectra of nine different fuels, excitation at 355 nm

3.1.2 Principal component analysis
The fluorescence lifetimes for characteristic emission wave-                                could build a new coordinate system and their scores repre-
lengths were calculated. The characteristic emission wave-                                  sent the transformed values of original variables in the new
lengths are the minimal wavelengths at which a maximum                                      coordinate system. A differentiation of these diesel fuels and
fluorescence of a fuel was detected. By comparing the                                       biodiesel fuel blends can be obtained by analysis of fluores-
spectra of these diesel fuels and biodiesel blends, nine cha-                               cence lifetime database using the PCA method.
racteristic emission wavelengths (300, 328, 340, 355, 377,                                       The score biplot of the first two principal components
396, 407, 414 and 423 nm) were selected. The fluorescence                                   PC1, PC2 (86.1 % of explained variance) is shown in Figure 4.
lifetimes for these characteristic emission wavelengths were                                It shows that the score of the first two principal components
calculated from the decay curve Iλ(t). The mean fluorescence                                of diesel fuels can be well distinguished. That is, first, the
lifetimes of the different fuels are listed in Table 1.                                     score-cluster of same fuels is within a certain range. Second,
As mentioned above, the loadings from PCA-method of the                                     the score-cluster of diesel fuels can be separated from each
measured original variables (fluorescence lifetimes) of fuels                               other very well.

Table 1
Mean lifetimes (in nanoseconds) of nine fuels at characteristic emission wavelengths

                                                                                                     Emission wavelengths [ nm ]
 Fuels
                                                                     300        328        340       355        377           396         407         414    423
 Aral Diesel                                                         15          12        12         19         29           37          36          39     41
 Aral Ultimate Diesel                                                 7          16        16         18         35           57          58          69     82
 Shell V-Power Diesel                                                14          14        15         22         34           44          44          45     49
 CEC Reference Diesel Fuel (DFRef )                                  27          23        22         24         37           54          47          48     48
 Biodiesel Blend from DFRef , RME and Octanol                        14          24        24         28         40           64          53          76    102
 HVO (Neste Oil)                                                     12          16        19         21         22           22          21          22     23
 CNPC Diesel Fuel, South China                                       45             9          9      15         21           22          22          22     24
 Diesel Fuel, Argentina                                              14          11        11         13         16           17          16          18     18
 Swedish MK1                                                         11          21        26         31         33           40          39          48     55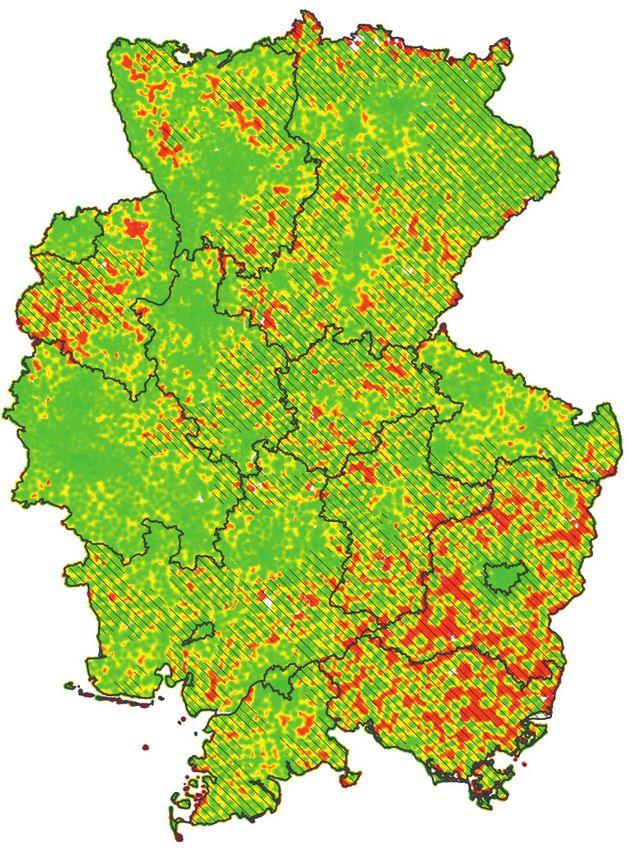
6 Z. Fan, O. Schröder, J. Krahl · Landbauforsch · Appl Agric Forestry Res · 1 2015 (65)1-14
4 Diesel Fuel, South China have the shortest fluorescence life-
times at these emission wavelengths.
3
HVO Swedish MK1 Conversely, a high score in PC2 (15.5 % variance is ex-
2 (Neste Oil)
plained) is mostly related to a low emission wavelength
1 Diesel Fuel,
Argentina
CEC Reference (300 nm). The fluorescence at this wavelength was related to
Diesel Fuel
PAH with two or three benzene rings (e g. naphthalene,
PC 2
0
Biodiesel Blend fluorine, anthracene or their derivatives). PC2 doesn’t dis-
-1 Shell V-Power
CNPC Diesel Fuel,
South China Aral Diesel
Diesel tinguish the diesel fuels as well as PC1, however, it can be
-2
seen that HVO (Neste Oil) and Swedish MK1 (which have the
Aral Ultimate
-3 Diesel most positive scores in PC2) own the longest fluorescence
-4 lifetime at low emission wavelength (300 nm). The most
4 3 2 1 0 -1 -2 -3 -4 negative score in PC2 of Aral Ultimate Diesel had the shortest
PC 1
fluorescence lifetime of 300 nm.
Figure 4 For comparison, U-PCA of the emission spectra of fuels
Score biplot from PCA of the first two principal components between λEM = 300 nm and 530 nm, as well as decay time
(PC1: 70.6 % und PC2: 15.5 %) from 0 to 200 ns, was carried out. The wave length step is
0.383 nm and decay time step is 2 ns. The dimension of a
TRLFS spectrum is 624 x 101. The variances accounted for the
These nine diesel fuels and biodiesel blends are separated first two PCs for both analyses and are shown in Table 2.
mainly along PC1. Diesel Fuel, Argentina and CNPC Diesel
Fuel, South China have the most negative scores; in contrast
Biodiesel Blend has the most positive scores. Table 2
Percentage of explained variance of the PCA and U-PCA models
1
PCAa U-PCAb
PC1 PC2 (life times at nine EMs) (time-resolved emission spectra)
0,8
PC1 PC2 PC1 PC2
0,6 70.6 % 15.5 % 47.8 % 31.1 %
Loading [-]
a: matrix dimension of life times: 9 x 9
0,4 b: matrix dimension of a TRLFS spectrum: 9 x 63024
0,2
This shows that for PCA of the life time of fuels, PC1 and PC2
0
cumulatively explained 86.1 % of the total variance. For
-0,2
U-PCA of the emission spectra of fuels this value was by con-
290 310 330 350 370 390 410 430 trast 78.9 %.
Emission wavelngth [nm]
50
Figure 5 45 CNPC Diesel Fuel,
South China
Loading plot from PCA of PC1 and PC2 of the fluorescence
Lifetime at EM = 300 nm [ns]
40
lifetime matrix at nine emission wavelengths
35
CEC Reference
30 Diesel Fuel
25
The loadings in Figure 5 indicate that a high score in PC1
(70.6 % variance is explained) is mostly related to high 20 Diesel Fuel,
Argentina Aral Diesel
Biodiesel Blend
emission wavelengths (396, 407, 414 and 423 nm). The fluores- 15 Shell V-Power Diesel
cence in the wavelength range was related to PAH with more 10 HVO Swedish MK1 Aral Ultimate
than three benzene rings (for example, chrysene, dibenz [a,h] 5
(Neste Oil)
Diesel
anthracene, Benzo [g,h,i] perylene or their derivatives) (Ma et 20 40 60 80 100
al., 1996; Fan et al., 2013). Despite their low content in the Lifetime at EM = 423 nm [ns]
reference diesel fuel (< 0.1 % (m/m), see Appendix A), the
fluorescence life time could be determined very well and Figure 6
used to identify diesel fuels, because fluorescence is a very Biplot of the mean fluorescence lifetimes (at EM = 300 nm
sensitive technique and TRLFS provides excellent measure- und 423 nm) of nine fuels
ment stability for the fluorescence life time. The most posi-
tive scores of Biodiesel Blend have the longest fluorescence
lifetime at these high emission wavelengths. Also the most It is possible to distinguish the different diesel fuels and bio-
negative scores in PC1 of Diesel Fuel, Argentina and CNPC diesel fuel blends by their lifetimes at characteristicZ. Fan, O. Schröder, J. Krahl · Landbauforsch · Appl Agric Forestry Res · 1 2015 (65)1-14
7
wavelengths (300 nm and 423 nm), because the PC1 and PC2 500 nm, which correspond to the remaining fluorophores
is mostly based on the fluorescence lifetime of these wave- (oxidation products or tocopherols) of SME from refinement
lengths. Figure 6 shows a biplot of mean fluorescence life- processes (Sayago et al., 2004; Kongbonga et al., 2011). The
times at these wavelengths from Table 1. emission wavelength for the maximum fluorescence inten-
It shows that, just like PCA, by using the two fluorescence sity of neat SME is 438 nm.
lifetimes, that these diesel fuels can be easily well
distinguished. Biodiesel Blend has the longest fluorescence
lifetime at EM = 423 nm. In contrast, Diesel Fuel, Argentina, 350000
340 nm
CNPC Diesel Fuel, South China and HVO (Neste Oil) have short
300000
Fluorescence intensity [arb. units]
lifetimes. This correlates to the analysis by PC1 (Figure 4).
DFRef RME SME
At EM = 300 nm, Aral Ultimate Diesel showed the shor- 250000
test fluorescence lifetime. It is also in parallel to the analysis
by PCA. In contrast to PCA, CNPC Diesel Fuel, South China 200000
and CEC Reference Diesel Fuel have the longer lifetimes. 150000
100000
3.2 Identification of biodiesel in biodiesel blends 50000
According to Beer’s law and the Linear-Mixture-Model under
constant experimental conditions (e. g. temperature, pressure, 0
340 390 440 490 540 590
pH), when a fluorophor is analyzed at low concentrations in a 290
Emission wavelength [nm]
homogeneous solution with negligible matrix interference,
a simple relationship between fluorescence intensity If at a
given emission wavelength and biodiesel concentration BX Figure 7
(X is the percentage of biodiesel blended) is given by the Fluorescence frequency behavior of CEC Reference Diesel
following formula (4): Fuel (DFRef ) and biodiesel fuel RME under excitation at
266 nm
I f = I fossil ⋅ (1 − BX ) + I bio ⋅ BX = k ⋅ BX + b (4)
422 nm
250000
Here Ifossil and Ibio are the fluorescence intensity of pure fossil
Fluorescence intensity [arb. units]
DFRef RME SME
diesel and pure biodiesel. 200000
To determine the biodiesel content in diesel fuel, blends
(B0, B5, B7, B10, B20, B30, B40, B50, B60, B70, B80, B90, B92, 150000
B95, B98, B100) were prepared from CEC Reference Diesel
Fuel (DFRef , Appendix A) and biodiesels (RME and SME, 100000
Appendix B).
525 nm
Figure 7 shows that with 266 nm excitation, the fluores- 50000
438 nm
cence for the ultraviolet and visible region derived only from
the CEC Reference Diesel Fuel and not from RME or SME since 0
the fluorescence of the possible fluorophore (Vitamin E, 380 430 480 530 580
natural antioxidants) in biodiesel at excitation of 266 nm was Emission wavelength [nm]
undetectable. The TRLFS-spectrum of neat reference diesel
showed that the emission wavelength for the maximum Figure 8
fluorescence intensity was 340 nm. Therefore, for the excita- Fluorescence frequency behavior of CEC Reference Diesel
tion wavelength of 266 nm, the diesel fuel content in fuel Fuel (DFRef ), RME and SME under excitation at 355 nm
blend could be referred to by the fluorescence intensity at
the emission wavelength of 340 nm. The biodiesel content
can be indirectly calculated using Formula (4). For the excitation wavelength of 355 nm, the fossil diesel fuel
At 355 nm excitation, the fluorescence derives both from content in fuel blend could be determined by the fluores-
the reference diesel fuel, RME and SME (Figure 8). The emission cence intensity at the emission wavelength of 422 nm. In
wavelength for the maximum fluorescence inten-sity of neat contrast, the content of RME in fuel blend could be deter-
reference diesel is 422 nm. At this emission wavelength, mined by the fluorescence intensity at the emission wave-
there is no fluorescence from RME. The emission wavelength length of 525 nm. The content of SME could be referred at
for the maximum fluorescence intensity of neat RME is the emission wavelength of 438 nm. It is noticeable that the
525 nm, which belongs to Vitamin E (Kyriakidis and Skarkalis, fluorescence intensity at 438 nm from fossil diesel fuel is
2000; Sayago et al., 2004; Kongbonga, et al. 2011). For neat about three times higher than that from SME. The emission
SME, there are strong fluorescences between 400 nm and bands observed in diesel are principally due to aromatic8 Z. Fan, O. Schröder, J. Krahl · Landbauforsch · Appl Agric Forestry Res · 1 2015 (65)1-14
compounds/conjugated double bonds and could be a strong Here If,0 is the fluorescence intensity without quenching and
influence on the fluorescence of SME. The fluorescence has a linear dependence with fossil diesel concentration [FL]
intensity from fossil diesel fuel at 525 nm is similar to that and biodiesel concentration BX with factor k1 and k2. If is the
from RME. So it is possible that there is an influence on the fluorescence intensity with quenching. KSV is the Stern-Volmer
fluorescence of RME by fossil diesel. constant and [Q] is the quencher concentration. For self-
quenching the fluorophore concentration [FL] is equal to [Q].
By fitting the Stern-Volmer equation with the experimen-
3.2.1 Measurement with 266 nm laser excitation tal data, the two constants were determined: KSV = 3.66, k1 =
The fluorescence intensities (with 266 nm laser excitation) are 4.56 and k2 = 0. From Figure 9, it can be found that the
normalized to the maximum value of the pure fossil Stern-Volmer equation was very well adapted to the experi-
diesel (at 340 nm). The fluorescence at 340 nm can be as- mental data.
cribed to PAH in CEC Reference Diesel Fuel. The normalized
fluorescence intensity for the emission wavelength of 340 nm
is plotted against the concentration of RME (Figure 9). 3.2.2 Measurement with 355 nm laser excitation
1.0 1.0 DFRef + RME
0.9 0.9 DFRef + SME
Adaption DFRef + RME
Norm. fluorescence intensity [-]
0.8 0.8
Fluorescence intensity [-]
Adaption DFRef + SME
0.7 0.7
EM = 422 nm
0.6 0.6
0.5 0.5
0.4
0.4
Norm. I 0.3
0.3
Norm. I_Model 0.2
0.2
0.1
0.1
0.0
0.0 0 10 20 30 40 50 60 70 80 90 100
0 10 20 30 40 50 60 70 80 90 100 Biodiesel content[%]
Biodiesel concentration BX [%] 1.0 DFRef + RME
0.9 DFRef + SME
Figure 9 Adaption DFRef + RME
0.8
Adaption of the Stern-Volmer equation with normalized Adaption DFRef + SME
Fluorescence intensity [-]
0.7
fluorescence intensity for the given emission wavelength of EM = 438 nm
0.6
340 nm versus content of RME in Biodiesel Blend, excitation
0.5
at 266 nm
0.4
0.3
0.2
It was observed that the fluorescence intensity decreased in
0.1
general with the increase of biodiesel concentration. How-
0.0
ever, there were some differences: the fluorescence of the 0 10 20 30 40 50 60 70 80 90 100
Biodiesel content[%]
blends was higher than expected (above the diagonal, see
Figure 9). The possible reason being secondary absorptions 0.11 DFRef + RME
by the compounds in fuels. Figure 9 showed a change of the 0.10 DFRef + SME
Adaption DFRef + RME
gradient in dependency of the biodiesel concentration.
Fluorescence intensity [-]
0.09 Adaption DFRef + SME
Especially at low biodiesel concentrations (B0 to B30), when 0.08
EM = 525 nm
the amount of concentration of fluorophores in the blends is
0.07
very high, the fluorescence will be quenched by the fluor-
0.06
ophores. This means that the fluorescence of blends with low
0.05
biodiesel concentration increases were not as strong as with
0.04
high biodiesel concentration. This phenomenon is similar to
the static self-quenching of fluorophores. 0.03
Generally, the static quenching effect can be described 0.02
0 10 20 30 40 50 60 70 80 90 100
by the Stern-Volmer equation (Somoogyi et al., 1993; Lakowicz, Biodiesel content[%]
2010; Eftink, 1991; Eftink et al., 1981; Lakos et al., 1995):
Figure 10
Adaption of the Stern-Volmer equation with experimental
I f ,0 k1 ⋅ [FL] + k 2 ⋅ BX
= = 1 + K SV ⋅ [Q ] (5) data of blends, for the given emission wavelength of
If If 422 nm (top), 438 nm (centre) and 525 nm (bottom)Z. Fan, O. Schröder, J. Krahl · Landbauforsch · Appl Agric Forestry Res · 1 2015 (65)1-14
9
The fluorescence intensities (at 355 nm laser excitation) were Table 3
normalized to the maximum value of the pure fossil diesel (at Parameters fitted for the Stern-Volmer equation for emission
422 nm). Then, the normalized values for the emission wave- wavelengths at 422, 438 and 525 nm
lengths of 422 nm, 438 nm and 525 nm were plotted against
the biodiesel concentration (Figure 10). Blends EM k1 k2 KSV
The fluorescence with the emission maximum at 422 nm 422 nm 0.9337 0.7599 2.7100
was ascribed to the CEC Reference Diesel Fuel. The DFRef + SME 438 nm 0.6511 0.8445 3.3365
fluorescence at 438 nm can be ascribed both to the fluor-
525 nm 0.0454 0.0169 -0.7658
ophores of SME and the CEC Reference Diesel Fuel. The fluo-
422 nm 0.9854 0.1487 4.8279
rescence at 525 nm was ascribed to the fluorophores of RME.
DFRef + RME 438 nm 0.6796 0.1397 4.7092
It was observed, that for the blends, the fluorescence
intensities at 422 nm did not show a linear relation with the 525 nm 0.0496 1.1088 25.1363
content of biodiesel because of the strong secondary absorp-
tion of biodiesel. This quenching effect of biodiesel could be
solved by the Stern-Volmer model. At the other emission In Figure 11, the diagram of fluorescence intensities for bio-
wavelengths of 438 nm and 525 nm, the relation between diesel blends are shown for these emission wavelengths.
the fluorescence intensity and biodiesel content could also Although only a general trend for the dependence between
be described by the Stern-Volmer equation (Figure 10). The fluorescence intensity at EM = 525 nm and biodiesel concen-
results of model analysis were verified by the results of tration could be found, the distinction of the blends at this
experiments. The parameters of the Stern-Volmer equation wavelength was so significant that the fluorescence at this
are shown in Table 3. The quenching-effect is unique for the wavelength could be used to identify the blends. The results
blends with different diesel and biodiesel at varying concen- suggest that the fluorescence at three characteristic
trations. At 525 nm wavelength, the blends whose data were emission wavelengths (422 nm, 438 nm and 525 nm) could
fitted using the Stern-Volmer equation showed a general be used for identification and quantification of biodiesel.
trend. This was because the fluorescence intensity of all fuels In order to validate this assumption, these fluorescence
was in the same range and near the noise level. Therefore, intensities and the correspondent concentrations were used
only a general trend was noted after using the Stern-Volmer as training dataset for a calibration to quantify the biodiesel
equation. content in unknown blends.
SME
42000
DFRef + RME
41000
DFRef + SME
40000
39000
38000 B90
37000
36000 B80
35000
If (EM = 525 nm)
34000 B70
33000 B60
32000 B2
DFRef
31000
B40 B5
30000 B30 B2
B50 B20 B10
29000 B5
B50
28000 B70
B7
27000 B7
B80 B60 B10
26000 B30
B40 4000
25000 0
3500 0
B90 B20 00
24000 3000
RME
00
23000 2500
00
2000
)
0
m
00
8n
00 1500
00
00
43
10 00 1000
00
=
00 00
EM
20
00 5000
If (
30 00 0
If (EM 00
= 42 40 00 0
2 nm 00 00
) 50 0
600
Figure 11
3D diagram of fluorescence intensities for the biodiesel blends10 Z. Fan, O. Schröder, J. Krahl · Landbauforsch · Appl Agric Forestry Res · 1 2015 (65)1-14
3.2.3 Validation blends could also be determined. Table 4 shows the high
This calibration was tested with blended samples with identification ability of this method: more than 90 % of the
different biodiesel content. In all, 40 test samples were mixed fuels were identified.
consisting of DFRef and SME or DFRef and RME to evaluate the
true predictive ability of the calibrated model. Identification
and quantification of biodiesel in the test samples were
carried out according to the similarity of the test samples by 100 RME
the variables (If(EM = 422 nm), If(EM = 438 nm) and If(EM = 90 diagonal
525 nm)) with the calibration samples. In this work, we used 80
Euclidean distance, D, between test samples i and known 70
samples j to indicate the similarity (Vandeginste et al., 1998): 60
Cpredicted [%]
50
∑ (I )
K 40
2
Di , j = f i,k −If j ,k
(6) 30
k =1 20
10
where K is the number of variables, here it is 3. 0
The smallest distance Dmin1 means the test sample was 0 10 20 30 40 50 60 70 80 90 100
almost similar to the corresponding known sample. Thus CIs[%]
according to the Dmin1 the biodiesel in the blend could be
identified. Also the second smallest distance Dmin2 could be Figure 13
calculated. Finally, according to Dmin1 and Dmin2, the biodiesel Predicted vs. true concentration for RME in biodiesel blends
content c in test blend could be calculated: using a linear
interpolation between these two known concentrations (BX1
and BX2): 100 SME
90 diagonal
Dmin 1 c − BX 1 (BX 2 ⋅ Dmin 1 − BX 1 ⋅ Dmin 2 ) (7) 80
= ⇒c=
(Dmin 1 − Dmin 2 )
70
Dmin 2 c − BX 2 60
Cpredicted [%]
50
40
The results of quantification of DFRef, RME and SME in bio-
30
diesel blends are shown in Figure 12, 13 and 14. Table 4
20
shows the prediction ability for identification of biodiesel
10
type.
0
0 10 20 30 40 50 60 70 80 90 100
CIs[%]
100 DFRef
90 diagonal
Figure 14
80 Predicted vs. true concentration for SME in biodiesel blends
70
60
Cpredicted [%]
Table 4
50
Prediction ability for identification of biodiesel type in bio-
40
diesel blends.
30
20
DF RME SME
10
true 40 37 37
0
0 10 20 30 40 50 60 70 80 90 100 false 0 3 3
CIs[%]
Figure 12
Predicted vs. true concentration for DFRef in biodiesel blends It should be noted that the high residuals (greater than 10)
were caused by false identification of biodiesel. For example,
a blend of 93 % DFRef and 7 % RME, showed that there should
Fossil diesel can (Figure 12 and Table 4) be identified and be 85 % DFRef and 15 % SME. Therefore, a high residual occur-
quantified even at low concentrations (DFRef % smaller than red. It means that correct identification of biodiesels plays a
1 %). RME and SME (Figure 13, Figure 14 and Table 4) in most very important role for the quantification. Therefore, theZ. Fan, O. Schröder, J. Krahl · Landbauforsch · Appl Agric Forestry Res · 1 2015 (65)1-14
11
identification method needs to be improved. For example, fuels and biodiesel in the blends can be quickly and easily
the expansion of the measuring range of emission wave- quantified. This has a major significance for optimizing
length in the detector and adjustment of the wavelength of vehicle performance and reducing engine emissions. In con-
the laser light may need improvements. trast to the measurement at 266 nm laser excitation, the
detectable fluorescence emission of biodiesel at 355 nm
laser excitation was found. Also noted for the different bio-
4 Conclusions diesel blends, the relationships between biodiesel content
and the fluorescent intensity at a specific wavelength are
In this work, the fluorescence properties of over 50 diesel unique and are caused by fluorescence of fluorophores and
fuels and biodiesel mixtures were determined by TRLFS at also by the fluorescence quenching-effect of fossil diesel and
266 nm and 355 nm pulse laser excitations. Using fluores- biodiesel. By comparison, with a calibration dataset of fluores-
cence characteristics, a variety of different fuel sources could cence at three characteristical emission wavelengths
be distinguished. The studies have shown that under cons- (422 nm, 438 nm and 525 nm), biodiesel in biodiesel blends
tant experimental conditions, the fluorescence lifetime at in most instances (over 90 %) could not only be identified but
each emission wavelength is dependent on the interaction also quantified.
between fluorophores and non-fluorescent substances in To optimize the method the measuring range of the
diesel fuels. The time-resolved fluorescence spectra can detector and the excitation wavelength of the laser source
show the main fluorescence characteristics of diesel fuels. must be varied. On the global market other FAME, e.g. palm
Therefore, fluorescence allows you to distinguish the lifetime oil methyl ester (PME), coconut oil methyl ester (CME) and
of diesel fuels. used cooking oil methyl ester (UCOME) are also relevant.
The PCA method used as the pre-processing could provide a Their impact on fluorescence must be investigated, too.
very intuitive analysis for different diesel fuels. Compared to Because the huge variety of fossil diesels especially regar-
U-PCA which requires to process the whole three- ding aromatics the accuracy of biodiesel quantification in
dimensional spectral information, the proposed method can blends is the main challenge.
significantly reduce the amount of data.
Compared to the traditional analytical methods such as
GC-MS, HPLC, etc., the TRLFS method provides faster and Acknowledgements
more accurate distinction and does not require sample
preparation. By considering these advantages, it can be used This work was financially supported by Fachagentur Nach-
at the gas station or in the car, for example to prevent mis- wachsende Rohstoffe e.V. (FNR), “Fluoreszenzspektros-
fuelling and to provide in-situ information of the diesel fuels kopische Charakterisierung und Identifizierung von Kraft-
and biodiesel content for the engine control system of the stoffgemischen zur Entwicklung eines Kraftstoffsensors
vehicle. (TRLFS) – Project 22004710.” We also thank the Thünen
In addition, by determination of fluorescence intensity at Institute of Agricultural Technology for support and the
characteristic emission wavelengths, the content of diesel supply of biofuel blends.12 Z. Fan, O. Schröder, J. Krahl · Landbauforsch · Appl Agric Forestry Res · 1 2015 (65)1-14
Appendix A
Fuel data in accordance with CEC RF-06-03 of the fossil diesel fuels used (DFRef )
Properties Methods Units Limit Limit DFRef
DIN EN Min. Max
cetane number ISO 15195 - 52 54 53.4
cetane index ISO 4264 - 46 -
density (15 °C) ISO 12185 kg/m3 833 837 834.3
polycyclic aromatic hydrocarbon ISO 12916 % (m/m) 3 6 4.6
sulphur content ISO 20884 mg/kg - 10 3
flashpoint ISO 2719 °C > 55 - 92
carbon residue ISO 10370 % (m/m) - 0.2 < 0.01
ash content ISO 6245 % (m/m) - 0.01 < 0.001
water content ISO 12937 mg/kg - 200 23
total contamination ISO 12662 mg/kg - 20
copper strip corrosion (3 h to 50 °C) ISO 2160 degree of corrosion 1 1 1A
oxidation stability ISO 12205 g/m3 - 25Z. Fan, O. Schröder, J. Krahl · Landbauforsch · Appl Agric Forestry Res · 1 2015 (65)1-14
13
Appendix B
Fuel data in accordance with DIN EN 14214 of the biodiesel fuels used (RME and SME)
Properties Methods units Limit Limit RME SME
DIN EN Min. Max
ester content 14103 % (m/m) 96.5 - 98.2 98.4
density (15 °C) ISO 12185 kg/m3 860 900 883.1 885.7
kin. viskosity (40 °C) ISO 3104 mm2/s 3.5 5.0 4.458 4.123
flashpoint ISO 3679 °C 101 - 182 168
CFPP 116 °C - 0/-10/-20 -14 -6
sulphur content ISO 20884 mg/kg - 10.014 Z. Fan, O. Schröder, J. Krahl · Landbauforsch · Appl Agric Forestry Res · 1 2015 (65)1-14
Hegazi E, Hamdan A, Mastromarino J (2005) Remote fingerprinting of crude Schmid U (2009) Entwicklung chemometrischer Methoden für die Klassifika-
oil using timeresolved fluorescence spectra. Arab J Sci Eng B 30(1):1-12 tion von Bakterien mittels Mikro-Raman-Spektroskopie. Braunschweig :
Hengstermann T, Reuter R (1980) Lidar fluorosensing of mineral oil spills on Techn Univ, 205 p
the sea surface. Appl Optics 29(22):3218-3327 Scott SM, James D, Ali Z, O’Hare WT, Rowell FJ (2003) Total luminescence
Henrion R (1994) N-way principal component analysis theory, algorithms and spectroscopy with pattern recognition for classification of edible oils.
applications. Chemometr Intell Lab Syst 25:1-23 Analyst 128(7):966-973
Jacob I, Krahl J, Gnuschke H (2006) Einsatz der zeitaufgelösten Laserfluores- Sikorska E, Khmelinskii I, Sikorski M (2012) Analysis of olive oils by fluores-
zenz-Spektroskopie bei der Analyse partikelgebundener PAK : Ab- cence spectroscopy : methods and applications. Intech Open Access Publ
schlussbericht. Coburg : Fachhochschule Coburg, 67 p Somoogyi B, Lakos Z (1993) Protein dynamics and fluorescence quenching. J
Jolliffe IT (2002) Principal component analysis. New York : Springer, 487 p Photochem Photobiol B 18:3-16
Khorasani GK (1987) Novel development in fluorescencemicroscopy of com- Steffens J, Landulfo E, Courrol LC, Guardani R (2011) Application of fluores-
plex organic mixtures : application in petroleumgeochemistry. Org Geo- cence to the study of crude petroleum. J Fluoresc 21:859-864
chem 11;157-168 Terzic M, Marinkovic BP, Sevic D, Jureta J, Milosavljevic AR (2008) Develop-
Knothe G (2001) Historical perspectives on vegetable oil-based diesel fuels ment of time-resolved laser-induced fluorescence spectroscopic tech-
[online]. To be found at [quoted 03.03.2015] Chemistry Technol 6(1):105-117
Kongbonga YGM, Ghalila H, Onana MB, Majdi Y, Lakhdar ZB, Mezlini H, Vandeginste BGM, Massart DL, Buydens LMC, de Jong S, Lewi PJ, Smeyers-
Sevestre-Ghalila S (2011) Characterization of vegetable oils by fluores- Verbeke J (1998) Handbook of chemometrics and qualimetrics : part B.
cence spectroscopy. Food Nutr Sci 2:692-699 Amsterdam : Elsevier
Kulkarni BM, Pujar BG, Shanmukhappa S (2008) Investigation of acid oil as a Westerhuis JA, Kourti T, MacGregor JF (1999) Comparing alternative ap-
source of biodiesel. Indian J Chem Technol 15:467-471 proaches for multivariate statistical analysis of batch process data.
Kyriakidis NB, Skarkalis P (2000) Fluorescence spectra measurement of olive J Chemom 13:397-413
oil and other vegetable oils. J AOAC Int 83(6):1435-1239 Zawadzki A, Shrestha DS, He B (2007) Biodiesel blend level detection using
Lakos Z, Szarka A, Koszorus L, Somogyi B (1995) Quenching-resolved emis- ultraviolet absorption spectra. Trans Am Soc Agric Eng 50(4):1349-1353
sion anisotropy : a steady state fluorescence method to study protein
dynamics. J Photochem Photobiol B 27:55-60
Lakowicz JR (2010) Principles of fluorescence spectroscopy. 3th Edition New
York : Springer, 954 p
Lakowicz JR, Cryczynski I, Laczko G, Gloyna D (1991) Picosescond fluores-
cence lifetime standards for frequency- and time-domain fluorescence. J
Fluoresc 1:87-93
Lampert RA, Chewter LA, Phillips D, O’Connor DV, Roberts AJ (1983) Stan-
dards for nanosecond fluorescence decay time measurements. Anal
Chem 55:68-73
Lechner M, Bauer-Plank C, Lorbeer E (1997) Determination of acylglycerols
in vegetable oil methyl esters by on-line normal phase LC–GC. J High
Resolut Chromatogr 20:581-585
Ma XL, Sakanishi K, Isoda T, Nagao S, Mochida I (1996) Structural characteris-
tics and removal of visible-fluorescence species in hydrodesulfurized
diesel oil. Energy Fuels 10(1):91-96
Martens H, Naes T (1998) Multivariate calibration based on the linear mixture
model. In: Martens H, Naes T (eds) Multivariate calibration. Chichester :
Wiley, pp 166-213
Munack A, Krahl J (eds.) (2003) Erkennung des RME-Betriebes mittels eines
Biodiesel-Kraftstoffsensors. Braunschweig : FAL, 76 p, Landbauforsch
Völkenrode SH 257
Optimare (2005) OPTIMOS & OPTIMOS-Midi operation manual
Patsayeva S, Yuzhakov V, Varlamov V, Barbini R, Fantoni R, Frassanito C,
Palucci A (2000) Laser spectroscopy of mineral oils on water surface.
EARSeL eProceedings 1(1):106-115
Pearson K (1901) On lines and planes of closest fit to systems of points in
space. Philosoph Magazine 2(6):559-5721)
Plank C, Lorbeer E (1995) Simultaneous determination of glycerol and
mono-di-triglycerides I vegetable oil methyl esters by capillary LC-GC. J
Chromatogr A 697:461-468
Quinn MF, Alotaibi AS, Sethi PS, Albahrani F, Alameddine O (1994) Measure-
ment and analysis procedures for remote identification of oil spills using
a laser fluorosensor. Int J Remote Sensing 15(13):2637-2658
Ralston CY, Wu X, Mullins OC (1996) Quantum yields of crude oils. Appl
Spectrosc 50:1563-1568
Ryder AG, Glynn TJ, Feely M, Barwise AJ (2002) Characterization of crude oils
using fluorescence lifetime data. Spect Act A 58:1025-1038
Sayago A, Morales MT, Aparicio R (2004) Detection of hazelnut oil in virgin
olive oil by a spectrofluorimetric method. Eur Food Res Technol
218(5):480-483
Scherer MD, Oliveira SL, Lima SM, Andrade LH, Caires AR (2011) Determina-
tion of the biodiesel content in diesel/biodiesel blends : a method based
on fluorescence spectroscopy. J Fluoresc21(3):1027–1031L. A. Schroeder, S. Chaplin, J. Isselstein · Landbauforsch · Appl Agric Forestry Res · 1 2015 (65)15-28
DOI: 10.3220/LBF1440149868000
15
What influences farmers’ acceptance of agri-
environment schemes? An ex-post application
of the ‘Theory of Planned Behaviour’
Lilli A. Schroeder*, Stephen Chaplin**, and Johannes Isselstein***
Abstract Zusammenfassung
A better understanding of farmers’ behaviour regarding agri- Was beeinflusst die Akzeptanz von
environment schemes (AES) can be one step towards further Landwirten gegenüber Agrarumwelt-
improving these voluntary schemes. In order to assess far-
mers’ acceptance and perception of agri-environment sche- maßnahmen? Eine ex-post Anwendung
mes, the ‘Theory of Planned Behaviour’ (TPB) was applied ex- der „Theory of Planned Behaviour“
post to identify factors influencing farmers’ willingness to
join agri-environment schemes. This ex-post application is a Ein besseres Verständnis des Verhaltens von Landwirten in
new approach of using the TPB and also the analysis of far- Bezug auf Agrarumweltmaßnahmen (AUM) kann zur weiteren
mers’ acceptance towards AES by using the TPB has not been Verbesserung dieser Programme beitragen. Um dies zu unter-
done before. In the ‘Yorkshire and The Humber’ region of suchen und Einflussfaktoren auf die Teilnahmebereitschaft zu
northern England, standardized face-to-face interviews were identifizieren, wurde die ‚Theory of Planned Behaviour‘ (TPB)
conducted with 32 farmers already participating in an AES. ex-post angewendet, was ein neuer Ansatz ist. In der ‚Yorkshire
The results demonstrate that the general attitude and accep- and The Humber‘ Region im Norden Englands wurden stan-
tance of the English scheme are high. Biodiversity, landscape, dardisierte, persönliche Interviews mit 32 Landwirten durch-
and natural resources are perceived to be improved by the geführt, die bereits an AUM teilnahmen. Die generelle Einstel-
scheme and to be valuable. An increase in weeds was percei- lung und Akzeptanz gegenüber den Programmen sind hoch.
ved as an undesirable outcome. Farmers’ families were Als positive Auswirkung der Programme wurde eine Verbesse-
ranked to have the highest and most positive social pressure rung von Biodiversität, Landschaft und natürlichen Ressour-
on farmers’ decisions to join AES. Interestingly, the opinion of cen wahrgenommen; als negative das vermehrte Vorkommen
other farmers or of the farm advisor did not influence the far- von Unkräutern. Der größte und positivste Einfluss auf die
mers much. More paperwork and more demanding manage- Landwirte bezüglich einer Programmteilnahme wurde ihren
ment requirements would make it much more difficult to Familien zugeordnet; die Meinung anderer Landwirte und des
join the scheme. The provision of advice and greater conside- Betriebsberaters beeinflusste kaum. Mehr Schreibarbeit sowie
ration of environmental conservation in policy development noch strengere Bewirtschaftungsauflagen würden die Teil-
were perceived to make joining the scheme more attractive. nahme wesentlich erschweren, Beratung und mehr Berück-
Most of the gained results are confirmed by the literature. sichtigung von Umweltschutz in der Politik die Teilnahme
This shows that the ex-post application of the TPB is feasible erleichtern. Der Großteil der gewonnenen Ergebnisse wird
and that acceptance of AES can be analysed by using the TPB. durch die Literatur bestätigt; ferner ist die ex-post Anwen-
dung der TPB zur Analyse der Akzeptanz von AUM praktikabel.
Keywords: environmental conservation, Theory of Planned
Behaviour, farmers‘ values, farmers‘ behaviour, farmers‘ beliefs, Schlüsselwörter: Umweltschutz, Theory of Planned Behaviour,
farmers‘ decision-making process Wertvorstellungen der Landwirte, Verhalten der Landwirte,
Überzeugungen der Landwirte, Entscheidungsprozesse der
Landwirte
* Johann Heinrich von Thünen Institute, Federal Research Institute for Rural Areas, Forestry and Fisheries, Institute of Rural Studies, Bundesallee 50,
38116 Braunschweig, Germany
** Natural England, Land Management Development Unit, King’s Pool, 1-2 Peasholme Green, York, YO1 7PX, United Kingdom
*** Georg-August-University of Göttingen, Department of Crop Sciences/Grassland Science, von Siebold-Str. 8, 37075 Göttingen, Germany
Contact: lilli.schroeder@ti.bund.deYou can also read