Laying hen mortality in different indoor housing systems: a meta analysis of data from commercial farms in 16 countries - Nature
←
→
Page content transcription
If your browser does not render page correctly, please read the page content below
www.nature.com/scientificreports
OPEN Laying hen mortality in different
indoor housing systems:
a meta‑analysis of data
from commercial farms in 16
countries
Cynthia Schuck‑Paim1*, Elsa Negro‑Calduch1 & Wladimir J. Alonso2
Societal concern with the welfare of egg laying hens housed in conventional cages is fostering a
transition towards cage-free systems in many countries. However, although cage-free facilities
enable hens to move freely and express natural behaviours, concerns have also been raised over
the possibility that cage-free flocks experience higher mortality, potentially compromising some
aspects of their welfare. To investigate this possibility, we conducted a large meta-analysis of laying
hen mortality in conventional cages, furnished cages and cage-free aviaries using data from 6040
commercial flocks and 176 million hens from 16 countries. We show that except for conventional
cages, mortality gradually drops as experience with each system builds up: since 2000, each year
of experience with cage-free aviaries was associated with a 0.35–0.65% average drop in cumulative
mortality, with no differences in mortality between caged and cage-free systems in more recent years.
As management knowledge evolves and genetics are optimized, new producers transitioning to cage-
free housing may experience even faster rates of decline. Our results speak against the notion that
mortality is inherently higher in cage-free production and illustrate the importance of considering the
degree of maturity of production systems in any investigations of farm animal health, behaviour and
welfare.
Societal concern over the welfare of animals used in food production is on the rise, particularly with regard to
the most intensive forms of animal farming, such as those used in the production of eggs. Currently, there are
nearly the same number of egg laying hens alive (7.5 billion) as there are people on the planet1. The overwhelming
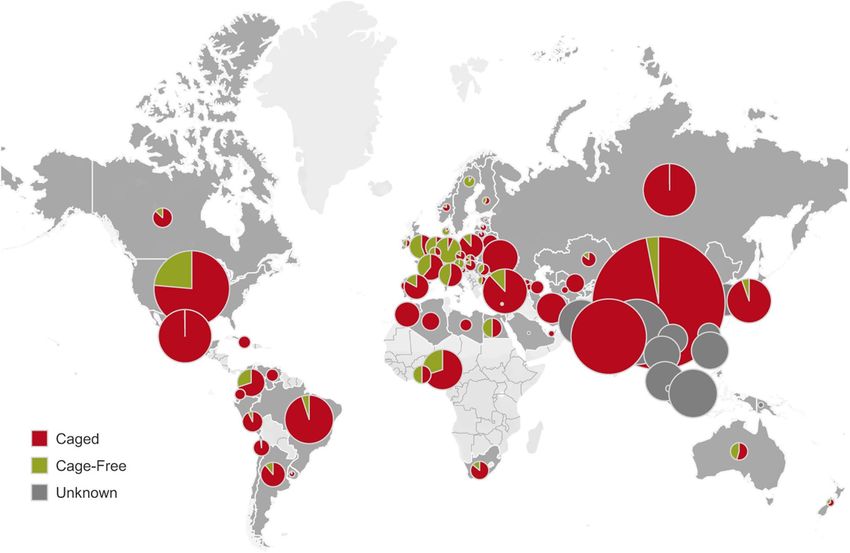
majority (Fig. 1) are still kept in conventional cages (also known as battery cages), a form of extreme confine-
ment that has been criticized for preventing individuals from moving freely, opening their wings and expressing
natural behaviours they have a strong drive to perform, such as nesting, foraging, perching and dust bathing2–4.
Over the last 2 decades, public attention to the welfare of laying hens is fostering a gradual transition away
from conventional cage systems, with an increase in the proportion of furnished cages (which provide hens with
some additional space, a nest, perch and a litter substrate) and cage-free systems in some countries, initially in the
European Union (EU Directive 1999/74/EC) and subsequently beyond Europe. For example, as of March 2020,
nearly 24% of all hens in the United States were raised in cage-free systems, up from 12% in 2016 and 4% in 20105.
Although cage-free facilities enable hens to move and express natural behaviours, concerns have also been
raised over observations of higher mortality rates in these s ystems6–9. Flock mortality rates have been considered
by some experts as one of the most important indicators of health for laying hens10, as higher death rates would
be suggestive of poorer health. While a solid understanding of the causes of death in different housing systems is
required to substantiate such a claim, should it be valid, it would imply that the health and welfare of egg-laying
hens could be partially compromised following transition to cage-free systems.
However, whether mortality rates are higher in cage-free systems is not yet clear. Information on mortality
is not systematically collated across the industry, and the very few reviews that have been conducted on the
topic7,11,12 have shown inconsistent results. Where differences in mortality across housing systems were f ound7,
they became nonsignificant when the confounding effect of beak trimming status was controlled (although
1
Cartagena, Spain. 2Epidemiology Research Group EPIDOT (Vice‑Leader); Public Health Department, Federal
University of Santa Catarina (UFSC), Santa Catarina, Brazil. *email: cynthia.schuck@gmail.com
Scientific Reports | (2021) 11:3052 | https://doi.org/10.1038/s41598-021-81868-3 1
Vol.:(0123456789)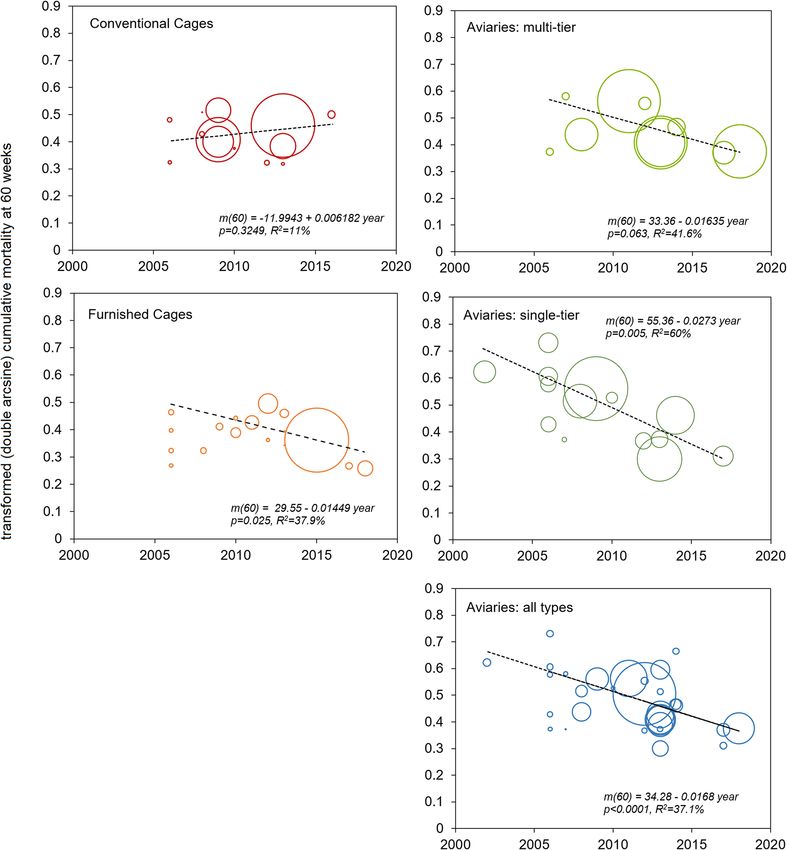
www.nature.com/scientificreports/
Figure 1. Global distribution of laying hens by housing system. Distribution of laying hens in caged (red:
conventional; furnished) and cage-free (green: barns, aviaries, free-range) systems in 78 countries (dark grey)
for which hen inventories are available. The size of circles is proportional to the hen population in the country.
Dark grey circles: countries for which the hen population is known, but the proportion of hens in each housing
system is unknown. An interactive version of this figure is available at http://hen-welfare.org/map, with further
information available (by clicking on the pie charts) on data sources, proportion of hens in each system and
layer populations. The map and graphic components were developed with the software Tableau Public, version
2020.3 (http://public.tableau.com).
beak trimming is a painful procedure with important negative effects on hen welfare13,14, its impact on reducing
mortality due to injurious pecking is well known15).
A critical factor in the comparison of farm animal health and welfare across production systems is the poten-
tial difference in their degree of technological maturity. It is reasonable to expect that newly adopted systems
will initially experience higher mortality due to lack of e xperience16, including the need to properly adapt diets,
lighting schemes, rearing and management practices, and the design of the housing structure itself. Additionally,
existing breeds might still be poorly adapted to cage-free systems, given decades of selection for caged environ-
ments. Appropriate comparisons would require managers, stock personnel and breeders having similar levels
of experience with the systems, yet in most comparisons of mortality this premise was either not f ulfilled6,17 or
information on the degree of experience with a system was not available. To determine if laying hen mortality
is inherently higher in a given production system, it is paramount to consider whether and how it changes as
producers acquire experience with it. However, we are not aware of previous research on this topic.
We conducted a review and meta-analysis of existing evidence on laying hen mortality in commercial flocks
raised in cage and indoor cage-free systems. To this end, we use data from 16 countries, 6040 flocks and over 176
million hens, making it the largest quantitative synthesis of commercial data on laying hen mortality to date. We
focus on conventional cages, furnished cages and indoor aviary systems (single-tier and multi-tier), considered
by the industry as the preferred cage-free alternative for large scale egg production. Next, we investigate the
presence of temporal trends in laying hen mortality during the period from 2000 through 2020 in each of the
housing systems studied.
Results
Search results and characteristics of the data sources. A flowchart of the process of identification
and selection of data sources is summarized in Fig. 2. Briefly, 3740 records of potentially eligible data sources
were screened. Of these, 3614 were excluded for not meeting the pre-established inclusion criteria in the title and
abstract screening stage, and 130 full-text articles and data sources were assessed for eligibility. At the full-text
screening stage, 101 articles were excluded for various reasons, detailed in Fig. 2.
Scientific Reports | (2021) 11:3052 | https://doi.org/10.1038/s41598-021-81868-3 2
Vol:.(1234567890)www.nature.com/scientificreports/
Figure 2. Flow diagram of selection process. Screening was conducted with the software JabRef version
5.0 (https://www.jabref.org). *A list with the reason for exclusion for each of the full-text papers screened is
provided in the Supplementary Table S1.
Overall, information from 29 data sources was included in the review, of which four datasets (Supplementary
Table S2: FRA_16, NOR_18, URY_16, USA_13) correspond to survey data on layer mortality obtained from
official sources or directly from authors. The data set covers 6040 flocks, with ~ 176 million hens observed from
2000 to 2019 in 16 countries. Of these, 4407 flocks were caged (3066 and 1341 in conventional and furnished
cages, respectively), and 1633 flocks were in indoor cage-free systems: 412 and 290 in multi-tier and single-tier
aviaries, respectively, and 931 flocks for which the type of aviary (single- or multi-tier) was not specified. The
detailed description of the data sources included in the meta-analyses is summarized in Supplementary Table S2
and the supplementary data file (https: //osf.io/r5f6c) . Breed information was available for 14% of the flocks, with
mortality figures often reported aggregated for multiple breeds. Of the flocks for which information on beak
trimming status was available (3068), hens were mostly beak trimmed (84%), with approximately half of the
flocks with intact beaks being from Norway, where beak trimming was banned in 1974.
Mortality by housing system. Figure 3 shows cumulative mortality at 60 weeks for the cage and cage-free
housing systems, ordered by the mid-year of data collection. Wide variations in mortality were evident in each
housing system, with a noticeable trend towards lower mortality rates in more recent years in cage-free aviaries.
Accordingly, substantial levels of heterogeneity within each system were observed (large Cochran’s Q-values
with p < 0.01 and I2 > 99%), making it inappropriate to consider the pooled results.
The relationship between cumulative mortality and mid-year of data collection was thus explored in a meta-
regression model (IVhet; see methods) using the full data set. Except for conventional cages, mortality levels were
found to be progressively lower over the years for all housing systems (Fig. 4). A sensitivity analysis performed
with the subset of the data (Table 1) for which variance in mortality was described by the data source similarly
showed significant negative associations between mortality and year of data collection for all cage-free systems.
Similar results were also found by conducting the meta-regression with the random effects model (Table 1). In
an additional sensitivity analysis where we excluded those data sources for which we could not confirm that all
flocks were kept exclusively indoors (multi-tier: HEE_15, NOR_18, VST_18; single-tier: VST_18; undefined
aviary: USA_13), a similar pattern was observed, with significantly lower mortality in more recent years in
single-tier aviaries and furnished cages (Supplementary Fig. S1). In all cases, the linear model was the best fit-
ting regression model.
The association between cumulative mortality and additional pre-established risk factors for mortality (beak
trimming status15, feather c olour18,19 and flock s ize7) was also explored in uni- and multivariate analyses, shown
in Table 2. Beak trimming status, feather colour and flock size were not associated with mortality in univariate
analyses (i.e., not controlled for the year of data collection or the housing system). The effects of both year and
Scientific Reports | (2021) 11:3052 | https://doi.org/10.1038/s41598-021-81868-3 3
Vol.:(0123456789)www.nature.com/scientificreports/
Figure 3. Forest plot of mean cumulative mortality of commercial layer flocks (2000–2020). Cumulative
mortality at 60 weeks in different commercially managed indoor systems: conventional cages (CC), furnished
cages (FC), single-tier (ST) and multi-tier (MT) aviaries, ordered by the mid-year of data collection. Each square
represents individual estimates from each data source. Square sizes represent the weight derived from the meta-
analysis (see Methods). Pooled estimates (weighted averages) are represented by diamonds.
Scientific Reports | (2021) 11:3052 | https://doi.org/10.1038/s41598-021-81868-3 4
Vol:.(1234567890)www.nature.com/scientificreports/
Figure 4. Meta-regression of cumulative layer mortality as a function of data collection year. Cumulative layer
mortality at 60 weeks (m60, double arcsine transformed) in different commercially managed indoor housing
systems. Regression equations and statistical results are shown in each corresponding graph. Each circle
corresponds to one data source, with circle sizes representing the weights derived from the meta-analysis (see
Methods).
housing were, in turn, highly significantly. Thus, we explored the effects of the explanatory variables in a mul-
tivariate model, testing whether the effect of housing on mortality depended on the year of data collection, as
indicated in Fig. 4. As expected, a significant interaction between these two explanatory variables was observed,
thus we conducted separate multivariate analysis for each housing system (Table 2). Year of data collection
remained significantly associated with cumulative mortality in single-tier and all aviaries combined (the effect
of year ceased to be significant in multi-tier aviaries, possibly due to the very few error degrees of freedom
remaining in this case).
To further investigate the relationship between mortality and time in homogeneous time series data from
single, independent, data sources (hence unconfounded by regional differences in production practices or other
Scientific Reports | (2021) 11:3052 | https://doi.org/10.1038/s41598-021-81868-3 5
Vol.:(0123456789)www.nature.com/scientificreports/
Analysis Data sources Housing N (sources) Beta SE p value
CC 9 − .0305 .0569 .609
FC 11 − .0095 .021 .743
Excluded (lack of information on variance): ELS_06; FER_09;
(1) Subset of data: variance provided by data sources ST 11 − .0878 .0224 .004
GER_12; FUL_19; NOR_18; AGR_14; TAH_14
MT 7 − .0909 .0331 .041
AV 23 − .0767 .0145 .000
CC 13 − .0009 .0081 .905
FC 17 − .0044 .0053 .4184
(2) Results from the random effects model All data sources in Table S2 ST 14 − .0225 .0049 .0006
MT 10 − .0079 .0072 .3039
AV 30 − .0132 .0044 .0060
Table 1. Sensitivity Analyses. Meta-regression analyses of cumulative laying hen mortality in different
commercially managed indoor housing systems as a function of mid-year of data collection using different
meta-analytical models and subsets of the data. Source codes are described in the Supplementary Table S2. CC
conventional cages, FC furnished cages, ST single-tier aviaries, MT multi-tier aviaries, AV indoor aviary (all
types).
factors that may differ across data sources), we analysed the surveys from (1) the Technical Institute for Poultry
in France (ITAVI), from which data on cumulative hen mortality over a period of sixteen years (2002–2016) were
available (data source FRA_16), and (2) from Agrovision (AGR_14), as reported by Leenstra and c ollaborators20,
for which data for commercial flocks in the Netherlands was reported for five consecutive years (2009–2013).
For both France and the Netherlands, no temporal trends in mortality were detected for caged systems, but there
was a highly significant drop in mortality over this period in the cage-free aviaries, with year of data collection
accounting for 73% and 58% of the variability in mortality reported in the two countries, respectively (Fig. 5).
Table 3 describes the mean percent reduction in mortality per year based both on the meta-regression results
and the regression analysis of the time series data from individual data sources. The results indicate an average
decline in mortality of approximately 0.35–0.65% per year in the cage-free aviaries. These results indicate that it
is inappropriate to pool evolving mortality data from far apart years. Thus, for each housing system, we restricted
the meta-analyses to the five most recent data sources available, providing a window to reduce temporal vari-
ation while avoiding significant error by including outdated figures. Pooled mortality estimates are shown in
Fig. 6 for each housing system—no significant differences among systems were observed (F3,16 = 0.77, p = 0.525).
Discussion
Our results provide analytical confirmation for the expectation that mortality should gradually drop following
the transition to new housing systems and speak against the notion that mortality is inherently higher in cage-
free production. Using multiple data sources from several countries, we have shown that while flock mortality
in conventional cages seems to have reached a plateau, each new year of experience with an indoor cage-free
system has been associated with a 0.4–0.6% average drop in mortality (or 4–6% over a decade).
The observation of a robust and strong association between layer mortality and the degree of maturity of the
production system was consistently replicated with different meta-analytic models and in different sensitivity
analyses, and further validated with two independent datasets (Fig. 5), where a strong and significant decline of
mortality in cage-free aviaries, within the same country, was observed over time. These results also find support
in various prior observations. For example, in a survey of Flemish farmers, mortality at 65 weeks was significantly
higher in newly introduced furnished cages (5.8%) than in single-tier aviaries (2.5%), when experience with
furnished cages was of 4 years compared to ten years for aviaries21. Leenstra et al20 also report data showing a
decrease in mortality among hens housed in aviaries and organically in Switzerland, France and the Netherlands,
with mortality dropping to levels comparable to other traditional systems over the years. The same pattern was
observed in Norway, where mortality at 60 weeks dropped from 10.3% in 2003 to 3.3% in 2010 in free-range
aviaries22 (online supplement: hen-welfare.org/time-series). Similarly, higher mortality rates, above 10%, were
typical of conventional cages in the past23,24.
For decades, industrial cage systems have been adjusted to reduce losses caused by the death of productive
individuals, and it is natural that newly adopted housing systems follow the same path. Not only is there a direct
financial incentive to reduce mortality, but risk factors for mortality in cage-free systems (such as new pathogen
challenges and exposure to injurious pecking) can be managed if producers can acquire the experience needed
to run cage-free systems successfully. For example, fifteen years after battery cages were banned in Switzerland,
infectious diseases frequently encountered in other countries were mostly absent in Swiss flocks due to the
development of proper hygiene protocols and vaccination programs25. Similarly, the adoption of preventive
strategies against feather pecking has been shown to significantly reduce levels of injurious pecking in aviaries26,27.
As knowledge on practices evolves, housing design improves and genetics are progressively optimized for loose
housing facilities28, new producers transitioning to these systems may experience even faster rates of decline in
mortality than those reported here. Conversely, less steep reduction rates may be observed in those countries
and regions (other than western Europe and North America, where most of the data reported here originates)
Scientific Reports | (2021) 11:3052 | https://doi.org/10.1038/s41598-021-81868-3 6
Vol:.(1234567890)www.nature.com/scientificreports/
Independent variable F-value df p value
Univariate analysis
BT status (I,T,U) 0.57 (2,57) 0.571
BT status (I,T) [excludes sources where BT = U] 0.00 (1,38) 0.975
Feather colour (B,W,U) 0.28 (2,57) 0.759
Feather colour (B,W) [excludes sources where FC = U] 0.44 (1,22) 0.515
Flock size (log) 0.96 (1,58) 0.332
Year 6.15 (1,58) 0.016
housing (CC, FC, MT, ST, AV) **[FC < MT] 3.98 (4,55) 0.007
Multivariate analysis
BT status (I,T,U) 1.83 (2,45) 0.172
Feather colour (B,W,U) 0.13 (2,45) 0.878
Flock size (log) 0.30 (1,45) 0.585
All housing systems
Year 1.15 (1,45) 0.290
Housing (CC, FC, MT, ST, AV) **[FC < MT] 2.68 (4,45) 0.044
Year * housing 2.67 (4,45) 0.044
(1) Conventional BT status (I,T,U) 0.42 (2,6) 0.674
Feather colour (B,W,U) 1.36 (2,6) 0.326
Cage flocks Flock size (log) 0.42 (1,6) 0.539
Year 0.24 (1,6) 0.639
(2) Furnished BT status (I,T,U) **[U > I;T] 4.68 (2,9) 0.040
Feather colour (B,W,U) 0.50 (2,9) 0.621
Cage flocks Flock size (log) 0.13 (1,9) 0.729
Year 0.17 (1,9) 0.693
(3) Multi-tier BT status (I,T,U) 0.01 (2,3) 0.995
Feather colour (B,W,U) 0.18 (2,3) 0.847
Aviary flocks Flock size (log) 0.67 (1,3) 0.474
Year 0.01 (1,3) 0.995
(4) Single-tier BT status (I,T,U) 3.69 (2,8) 0.073
Feather colour (B,W,U) 2.14 (1,8) 0.182
Aviary flocks Flock size (log) 0.54 (1,8) 0.483
Year 16.67 (1,8) 0.004
(5) All aviary flocks BT status (I,T,U) 1.00 (2,23) 0.384
Feather colour (B,W,U) 0.11 (2,23) 0.893
(ST, MT, AV) Flock size (log) 0.21 (1,23) 0.653
Year 8.68 (1,23) 0.007
Table 2. Univariate and multivariate analyses on the effect of beak trimming (BT) status, feather colour, flock
size, mid-year of data collection (year) and (indoor) housing system on cumulative layer mortality at 60 weeks
(double arcsine transformed). I intact beaks, T trimmed beaks, W white hybrids, B brown hybrids, U unknown
beak status or feather colour, CC conventional cages, FC furnished cages, MT multi-tier aviary flocks, ST
single-tier aviary flocks, AV unspecified aviary type. **Tukey pairwise comparisons for categorical factors.
that lack the financial and human resources needed for the dissemination of knowledge, proper training and
the implementation of best practices.
When compared over a recent period, differences in mortality among caged and cage-free systems were
no longer evident, with average figures ranging from 3 to 5% at 60 weeks (Fig. 6). These figures are, however,
limited by the low availability of data to control for putative differences in the prevalence of brown and white
hybrids among the housing systems, as for most data sources there was either no information on the breeds
investigated or mortality figures were averaged for multiple breeds. Because brown hybrids may experience higher
mortality18,19, differences in mortality across systems might be affected by the extent to which their prevalence
differed across the systems. Additionally, the analysis of a more recent period does not ensure that the maturity
of the systems in this recent data set was comparable. Considering that cage-free facilities are likely to have more
room for progress, and that brown-feathered genotypes are more common in cage-free systems, it is possible
that mortality in cage-free systems drops further when these two factors are taken into account. Nevertheless, it
is not possible to rule out the possibility that mortality is underreported in cage-free houses, as it is likely more
difficult to identify and capture dead birds in these f acilities16.
One could also argue that cage-free hens experience higher mortality at ages older than 60 weeks, as suggested
by observations that cage-free flocks tend to be depopulated e arlier21. However, evidence indicating a higher
mortality at older ages as a key driver of earlier depopulation is not strong. For example, in the United States,
Scientific Reports | (2021) 11:3052 | https://doi.org/10.1038/s41598-021-81868-3 7
Vol.:(0123456789)www.nature.com/scientificreports/
0.8
Conventional Furnished Cage-free aviary
transformed cumulative mortaity
0.7
m(60) = 26.7 - 0.01297 yr
pwww.nature.com/scientificreports/
Figure 6. Pooled estimates of cumulative layer mortality in recent years. Pooled estimates of cumulative layer
mortality at 60 weeks (95% CI) using the five most recent data sources for each commercially managed indoor
housing system (conventional cages, furnished cages, single-tier aviaries, multi-tier aviaries and all types of
aviaries). Years of data collection are shown below each housing system (f: number of flocks; h = number of
hens).
sources of heterogeneity (such as beak trimming and breed) were not reported by many data sources, limiting
the extent to which their effects could be properly analysed. Also, precise information on sample sizes, variances
or the raw (disaggregated) data (from individual flocks) enabling their calculation was missing in many cases.
Although sensitivity analyses restricted to a subset of data for which this information was available confirmed
our findings, these observations highlight the benefits that could be accrued by more comprehensive reporting.
Incentives for the publication of (already collected) anonymized data from commercial farms (e.g. by breeding
companies) should greatly help establish the evolution of the industry and provide insights into effective strate-
gies to improve layer welfare.
Despite our observation of comparable mortality in different housing systems, a solid understanding of vari-
ations in the causes of death across systems is also essential if meaningful associations between mortality and
health or welfare are to be suggested. Even if a system were associated with longer survival or lower mortality,
it would not necessarily indicate better health or welfare. For example, health conditions producing weakness,
lethargy, or reduced movement are likely prolonged over longer periods in cage systems, as no displacement is
needed for sick or critically ill individuals to keep eating and drinking, and energy expenditure is lower. This
allows for a lower mortality, but a higher prevalence of morbid individuals. Additionally, mortality fails to capture
the impact of nonfatal outcomes of disease, injury and deprivations on welfare. Put simply, what makes animals
suffer is not necessarily what kills them. Finally, the loss of welfare imposed by fatal outcomes also depends on
their nature. For example, deaths due to painful reproductive disorders and infectious diseases are possibly associ-
ated with individuals in states of poor welfare in the flock. Conversely, in cases such as predation and accidents,
animals in good health can become fatalities. We can illustrate this phenomenon with a well understood example
from humans: children who never play outdoors are less prone to injuries and fatal accidents, but it does not
mean that they are healthier or happier. However, systematic research on the causes of normal hen mortality in
different commercial systems, based on random samples of dead birds, is s cant6,9,32,33 and likely confounded by
the effects discussed here. Future research should address this gap.
Our findings also have important implications in other areas of animal welfare science. Specifically, the
demonstration that the degree of maturity and experience with a system acts as a major confounder in analyses
of mortality suggests that other comparisons of health, behaviour and welfare across systems may be similarly
affected by this factor. The interpretation of the literature in these other areas, including results obtained in
experimental settings, should take this possibility into account.
Methods
Search strategy. We identified potentially eligible data sources using several methods. First, we searched
Web of Science (Core collection) for relevant studies from 2000 until 2020 using the following topic search strat-
egy: (“laying hen” OR layer) AND (aviar* OR cage* OR housing OR barn) AND (mortality OR death OR per-
formance OR survival OR productivity OR welfare) (Supplementary Table S3). Given the nature of the research
question and data (commercial data on cumulative layer mortality), a comprehensive search of the grey literature
(articles not formally published by commercial academic publishers) and data from surveys (e.g. governmental
surveys of commercial farms) was also required. To this end, we complemented the search with Google Scholar
(GS) to increase coverage given its high sensitivity, using the same search terms and range of dates (GS restricts
the results to the first 1000 records r etrieved34). In addition, bibliographies of key articles and reviews were hand
searched. Articles in English, Spanish, Portuguese and French were considered in this screening process. We
also searched the websites of the Agriculture and Statistics departments of English-, Spanish-, Portuguese- and
Scientific Reports | (2021) 11:3052 | https://doi.org/10.1038/s41598-021-81868-3 9
Vol.:(0123456789)www.nature.com/scientificreports/
French-speaking countries for unpublished data sources and surveys. The Meta-analysis Of Observational Stud-
ies in Epidemiology (MOOSE) statement35 was used to guide reporting.
Selection criteria. Identified data sources, whether articles or survey data, had to meet all of the following
criteria to be included: (1) report cumulative mortality (from the year 2000 onwards) and the corresponding age
of the flock, or data (e.g., weekly, monthly mortality) enabling the calculation of cumulative mortality at specific
ages; (2) report data from commercial flocks (defined as commercial facilities managed by stock personnel,
hence excluding research stations and facilities operated exclusively by researchers) with at least 1000 hens; (3)
specify (or enable the estimation of) the year of data collection; (4) for data sources reporting aggregate mortality
for multiple flocks, report sample size (number of hens and flocks) or data enabling its estimation and (5) report
mortality disaggregated by housing system, including at least one of the following housing systems, defined as in
Weeks et al7: conventional cages, furnished (enriched) cages, multi-tier aviaries (a house where birds have access
to several tiers, litter at the ground level, and perches and nests on one or more of the other tiers); and single-
tier aviaries (or barns), representing a house with litter at the ground level and other resources on a raised area.
Study selection, data extraction and processing. An initial screening stage was conducted by read-
ing the title and summary of each of the potentially eligible data sources retrieved with the software JabRef ver-
sion 5.036. Studies that clearly did not meet the inclusion criteria were eliminated at this stage. In other cases, or if
not enough information was provided on the summary, the data source was passed on to the next round. Along
with cross-references, a total of 130 full papers and data sources were analysed, and data from eligible studies
extracted by means of a standardized protocol. In an effort to include more studies for which critical information
was missing, we contacted the authors for clarification. All screening and data extraction stages were conducted
independently by two co-authors (CSP and ENC). Where disagreements existed, the co-authors reviewed the
articles once more and discussed the discrepancy until a consensus was reached. Discrepancies were few and
predominantly the result of missing information on articles, resolved in most cases by contacting the authors of
the articles for further clarification. Adjudication by a third reviewer was planned but not necessary.
For each data source, we identified one or more cohorts of animals, where a cohort is defined as the largest
group of animals from a housing system for which the necessary data meeting the inclusion criteria were avail-
able. For each cohort, the following variables were extracted: data source information, country, housing system,
year(s) of data collection, population characteristics (breed, beak trim status), sample size (number of hens,
flocks, farms), flock size, cumulative mortality, variance (if summary measures of mortality were provided) and
age (in weeks) for which cumulative mortality was reported. Other variables descriptive of housing conditions
were also collected if available, including years of experience with the system, mean density (animals/m2), animals
per cage, rearing system, presence or prevalence of molting and mean light intensity (lux). Where quantitative
information was only available in charts, we used WebPlotDigitizer version 4.2 for data e xtraction37.
While most data sources reported only summary measures, namely mean mortality figures for multiple flocks,
some reported mortality data for each individual flock. In such cases, we calculated the average and standard
error of mortality for the flocks of each housing system (data from free-range or organic flocks were excluded),
provided the data were restricted to a period of three or fewer years and the flocks did not mix laying hens with
different beak statuses and feather colours. In the few cases where the same data source reported mortality for
multiple years (e.g., AGR_14, FRA_16; Supplementary Table S2), we considered the last three years of data avail-
able. Where data sources provided data on mean mortality for multiple flocks and the range of mortality observed
(minimum and maximum values), but no measure of variance in mortality across flocks, standard errors were
calculated from the range using the method of Hozo and c ollaborators38.
Age standardization. Because cumulative mortality increases with flock age, and different data sources
report mortality at different ages, mortality figures were standardized, where appropriate, to reflect mortality
at 60 weeks. The threshold of 60 weeks was chosen not only because it was the predominant reporting age, but
also because mortality at a later age is likely to be confounded by differences among systems in the prevalence
of induced molting, which is still a widespread practice in countries outside the United Kingdom and European
Union and usually occurs between 65 and 70 weeks29–31.
Where mortality was reported at different (predominantly later) ages, age adjustment was conducted by
determining the average weekly mortality for the specific flocks from the laying onset until the age for which
mortality was reported, so that weekly mortality = reported mortality/(reporting week − laying onset week). Next,
a linear transformation was employed to determine mortality at 60 weeks by multiplying the average weekly
mortality by the number of laying weeks (60—laying onset week). A linear model was chosen for its good fit
with the mortality data, particularly at later ages, shown in studies that followed mortality over t ime17,39–41. This
procedure provides a better approximation than that obtained with the use of regression coefficients (relating
mortality and flock age across multiple data sources), as the proportion of variance that remains unexplained
by such a regression is high given the many differences in risk factors for mortality (e.g., breed, management
practices, beak trim status, flock size, lighting conditions) across sources. Conversely, age adjustments based on
a population’s own weekly mortality are not confounded by these effects.
Data analysis. The primary outcome was cumulative layer mortality at 60 weeks. To obtain a quantitative
synthesis of the mortality estimates, age-standardized mortality was pooled through a meta-analysis. In meta-
analysis, a weighted average is obtained to summarize the magnitude of the variable measured through a set of
primary data sources. The weight assigned to each estimate is often set proportional to the inverse of its variance,
so larger studies with more precise estimates have more weight and smaller, noisier studies have less weight. It is
Scientific Reports | (2021) 11:3052 | https://doi.org/10.1038/s41598-021-81868-3 10
Vol:.(1234567890)www.nature.com/scientificreports/
well established, however, that the calculated precision of meta-analytic findings using the fixed effects model is
overstated in the presence of h eterogeneity42,43 (as expected in the present case, given the multiple factors affect-
ing layer mortality). Because error estimation and coverage also remain inadequate with currently utilized ran-
dom effects (RE) models44–47, we chose to use as our main analytic approach a meta-analytic model that solves
odel46. The IVhet model has been shown to be an improved alternative to the RE model,
this issue, the IVhet m
giving larger weights to studies with larger samples and providing more conservative confidence intervals46,
effectively solving the problem of error estimation as demonstrated in simulation studies48. The results of the RE
model are reported for comparison.
Because some data sources did not report variance in mortality across the flocks studied (nor provided the
raw data enabling its calculation), we conducted a typical meta-analysis of prevalence (mortality, expressed
in proportion), having the total number of hens (N) of each data source as its population size, and variance
calculated using the binomial equation p(1 − p)/N49. Where the total number of hens was not described, it was
estimated as the product between the number of flocks and the mean flock size for the housing system (as given
by the data source or, if unavailable, as the average for the housing system in the country or region). Mortality was
transformed using the double arcsine square root transformation to stabilize the variance across data sources49.
Heterogeneity was evaluated by Cochrane Q and I2 statistical methods.
Meta-regressions were conducted to investigate potential trends in mortality over time. Robust standard
errors were used to allow for correct error estimation. Additionally, where data sources allowed, we examined
whether mortality was affected by the following moderator variables, defined a priori: beak trim status (BT), flock
size and hybrid colour (brown, white feathered birds), where BT and hybrid colour were defined as categorical
(fixed effects) variables, and flock size and year of data collection as continuous variables. Hybrid colour was
used instead of breed since the size of the sample for each breed was insufficient to enable its inclusion as a fac-
tor in the analyses. Similarly, because most data sources provided aggregated information about multiple flocks,
the analysis of factors that tend to be highly specific to individual flocks, such as the size of subunits (or pens)
in multi-tier aviary systems, was not possible.
Where datasets included mortality data for multiple years, we also investigated temporal trends in cumu-
lative mortality within each data source. To this end, we fitted a regression model having the (double arcsine
square root) transformed mortality estimates as the dependent variable, and mid-year of data collection as the
independent variable. For ease of interpretation, results were back-transformed to natural p roportions49. Pooled
analyses were conducted using MetaXL version 4.3 (EpiGear International, Queensland, Australia)50, and the
meta-regression models were run using Stata SE version 14 (Stata Corp, College Station, TX).
Data availability
Data is available at https://osf.io/r5f6c.
Received: 23 June 2020; Accepted: 13 January 2021
References
1. FAO. Livestock Primary. FAOSTAT http://www.fao.org/faostat/en/#data/QL (2018). Accessed 22 April 2020.
2. Weeks, C. A. & Nicol, C. J. Behavioural needs, priorities and preferences of laying hens. Worlds Poult. Sci. J. 62, 296–307 (2006).
3. Blokhuis, H. J. et al. The LayWel project: welfare implications of changes in production systems for laying hens. Worlds Poult. Sci.
J. 63, 101–114 (2007).
4. Blokhuis, H. et al. Welfare aspects of various systems of keeping laying hens. EFSA J. 197, 1–23 (2005).
5. UEP. Facts & Stats - United Egg Producers. United Egg Producers https: //united egg.com/facts- stats/ (2019). Accessed 22 April 2020.
6. Fulton, R. M. Health of commercial egg laying chickens in different housing systems. Avian Dis. 63, 420–426 (2019).
7. Weeks, C. A., Lambton, S. L. & Williams, A. G. Implications for welfare, productivity and sustainability of the variation in reported
levels of mortality for laying hen flocks kept in different housing systems: a meta-analysis of ten studies. PLoS ONE 11, e0146394
(2016).
8. Lay, D. C. Jr. et al. Hen welfare in different housing systems. Poult. Sci. 90, 278–294 (2011).
9. Kajlich, A. S. et al. Incidence, severity, and welfare implications of lesions observed postmortem in laying hens from commercial
noncage farms in California and Iowa. Avian Dis. 60, 8–15 (2016).
10. Rodenburg, T. B. et al. Welfare assessment of laying hens in furnished cages and non-cage systems: assimilating expert opinion.
Anim. Welf. 17, 355–361 (2008).
11. Aerni, V., Brinkhof, M. W. G., Wechsler, B., Oester, H. & Fröhlich, E. Productivity and mortality of laying hens in aviaries: a sys-
tematic review. Worlds Poult. Sci. J. 61, 130–142 (2005).
12. Freire, R. & Cowling, A. The welfare of laying hens in conventional cages and alternative systems: first steps towards a quantitative
comparison. Anim. Welf. 22, 57–65 (2013).
13. Gentle, M. J. Pain issues in poultry. Appl. Anim. Behav. Sci. 135, 252–258 (2011).
14. Marchant-Forde, R. M., Fahey, A. G. & Cheng, H. W. Comparative effects of infrared and one-third hot-blade trimming on beak
topography, behavior, and growth. Poult. Sci. 87, 1474–1483 (2008).
15. Riber, A. B. & Hinrichsen, L. K. Welfare consequences of omitting beak trimming in barn layers. Front. Vet. Sci. 4, 222 (2017).
16. Cotra, A. How will hen welfare be impacted by the transition to cage-free housing? https: //www.openph ilant hropy .org/focus/ us-polic
y/farm-animal-welfare/how-will-hen-welfare-be-impacted-transition-cage-free-housing (2017). Accessed 23 April 2020.
17. Karcher, D. M. et al. Impact of commercial housing systems and nutrient and energy intake on laying hen performance and egg
quality parameters. Poult. Sci. 94, 485–501 (2015).
18. Stratmann, A. et al. Soft perches in an aviary system reduce incidence of keel bone damage in laying hens. PLoS ONE 10, e0122568
(2015).
19. Weeks, C. A. & Nicol, C. J. Laywel: welfare implications of changes in production systems for laying hens. Deliverable 7.1 Overall
strengths and weaknesses of each defined housing system for laying hens, and detailing the overall welfare impact of each housing
system. https://www.laywel.eu (2007).
Scientific Reports | (2021) 11:3052 | https://doi.org/10.1038/s41598-021-81868-3 11
Vol.:(0123456789)www.nature.com/scientificreports/
20. Leenstra, F., Maurer, V., Galea, F. & Bestman, M. Laying hen performance in different production systems; why do they differ and
how to close the gap? Results of discussions with groups of farmers in The Netherlands, Switzerland and France, benchmarking
and model calculations. Eur. Poult. https://doi.org/10.1399/eps.2014.53 (2014).
21. Stadig, L. M. et al. Survey of egg farmers regarding the ban on conventional cages in the EU and their opinion of alternative layer
housing systems in Flanders, Belgium. Poult. Sci. 95, 715–725 (2016).
22. Schjøll, A., Borgen, S. O. & Alfnes, F. Consumer preference for animal welfare when buying eggs. National Institute for Consumer
Research Report 1–2013, (2013).
23. Randall, C. J. et al. A survey of mortality in 51 caged laying flocks. Avian Pathol. 6, 149–170 (1977).
24. Bell, D. The challenges of management for today’s high performing laying hens. Lohmann Inf. 46, 8–15 (2011).
25. Kaufmann-Bart, M. & Hoop, R. K. Diseases in chicks and laying hens during the first 12 years after battery cages were banned in
Switzerland. Vet. Rec. 164, 203–207 (2009).
26. Lambton, S. L. et al. A bespoke management package can reduce levels of injurious pecking in loose-housed laying hen flocks. Vet.
Rec. 172, 423 (2013).
27. Gilani, A.-M., Knowles, T. G. & Nicol, C. J. The effect of rearing environment on feather pecking in young and adult laying hens.
Appl. Anim. Behav. Sci. 148, 54–63 (2013).
28. Rodenburg, T. B., Bolhuis, J. E., Koopmanschap, R. E., Ellen, E. D. & Decuypere, E. Maternal care and selection for low mortality
affect post-stress corticosterone and peripheral serotonin in laying hens. Physiol. Behav. 98, 519–523 (2009).
29. USDA. Layers 2013 Part I: Reference of Health and Management Practices on Table-Egg Farms in the United States. https://www.
aphis.usda.gov/animal_health/nahms/poultr y/downloads/layers2013/Layers2013_dr_PartI.pdf (2014). Accessed 1 June 2020.
30. Bell, D. D. Historical and current molting practices in the U.S. table egg industry. Poult. Sci. 82, 965–970 (2003).
31. Anderson, K. E. Molting of laying hens: test results from North Carolina and implications for US and German egg producers.
LOHMANN Inf. 50, 12–17 (2016).
32. Fulton, R. M. Causes of normal mortality in commercial egg-laying chickens. Avian Dis. 61, 289–295 (2017).
33. Zloch, A., Kuchling, S., Hess, M. & Hess, C. Influence of alternative husbandry systems on postmortem findings and prevalence
of important bacteria and parasites in layers monitored from end of rearing until slaughter. Vet. Rec. 182, 350–350 (2018).
34. Haddaway, N. R., Collins, A. M., Coughlin, D. & Kirk, S. The role of Google Scholar in evidence reviews and its applicability to
grey literature searching. PLoS ONE 10, e0138237 (2015).
35. Stroup, D. F. et al. Meta-analysis of observational studies in epidemiology: a proposal for reporting. Meta-analysis of observational
studies in epidemiology (MOOSE) group. JAMA 283, 2008–2012 (2000).
36. JabRef. Bibliography Management. Graphical Java application for managing bibtex databases https://www.jabref.org/. Accessed 7
February 2020.
37. Rohatgi, A. WebPlotDigitizer - Extract data from plots, images, and maps. https://automeris.io/WebPlotDigitizer. Accessed 17
March 2020.
38. Hozo, S. P., Djulbegovic, B. & Hozo, I. Estimating the mean and variance from the median, range, and the size of a sample. BMC
Med. Res. Methodol. 5, 13 (2005).
39. Tauson, R. Furnished cages and aviaries: production and health. Worlds Poult. Sci. J. 58, 49–63 (2002).
40. Petrik, M. T., Guerin, M. T. & Widowski, T. M. On-farm comparison of keel fracture prevalence and other welfare indicators in
conventional cage and floor-housed laying hens in Ontario, Canada. Poult. Sci. 94, 579–585 (2015).
41. Elson, H. A. Poultry welfare in intensive and extensive production systems. Worlds Poult. Sci. J. 71, 449–460 (2015).
42. Schmidt, F. L., Oh, I.-S. & Hayes, T. L. Fixed- versus random-effects models in meta-analysis: model properties and an empirical
comparison of differences in results. Br. J. Math. Stat. Psychol. 62, 97–128 (2009).
43. Field, A. P. The problems in using fixed-effects models of meta-analysis on real-world data. Underst. Stat. 2, 105–124 (2003).
44. Noma, H. Confidence intervals for a random-effects meta-analysis based on Bartlett-type corrections. Stat. Med. 30, 3304–3312
(2011).
45. Brockwell, S. E. & Gordon, I. R. A comparison of statistical methods for meta-analysis. Stat. Med. 20, 825–840 (2001).
46. Doi, S. A. R., Barendregt, J. J., Khan, S., Thalib, L. & Williams, G. M. Advances in the meta-analysis of heterogeneous clinical trials
I: the inverse variance heterogeneity model. Contemp. Clin. Trials 45, 130–138 (2015).
47. Brockwell, S. E. & Gordon, I. R. A simple method for inference on an overall effect in meta-analysis. Stat. Med. 26, 4531–4543
(2007).
48. Doi, S. A. R. & Furuya-Kanamori, L. Selecting the best meta-analytic estimator for evidence-based practice: a simulation study.
Int. J. Evid. Based Healthc. 18, 86–94 (2020).
49. Barendregt, J. J., Doi, S. A., Lee, Y. Y., Norman, R. E. & Vos, T. Meta-analysis of prevalence. J. Epidemiol. Community Health 67,
974–978 (2013).
50. Barendregt, J. J. & Doi, S. A. MetaXL user guide. Version 4, 2011–2016 (2016).
Acknowledgements
We are grateful to Andrew Michael Janczak, Mateo Itza-Ortiz, Nienke van Staaveren, Harry Blokhuis, Werner
Bessei, Ian Rubinoff, Yi-Chun Lin, the National Animal Health Monitoring System (NAHMS, USDA) and the
Ministerio de Ganadería, Agricultura y Pesca (MGAP) of Uruguay, for contributing with input and data. Glenn
Coby also kindly provided the templates for the software Tableau (version 2020.3), from which the online visu-
alizations at http://www.hen-welfare.org were built.
Author contributions
CSP and WJA designed the study. CSP and ENC searched the literature, extracted and evaluated the data. CSP
analysed the data. CSP and WJA wrote the main manuscript. ENC revised the manuscript. All authors approved
the final version.
Competing interests
CSP and WJA broader research is supported by the Open Philanthropy Project, though it did not specifically
request this project or have any say over methods or results. ENC declares no competing interests.
Additional information
Supplementary Information The online version contains supplementary material available at https://doi.
org/10.1038/s41598-021-81868-3.
Correspondence and requests for materials should be addressed to C.S.-P.
Scientific Reports | (2021) 11:3052 | https://doi.org/10.1038/s41598-021-81868-3 12
Vol:.(1234567890)www.nature.com/scientificreports/
Reprints and permissions information is available at www.nature.com/reprints.
Publisher’s note Springer Nature remains neutral with regard to jurisdictional claims in published maps and
institutional affiliations.
Open Access This article is licensed under a Creative Commons Attribution 4.0 International
License, which permits use, sharing, adaptation, distribution and reproduction in any medium or
format, as long as you give appropriate credit to the original author(s) and the source, provide a link to the
Creative Commons licence, and indicate if changes were made. The images or other third party material in this
article are included in the article’s Creative Commons licence, unless indicated otherwise in a credit line to the
material. If material is not included in the article’s Creative Commons licence and your intended use is not
permitted by statutory regulation or exceeds the permitted use, you will need to obtain permission directly from
the copyright holder. To view a copy of this licence, visit http://creativecommons.org/licenses/by/4.0/.
© The Author(s) 2021
Scientific Reports | (2021) 11:3052 | https://doi.org/10.1038/s41598-021-81868-3 13
Vol.:(0123456789)You can also read