Leveraging Signatures of plant functional Strategies in Wood Density Profiles of African Trees to correct Mass estimations from terrestrial Laser Data
←
→
Page content transcription
If your browser does not render page correctly, please read the page content below
www.nature.com/scientificreports

            OPEN           Leveraging Signatures of Plant
                           Functional Strategies in Wood
                           Density Profiles of African Trees
                           to Correct Mass Estimations From
                           Terrestrial Laser Data
                           Stéphane Takoudjou Momo 1,2,15, Pierre Ploton 2,15, Olivier Martin-Ducup2,
                           Romain Lehnebach 3, Claire Fortunel 2, Le Bienfaiteur Takougoum Sagang 1,2,
                           Faustin Boyemba4, Pierre Couteron2, Adeline Fayolle 5, Moses Libalah 1, Joel Loumeto6,
                           Vincent Medjibe 7, Alfred Ngomanda8, Diosdado Obiang9, Raphaël Pélissier 2,
                           Vivien Rossi 1,7,11, Olga Yongo10, PREREDD Collaborators†, Bonaventure Sonké1 &,
                           Nicolas Barbier 2*
                           Wood density (WD) relates to important tree functions such as stem mechanics and resistance against
                           pathogens. This functional trait can exhibit high intraindividual variability both radially and vertically.
                           With the rise of LiDAR-based methodologies allowing nondestructive tree volume estimations, failing to
                           account for WD variations related to tree function and biomass investment strategies may lead to large
                           systematic bias in AGB estimations. Here, we use a unique destructive dataset from 822 trees belonging
                           to 51 phylogenetically dispersed tree species harvested across forest types in Central Africa to determine
                           vertical gradients in WD from the stump to the branch tips, how these gradients relate to regeneration
                           guilds and their implications for AGB estimations. We find that decreasing WD from the tree base to the
                           branch tips is characteristic of shade-tolerant species, while light-demanding and pioneer species exhibit
                           stationary or increasing vertical trends. Across all species, the WD range is narrower in tree crowns than
                           at the tree base, reflecting more similar physiological and mechanical constraints in the canopy. Vertical
                           gradients in WD induce significant bias (10%) in AGB estimates when using database-derived species-
                           average WD data. However, the correlation between the vertical gradients and basal WD allows the
                           derivation of general correction models. With the ongoing development of remote sensing products
                           providing 3D information for entire trees and forest stands, our findings indicate promising ways to
                           improve greenhouse gas accounting in tropical countries and advance our understanding of adaptive
                           strategies allowing trees to grow and survive in dense rainforests.

                           Terrestrial plants account for 83% of the living carbon on Earth1, of which tropical forests are estimated to
                           account for close to half2, principally contained within woody plant parts. Tropical forests are therefore becoming
                           a key element in international carbon trading schemes despite obvious difficulties in accurately estimating stocks

                           1
                             Plant Systematic and Ecology Laboratory (LaBosystE), Department of Biology, Higher Teachers’ Training College,
                           University of Yaoundé I, P.O. Box 047, Yaoundé, Cameroon. 2AMAP, Univ Montpellier, IRD, CNRS, INRAE, CIRAD,
                           Montpellier, France. 3UGent-Woodlab, Laboratory of Wood Technology, Department of Environment, Ghent
                           University, Coupure Links 653, B-, 9000, Gent, Belgium. 4University of Kisangani, Democratic Republic of Congo,
                           Kisangani, Republic of Congo. 5Gembloux Agro-Bio Tech, University of Liège, Gembloux, Belgium. 6University of
                           Marien Ngouabi, Brazzaville, Republic of Congo. 7Commission des Forêts d’Afrique Centrale (COMIFAC), Yaoundé,
                           BP, 20818, Cameroon. 8Institut de Recherche en Ecologie Tropicale (IRET/CENAREST), BP, 13354, Libreville, Gabon.
                           9
                            INDEFOR-AP, Malabo, Equatorial Guinea. 10University of Bangui, Bangui, Central African Republic. 11RU Forests and
                           Societies, CIRAD, Yaoundé, Cameroon. 15These authors contributed equally: Stéphane Takoudjou Momo and Pierre
                           Ploton. †A comprehensive list of consortium members appears at the end of the paper. *email: nicolas.barbier@ird.fr

Scientific Reports |   (2020) 10:2001 | https://doi.org/10.1038/s41598-020-58733-w                                                          1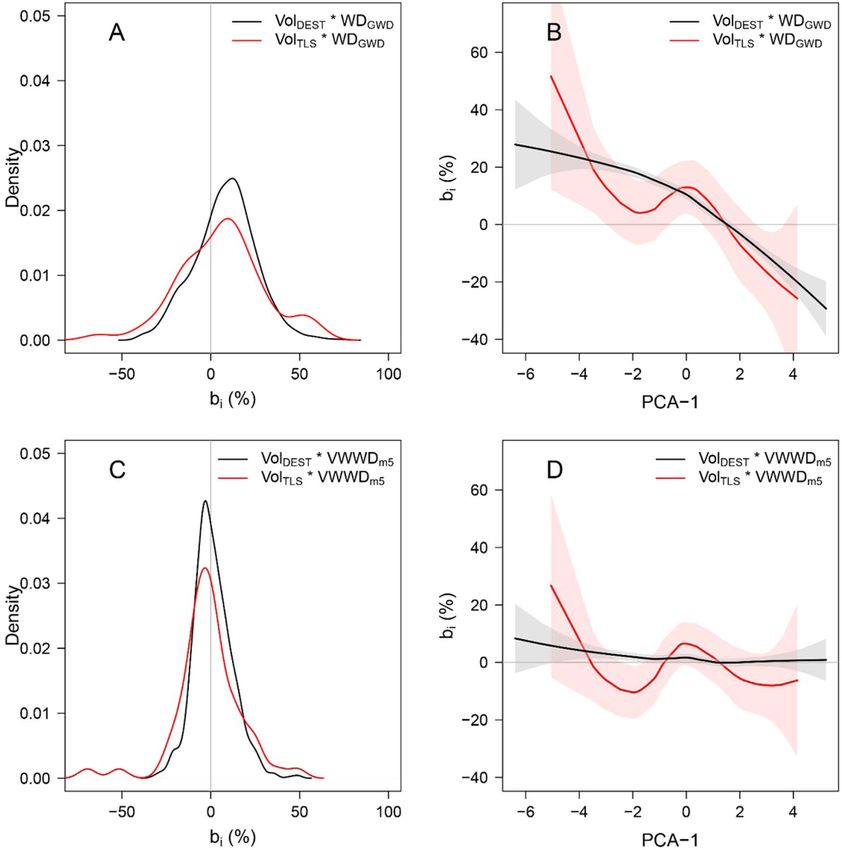
www.nature.com/scientificreports/ www.nature.com/scientificreports
and fluxes at relevant scales, e.g., at the stand, landscape or region level. Aboveground biomass (AGB) and the
associated carbon content are generally assessed indirectly via allometric models based on simple tree measure-
ments such as trunk diameter at breast height (DBH), total height or species average mean wood density values
obtained from global databases3. Allometric models are calibrated through destructive tree harvests requiring
enormous amounts of fieldwork to cut down and weigh every tree compartment. Despite the growing number
of studies aimed at calibrating allometric equations4–6, only a few thousand tropical trees have been sampled
for this purpose so far, including very few large trees despite their specific architecture7 and disproportionate
contribution to forest AGB8. This destructive method therefore offers limited promise for providing represent-
ative allometric equations for the estimated three trillion trees on Earth9. Terrestrial LiDAR scanning (TLS) has
recently emerged as a nondestructive method not only for calibrating allometric biomass models10,11 but also for
performing measurements of volume, and by conversion biomass, at the stand level9. TLS is now being promoted
by the Intergovernmental Panel on Climate Change (IPCC) in its Good Practice Guidelines (GPG) for national
greenhouse gas inventories, as tropical countries aim to implement more efficient and precise methodologies12.
However, as we gain in precision and sample size with TLS, which will provide massive datasets of detailed tree
volume data, there is also need for renewed care in using reliable WD values for the conversion of these volumes
into AGB.
Wood performs different functions in trees such as providing mechanical support and conducting and storing
water, nutrients and carbohydrates13. Wood-specific gravity (WSG, sensu14), or wood density (WD), has emerged
as a consensus integrative trait of diverse wood properties. It is positively correlated with mechanical strength
and stiffness15–17 and negatively correlated with water storage and capacitance18–20. WD mainly depends on the
proportion and morphology of fibers and to a lesser extent on the proportion of parenchyma cells and morphol-
ogy of vessels, which can vary between and within species and individuals13,21–25. With 10-fold variation across
tropical tree species13,26–28, WD has been shown to reflect differences in regeneration guild29–31: pioneers tend
to exhibit light wood associated with faster growth and a shorter lifespan, while shade-tolerant species invest in
dense wood associated with long-term resilience. In addition, WD varies within individual trees both radially
(from the pith to the bark) and vertically (from the stump to the crown top). WD radial gradients have been doc-
umented in several climatic zones, forest types and regeneration guilds28,32–38. While pioneer or light-demanding
species exhibit steep increasing radial gradients32, slight increasing or decreasing radial gradients are observed in
shade-tolerant species35,37. We may expect some similarities between radial and vertical patterns39 as wood is pro-
duced through the accumulation of cone-shaped volumes. Indeed, primary (vertical) growth precedes secondary
lateral growth, and outer wood will exhibit the same age as wood closer to the pith higher up along the trunk or
branch. However, there is currently little to no available information on the vertical variation in WD, particularly
in highly diverse tropical rainforests40–42.
In AGB estimates, WD values are typically extracted from databases documented using samples taken at the
tree base or from sawmill logs. These samples rarely if ever account for variation in WD within trees43. Since TLS
tree volume is directly multiplied by WD to obtain an AGB estimate, any bias in WD will be directly propagated
in AGB estimates (average 9% overestimation of AGB estimates at the scale of 1-ha forest stands using tree basal
WD, see Sagang et al.41). As it is logistically challenging to sample WD and its vertical variation for each tree dur-
ing forest inventories or LiDAR scanning campaigns, there is a critical need for a better understanding of vertical
variations in WD across a wide range of tree species to improve AGB estimates.
Here, we use a unique destructive dataset collating six sampling sites in different countries and contrasted
types of terra firme forests across the Congo basin5 to determine the vertical variation in WD among 822 indi-
viduals (sampled across size classes) representing a total of 51 tropical tree species; we examine possible evolutive
or functional drivers and implications for AGB estimation from volumetric (TLS) data; and we propose a way to
correct the aforementioned bias in a cost-efficient way.
Characterizing WD Vertical Profiles
We first compared the vertical variation in WD between 822 individual trees by determining WD in six compart-
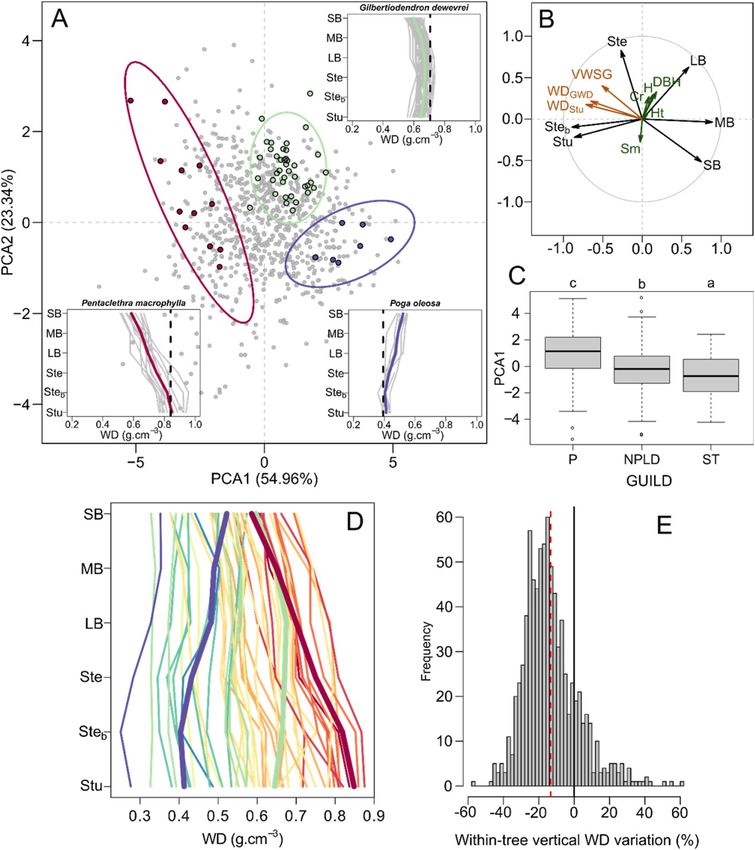
ments (stump: Stu, stem base: Steb, stem: Ste, large-: LB, medium-: MB and small-sized branches: SB, Fig. 1D).
The sample covered a broad range of WD values from 0.217 to 1.020 (Steb). As there are no strong assumptions
regarding the mathematical form of these variations, we used a scaled principal component analysis (PCA) to
evaluate relative vertical gradients in WD. Prior to the analyses, the WD values of each tree compartment were
normalized by the individual mean WD (Fig. 1A). The first PCA axis (PCA1, Fig. 1B) distinguished the tree base
(stump and stem base) from the tree crown (large-, medium- and small-size branches), while stem relative WD
was positively correlated with PCA2. Therefore, trees with negative scores on PCA1 exhibited a relatively high
stump WD (WDStu) and a decreasing WD toward the smallest branches (e.g., Pentaclethra macrophylla). With
increasing scores on PCA1, the relative vertical profile of WD became progressively convex (for high PCA2 val-
ues, e.g., Gilbertiodendron dewevrei) or constant (for low PCA2 values) and eventually increased toward the small
branches (e.g., Poga oleosa). For 83% of the sampled trees, WD was lower in the small branches than in the stump
by an average of −13.3%, with individual differences ranging within approximately ±60% (Fig. 1E). When aver-
aging gradients at the species level, a vertical decrease was observed in 88% of the species, with a range of ±30%.
Species PCA scores and other characteristics are summarized in Suppl. Table 1.
Identifying correlates of WD vertical profiles. The relative vertical profiles in WD were strongly corre-
lated with tree basal WD, with a significant correlation coefficient (r = −0.71) between individual PCA1 scores
and WDStu (Table 1 and Fig. S1A). This correlation was also observed at the species level using species-level WD
obtained from a Global Wood Density database13,44 (WDGWD, r = −0.65, Table 1 and Fig. S1B). This relationship
is similar to that previously reported by Hietz et al.37 in the case of radial WD gradients [Panamanian moist
forest and Ecuadorian rain forest, 304 species] and Sagang et al.41 for vertical gradients [semideciduous forest of
Scientific Reports | (2020) 10:2001 | https://doi.org/10.1038/s41598-020-58733-w 2www.nature.com/scientificreports/ www.nature.com/scientificreports
Figure 1. Ordination of wood density (WD) vertical profiles based on principal component analysis. Panel A:
Scatter plot of PCA scores on the first two principal axes. Insets showing vertical WD profiles are highlighted
for three contrasting species, with vertical dashed lines representing species mean WD derived from the Global
Wood Density database. Panel B: Correlations between the WD of each tree compartment (black arrows)
and the first two PCA axes. Supplementary variables related to wood density and tree structure are plotted in
maroon and dark green, respectively (see Table 1 for acronyms and definitions). The histogram of eigenvalues
is provided in Fig. S1. Panel C: Boxplot of PCA1 scores of individual trees by life strategy guild (pioneer: P,
nonpioneer light-demanding: NPLD and shade tolerant: ST). The post hoc Tukey’s HSD test is indicated
(p-value < 0.01, see Table S2 for details). Panel D: Species mean WD by tree compartment. The warm-to-cold
color gradient represents the species mean PCA1 score. The three focal species from panel A are shown with
thicker lines. Panel E: Histogram of tree WD differences between the small branches and the stump as the
percent of the stump WD (n = 822). The dashed red vertical line represents the distribution mean.
Cameroon, 15 species]. We observed a shift in the vertical WD profile from decreasing (negative PCA1 scores)
to increasing (positive PCA1 scores) as species WDGWD decreased (vertical dashed lines in insets in Fig. 1A). The
second PCA axis was correlated with tree structure variables (Table 1, Fig. 1B). We leveraged these correlations to
derive models allowing us to predict and account for vertical WD gradients (see Table 2).
Taxonomic, geographical and functional grouping. Using PCA scores to describe the relative ver-
tical profiles in the WD of individual trees, we examined whether these profiles were clustered taxonomically,
geographically or functionally. This is indeed of fundamental importance to understand the possible adaptive
Scientific Reports | (2020) 10:2001 | https://doi.org/10.1038/s41598-020-58733-w 3www.nature.com/scientificreports/ www.nature.com/scientificreports
Parameter Definition PCA1 PCA2
WDStu WD of the stump compartment −0.71 (***) 0.17 (***)
WDGWD Species average WD derived from the Global Wood Density database −0.65 (***) 0.23 (***)
VWWD Volume-weighted tree wood specific gravity −0.51 (***) 0.4 (***)
DBH Diameter at breast height 0.17 (***) 0.32 (***)
H Total height 0.08 (*) 0.27 (***)
Ht Trunk height 0.06 (ns) 0.05 (ns)
Cr Crown radius 0.13 (***) 0.29 (***)
Sm Stem morphology, defined as the ratio of trunk height over tree height −0.07 (ns) −0.24 (***)
Table 1. Tree wood and structure parameters used as supplementary variables in the principal component
analysis (PCA) and their correlations with the first two PCA axes. The probability values of Pearson
correlation (r) tests are provided between brackets and coded as follows: ***P ≤ 0.001, **P ≤ 0.01, *P ≤ 0.05,
ns = nonsignificant.
meaning of the profiles as well as their effect on AGB estimation bias at the stand or regional level (if similar pro-
files tend to be clustered at these scales).
Individual trees from the same species showed consistent relative vertical profiles in WD. For instance, 81.1%
of trees exhibited the same sign along PCA1 as their species average. Similarly, 88% of the individuals presented
the same sign as their species average for the difference between the tree stump and small branches. Our data-
set includes only two genera with more than one sampled species, so we could not evaluate profile aggregation
at the genus level. However, we found clear taxonomic overdispersion of tree PCA1 scores at the family level
(KBlomberg = 0.132, P = 0.014, see methods), suggesting less similarity than expected by chance at the family (i.e.,
strong interfamily variation) or higher taxonomic level. This finding is consistent with the phylogenetic aggrega-
tion patterns reported for WD, with decreasing similarity in WD from species to genus and low similarity in WD
at the family level26,45.
The tree sampling site had little influence on the relative vertical profile in WD. We used ANOVA to partition
the variance of tree PCA1 scores between species, sampling sites and their interaction. Since many species were
found at one or two sampling sites only (28 and 14 species, respectively), we restricted the analysis to species
found in at least three sites (representing a total of 330 trees from 9 species). The species effect captured 44% of
the variance (F = 32.12, P < 0.001), but both the main site effect (1.8% of the variance, F = 2.20, P = 0.056) and
its interaction with species (5.9% of the variance, F = 60.6, P = 0.056) were non-significant. In other words, the
interspecific variation in WD vertical profiles is much greater than the site effect on a given species’ profile.
At the community level, the abundance of decreasing, stable and increasing profiles within the community is
likely to change over broad regional extents given the known patterns of mean (community-level) WD variation13.
The mean community vertical WD profile will also vary at the landscape scale following the history of forest per-
turbations. Grouping species into (a priori) regeneration guilds46 (Suppl. Table 1) indeed distinguished pioneer
species (P) from nonpioneer light-demanding (NPLD) and shade-tolerant (ST) species, particularly along PCA1
(F = 32.5, P < 0.001, Fig. 1C). Pioneer species characterized by light wood tended to exhibit increasing relative
vertical WD profiles, whereas (dense wood) shade-tolerant species exhibited decreasing relative vertical profiles.
NPLD species presented intermediate scores and, hence, less contrasting profiles. This result, coupled with exist-
ing knowledge on radial WD variation in the trunk, highlights clear homology between radial and vertical WD
variations and their relations to plant strategies37. Across the 51 studied species, the differences in species average
WD were highest at the tree base and decreased toward the small branches (Fig. 1E). The broader range of species
WD found at the trunk base may reflect differences in canopy accession strategies in early tree developmental
stages17. We can think about radial and vertical WD increases in light of the costs and benefits of investing in low
vs high WD. For a given biomass investment, theory predicts that building a thicker trunk with a low WD is more
efficient for carrying a tree’s own weight (resistance to buckling) and resisting wind forces than building a thinner
trunk with a high WD47,48. Although low-WD stems require less biomass investment per unit stem volume48,
they imply higher maintenance costs of living tissues (inner bark and wood parenchyma)49, suggesting that WD
may eventually have to increase (both upward and outward) in older pioneer trees. Narrow stems with a relatively
higher WD in young shade-tolerant trees may allow greater resistance against falling branches from dominant
trees26,45. This investment in dense wood might not be needed later in the ST tree life, which could then produce
lighter outer wood. The decreasing outward WD gradient can then be reinforced during heartwood formation35.
In mature, reiterated tree crowns, on the other hand, most trees reaching the canopy will tend to be subjected to
similar biomechanical constraints when extending branches laterally. This may explain why WD then converges
to a narrower range of values across all the sampled species. In other words, whereas contrasted strategies exist in
early life stages, there seem to be a convergence in the mechanical or maintenance constraints met by adult trees,
which is reflected by similar wood densities across species both in the branches (vertical gradients) in in the outer
wood (radial gradients). This result is also congruent with the fact that large reiterated trees tend to display similar
forms50, independent of discrepancies in the architectural model49 observed at the sapling stage.
Influence of vertical variation in WD on tree AGB estimates. We leveraged volumes estimates from
both (i) the 822 destructively sampled individuals and (ii) terrestrial LiDAR scanning data for a subset of 58
individual trees10.
Scientific Reports | (2020) 10:2001 | https://doi.org/10.1038/s41598-020-58733-w 4www.nature.com/scientificreports/ www.nature.com/scientificreports
Parameters Performance
Models a b c d R² RSE AIC B CV
(m1) VWWD = a + b*WDStu 0.07842 (0.00682) 0.78915 (0.01076) 0.87 0.049 −2629.1 0.86 14.8
(m2) VWWD = a + b*WDStu + c*DBH 0.05455 (0.00679) 0.78326 (0.01011) 0.00048 (0.00005) 0.88 0.046 −2732.3 0.75 15.2
(m3) VWWD = a + b*WDStu + c*DBH + d*Sm 0.10013 (0.01077) 0.77299 (0.01012) 0.00042 (0.00005) −0.05819 (0.0108) 0.89 0.045 −2759 0.74 15
(m4) VWWD = a + b* WDGWD 0.1721 (0.00763) 0.63638 (0.01189) 0.78 0.063 −2200.6 1.41 21.8
(m5) VWWD = a + b*WDGWD + c*DBH 0.13406 (0.00783) 0.63614 (0.01105) 0.00067 (0.00006) 0.81 0.059 −2320.9 1.19 23.8
(m6) VWWD = a + b*WDGWD + c*DBH + d*Sm 0.18233 (0.01325) 0.62656 (0.01113) 0.0006 (0.00006) −0.06258 (0.01395) 0.81 0.058 −2338.9 1.18 23.7
Table 2. Prediction models of whole-tree WD estimation (VWWD, in g.cm−3). The models are based on
species average WD extracted from the Global Wood Density database (WDGWD in, g.cm−3), individual tree
WD from stumps (WDStu, in g.cm−3) and tree structure parameters (stem DBH in cm and the stem morphology
index, Sm). Model coefficients are provided along with standard errors (in brackets). All coefficients are highly
significant (P < 0.001). Model performance is characterized using classical fit metrics for model residuals (R²,
RSE, AIC), the measure of bias (B) and total error (coefficient of variation, CV) computed for AGB estimations
(see the Methods section).
Using species WD GWD to convert volumes to masses in our 822 sampled trees, we found a positive mean
error across all trees (B = 8.12% ± 17.20%) with large individual variations (i.e., tree-level errors, bi, ranging
from −40.31% to +72.77%; back line in Fig. 2A) and a coefficient of variation (CV) of 30.9%. Using WDStu, we
obtained a similar mean error across all trees (B = 8.97% ± 11.08%), with a narrower range of individual errors
(from −24.05% to 61.69% and CV = 19.8%, Fig. S3A). We found similar error patterns when tree volumes were
derived from terrestrial LiDAR data based on 58 scanned trees (see red line in Fig. 2A). The error in individual
tree AGB estimation (bi) was correlated with the tree vertical WD profile (Figs. 2B and S3B). This resulted in (i)
overestimation of AGB (positive bi) for trees with negative PCA1 scores (i.e., decrease in WD from the stump to
small branches) and (ii) underestimation of AGB (negative bi) for trees with positive PCA1 scores (i.e., increase
in WD from the stump to small branches), regardless of the WD source (i.e., WDGWD or individual WDStu). It is
worth noting that vertical variation in WD may also affect the accuracy of AGB allometric models. For instance,
we observed a similar pattern of error on AGB estimations obtained from a pantropical model4, with a decrease
in mean tree error as PCA1 score increased (Fig. S5). This suggests that within-tree WD variation is not well
accounted for even in reference pantropical allometric models.
The implications for stand-level error propagation in AGB estimation were not specifically studied here,
but decreasing vertical variation in WD tended to be more frequent, explaining the overall mean positive bias
obtained across our destructive (c. 9%) and terrestrial LiDAR (c. 11%) datasets and the 9% overestimation at the
stand level found by Sagang et al.41 with a subset of our data. Since the vertical profile is correlated with species
mean WD, and the latter value is close to 0.6 g cm−3 in wet tropical forests overall44, we may expect dominance
of decreasing vertical WD patterns (see Fig. 1D) in this ecosystem. However, this may not be the case in young
secondary rainforests, where the abundance of pioneer species may cancel out or even invert vertical WD patterns
at the stand level. The successional trend may be different in drier vegetation, where early successional species
exhibit relatively denser wood, possibly to resist higher stress levels51. This potential scenario has implications
when estimating stand-level carbon content (emission factor) using volumetric data12, notably in the context of
national forest or greenhouse gas inventories. We indeed expect the bias in AGB estimation to be strongly struc-
tured in space, varying with the species distribution and forest disturbance history.
Predicting and correcting vertical WD variations. Reducing systematic errors in AGB estimations
when converting tree volumes to masses requires the use of WD values that are representative of tree-level wood
density, which involves integrating vertical variation in WD. For each tree, we weighted each compartment’s WD
by its volume to calculate the compartment volume-weighted WD, which were summed to obtain the tree level
VWWD (see Methods). We then developed linear prediction models for VWWD using easily accessible variables
characterizing WD (i.e., WDStu, WDGWD) and tree structure (tree DBH and the stem morphology index, Sm,
used in Sagang et al.41). Prediction models based on WD alone explained most of the variance in tree VWWD
(R² = 0.87 for m1 based on WDStu and 0.78 for m4 based on species average WDGWD, Table 2). Bias in tree AGB
estimations was considerably reduced when using VWWD predicted from m1 and m4 to convert tree volume
to mass (B = 0.86% and 1.41% for m1 and m4, respectively). Including tree DBH in VWWD models further
increased the model fit (∆AIC = −103.2 and −120.3 for m2 and m5 in comparison to m1 and m4, respectively)
and reduced the bias in tree AGB estimates (B = 0.75% and 1.19% for m2 and m5, respectively; Figs. S3C,D and
2C,D). Although several other tree structure predictors were significant (e.g., stem morphology index Sm in m3
and m6), they often led to modest improvements of model fit (for instance, ∆AIC = −26.7 and −18 for m3 and m6
with respect to m2 and m5, respectively). We therefore favor using models m2 or m5, depending on the availability
of local WD data.
We evaluated the robustness of our models using a leave-one-out cross-validation procedure, where the mod-
els were calibrated on all sites except a focal site (corresponding to a country in this case) and were used to predict
tree VWWD for that site. Overall, the cross-validation models proved robust with B < 5% and CVs only slightly
higher than when focal sites were used in model calibration (Fig. S4). This suggests that WD correction models
should be transposable to other sites.
Scientific Reports | (2020) 10:2001 | https://doi.org/10.1038/s41598-020-58733-w 5www.nature.com/scientificreports/ www.nature.com/scientificreports
Figure 2. Bias in volume to mass conversion due to vertical WD gradients induced by the use of WDGWD: (A)
Density plot of the relative errors (bi) in tree biomass estimation computed from combinations of tree volume
(destructive data: black line, n = 822; LiDAR data: red line, n = 58) and species mean wood density extracted
from the Global Wood Density database (WDGWD). (B) Local regression (loess function) representing the
relationship between tree relative vertical WD profile (characterized by tree PCA1 score) and bi of panel A. Bias
is reduced when using a tree-level estimate of WD, the volume-weighted wood density (VWWDm5): (C) Density
plot of bi for tree biomass estimation computed from combinations of tree volume and the predicted VWWD
from WDGWD and tree DBH (model 5, see Table 2). (D) Local regression (loess function) representing the
relationship between the relative vertical WD profile and bi of panel C.
The role of intraindividual WD gradients had not previously been evaluated when applying terrestrial LiDAR
scanning to estimate AGB. The existing studies either exhibited unexplained systematic bias10,52 or neglected the
influence of vertical WD variations by using WD obtained from the Global Wood Density database in both pre-
dicted and reference AGB data52. In this study, we showed that WD gradients were a large source of uncertainty
in tree-level AGB estimations and that they propagated systematic errors (bias) across our datasets that were far
from being negligible (c. 10%). As TLS technology will likely play an increasing role in the development of non-
destructive AGB allometries10,11,52 and the direct assessment of AGB at the stand level (notably for the calibration
of upcoming satellite sensors53), care should be taken not to let the gain in the precision of wood volume be offset
by the use of biased WD estimates. Here, we followed and generalized a seminal study39,41 in which the approach
differed significantly from previous approaches45,46 in proposing to collect WD samples at specific locations in
trees that would presumably be representative of the mean tree WD. Instead, we leveraged the relationships
between WD estimates that are currently available (e.g., from the Global Wood Density database), WD vertical
variation patterns and data that are routinely collected during field inventories to develop correction models that
can easily be implemented for standard scientific inventory data. These models substantially reduced the error of
tree-level AGB estimations and virtually removed the bias across our datasets, and they therefore constitute an
efficient solution to the challenges of estimating tree biomass from volumetric data.
Scientific Reports | (2020) 10:2001 | https://doi.org/10.1038/s41598-020-58733-w 6www.nature.com/scientificreports/ www.nature.com/scientificreports
The results presented here provide a unique perspective on the homology between radial and vertical WD
gradients, on the spectrum of regeneration and survival strategies in young stages, and on the converging biome-
chanical constraints in the canopy of reiterated trees. These findings should guide the collection of further bio-
mechanical50 and physiological information required to improve our functional understanding of dense tropical
forests. Our findings will also contribute to the development of nondestructive, precise and accurate methodolo-
gies for biomass assessment in tropical forests, with concrete implications for national greenhouse gas accounting,
carbon trading schemes and REDD + frameworks in tropical countries.
Materials and Methods
Study area. The study was carried out in central Africa within the second largest continuous area of tropical
forest after Amazonia54. Field work took place between July 2015 and February 2017, and the investigations were
based on a standard destructive sampling protocol applied in six countries (Cameroon: Cam, Central African
Republic: RCA, Democratic Republic of Congo: DRC, Republic of Congo: RC, Republic of Equatorial Guinea:
REG, Gabon: Gab and Congo: Con), with one sampling site per country5. Only one forest type was sampled per
country except in the RC, where both monodominant stands of Gilbertiodendron dewevrei and so-called “transi-
tion forests”55 from evergreen to semideciduous types were sampled.
The study area encompassed broad environmental gradients. The altitude across sampling sites ranged from c.
50 m a.s.l. in REG to more than 650 a.s.l. in Cam. The mean annual temperature (M.A.T.) was lowest in Cameroon
(23.6 °C) and highest in the DRC and REG (25.2 °C). Mean annual rainfall (M.A.R.) ranged from a low of 1
396 mm in Cam to a high of 2 699 mm in REG. Details of the geographical coordinates and environmental condi-
tions of the sampling sites are provided in Fayolle et al.5.
Data collection. Destructive data. Sampling scheme. A total of 822 individuals belonging to 51 species
and 16 families were destructively sampled across the Congo basin (Table S3). Pterocarpus soyauxii with 51 indi-
viduals was the most sampled species, while Julbernardia pellegriniana was the least sampled with 3 individuals.
Within each country/forest type, the most abundant species were determined based on forest inventory data (for
forest management and exploitation planning) and field expertise5. From each set of abundant species, ~15 spe-
cies were chosen for each site to cover the range of the species mean wood density found at those sites.
Field protocol. The protocol for destructive sampling has been detailed by Fayolle et al.5. Before tree felling,
the diameter at breast height (DBH, in cm) was measured at a height of 130 cm (or 30 cm above any deformations)
using a 5 m-diameter tape. Total tree height and trunk height (defined as the height up to the first major living
branch) were measured using a hypsometer device (Haglöf Vertex IV). Tree crown radii were measured in each
cardinal direction by combining a clinometer (to locate the vertical projection of a given crown extremity on the
ground) and a tape (to measure the distance between the projected crown extremity and the trunk). The tree
crown radius (Cr, in m) was defined as the average of the four radius measurements.
After felling, the trees were divided into six vertical compartments: (1) the stump (Stu), defined as the part of
the tree below the felling point (c. 1 m); (2) the stem base (Steb) if present, which corresponds to the lowest meters
of the stem (above the stump) that may be affected by deformations (typically buttresses) and therefore separated
from the commercial part of the stem by loggers; (3) the stem (Ste), corresponding to the well-conformed, com-
mercial part of the tree trunk (up to the base of the first major living branch); and (4) large-, (5) medium- and (6)
small-size branches (indicated as LB, MB and SB), corresponding to branches with a basal diameter greater than
20 cm, between 20 and 5 cm and less than 5 cm, respectively.
Apart from the tree stump, tree parts with basal diameters < 70 cm were directly weighted in the field. Larger
tree parts were divided into 1–2 m-long consecutive logs, and their volumes were estimated by approximating
logs’ geometry as truncated cones.
In each compartment, two opposite wedge-shaped wood samples (30 to 50 mm thick) spanning the pith to the
bark were taken to determine wood specific gravity. To reduce water losses, wood samples were sealed in plastic
bags after extraction in the field and brought to the laboratory.
Laboratory analyses. For each wood sample, I, of compartment c, the fresh mass (mfi, in g) was measured with
an electronic scale with a capacity of 6.2 kg and precision of 0.01 g, and the fresh volume (vfi, in cm3) was obtained
following the Archimedes principle. Samples were then oven dried at 105 °C for two to three days until a constant
dry mass was obtained (mdi, in g). From those measurements, the basic wood density (WDi = mdi /vfi , in g.cm−3),
( )
moisture content MCi = (mdi − mfi )/mfi and fresh biomass-to-volume ratio (BVi = vfi /mfi , in cm3.g−1) of the
samples were computed and averaged by compartment to obtain WDc, MCc and BVc.
Volume and biomass estimations. The gold-standard for estimating total tree volume is by water-displacement
method (i.e. Archimedes principle) of the entire tree. Similarly, direct weighting of the entire tree would provide
the most reliable estimation of total tree mass. In practice, however, a combination of direct and indirect esti-
mation methods are used due to logistical constraints, entailing unquantified uncertainties on tree volume and
mass estimations. Here, the volume of logs that could not be weighted in the field (i.e., with a diameter ≥ 70 cm)
was estimated considering logs as truncated cones56. For stumps with irregular shapes, the volume was computed
using height measured in the field and the cross-sectional area computed from georeferenced photographs (see
Fayolle et al.5 for details). Fresh volume and fresh biomass estimates were converted to dry biomass using the
appropriate compartment-level WD (i.e., WDc) and MC (i.e., MCc), respectively. For a given tree, summing all dry
biomass estimates within a compartment provided the compartment’s “observed” biomass (AGBc), and summing
all AGBc values of the tree allowed the total tree “observed” AGB (AGBobs) to be computed. Field-measured fresh
biomass was also converted to volume using the appropriate BVc, yielding compartment- and tree-level volumes
(Vc and Vobs, respectively). Converting Vobs to biomass using a single WD value such as the species average WD
values found in the Global Wood Density database (hereafter, WDGWD13,46), produced an estimated dry biomass
value (AGBest).
Scientific Reports | (2020) 10:2001 | https://doi.org/10.1038/s41598-020-58733-w 7www.nature.com/scientificreports/ www.nature.com/scientificreports
Volume-weighted wood density. Following Sagang et al.41, we computed the volume-weighted wood density
(VWWDc, in g.cm−3) at the compartment level. For example,
Vc
VWWDc = WDc ×
Vobs (1)
At the individual tree level, an unbiased estimator of wood-specific gravity is the sum of VWWDc, which we
hereafter refer to as VWWD. In practice, multiplying Vobs by VWWD yields the reference tree biomass, AGBobs.
Terrestrial LiDAR data. The terrestrial laser scanning (TLS) data used in this study derive from10 and come
from 58 trees sampled at the Cameroon field site. The trees were scanned with a Leica C10 Scanstation prior to
being destructively sampled within the framework of the PREREDD + project. A minimum of three scans were
performed around each targeted tree to obtain a sufficient point cloud density for high-quality reconstruction of
tree structure. Quantitative structure models (QSMs) were generated using the SimpleTree algorithm57, and the
QSMs were manually refined using dedicated software (refer to Momo et al.10 for details).
Species functional traits. We used COFOR-traits, a database of central African species functional traits extracted
from local floras, academic papers and unpublished theses58–60, to assign the species regeneration guild (pioneer,
light demanding nonpioneer and shade tolerant) to each species (Table S1).
Statistical analyses. Characterizing the vertical variation patterns of wood-specific gravity. We compiled
compartment-level wood density measurements (WDc) for all 822 trees in a table with individual trees in rows
and the six compartments (Stu, Steb, Ste, LB, MB, SB) in columns. Each table line therefore represented a vertical
variation profile of wood density from the tree stump to the finest branches for a given tree. To systematically
compare these profiles across trees, the WDc table was subjected to principal component analysis (PCA). We
centered the WDc table by lines prior to re-performing the PCA to discard intertree variation in overall WD while
focusing on the sole vertical gradient.
Taxonomic analysis. We recovered a phylogenetic tree for 49 of our 51 species using the PHYLOMATIC v.3
utility61 based on the Davies et al.62 phylogenetic hypothesis for relationships among angiosperm families, with
polytomies applied within most families and genera. To evaluate whether the species vertical profile in WD was
evolutionarily conserved, we determined the observed phylogenetic signal using Blomberg’s K on the basis of the
species mean PCA1 score. Blomberg’s K values vary between zero and > 1, with values close to zero indicating no
phylogenetic signal and values close to 1 indicating trait evolution according to Brownian motion (i.e., random
walk divergence in species similarity). To evaluate significance, we used a rank-based P-value with Blomberg’s K
for 999 randomizations of phylogeny tips.
Accounting for the vertical variation of wood density when converting tree volume to biomass. Converting tree
volume (derived from either destructive data or QSMs) to biomass requires the use of a WD value that may not be
representative of the whole-tree WD, leading to biased tree AGB estimation. We computed AGBest using tree-level
WD recorded approximately at breast height (WDStu) and species mean WD from the literature (i.e., WDGWD),
both of which are of potential interest for the routine conversion of TLS-derived tree volume to biomass. While
both WDStu and WDGWD neglect WD vertical variation within trees, WDStu accounts for site-level and individ-
ual tree-level variations and is therefore expected to provide more accurate AGBest values. We characterized the
deviations of AGBest from AGBobs across trees using a measure of bias (B) and a measure of total error (CV). B was
calculated as the average of tree-level relative errors, bi:
AGBest .i − AGBobs.i
bi = ∗ 100
AGBobs.i
where AGBest.i and AGBobs.i are the estimated and observed AGB of tree i.
The coefficient of variation (CV) was defined as follows:
N
1
RSE =
N
∗ ∑(AGBest.i − AGBobs.i)2 ,
i=1
where N is the total number of trees,
N
1
MAGBobs =
N
∗ ∑AGBobs.i
i=1
RSE
CV =
MAGBobs
We developed simple linear models to predict the unbiased estimator of whole-tree WD (i.e., VWWD) based
on tree wood (WDStu, WDGWD) and structure (DBH, stem morphology) parameters. The stem morphology, Sm, is
defined as the ratio of trunk height to total tree height41. We evaluated and compared model performance using
classical fit metrics (adjusted R², RSE, AIC) as well as B and CV for tree biomass, where AGBest was computed
using the models’ VWWD predictions. All analyses were performed with R statistical software 3.4.3 (65).
Scientific Reports | (2020) 10:2001 | https://doi.org/10.1038/s41598-020-58733-w 8www.nature.com/scientificreports/ www.nature.com/scientificreports
Data availability
The wood density data used in this study is available at https://doi.org/10.23708/8DUWUC.
Received: 27 August 2019; Accepted: 16 January 2020;
Published: xx xx xxxx
References
1. Bar-On, Y. M., Phillips, R. & Milo, R. The biomass distribution on Earth. Proc. Natl. Acad. Sci. 115, 6506–6511 (2018).
2. Denman, K. L. et al. Couplings Between Changes in the Climate System and Biogeochemistry. 1–90 (2007).
3. Chave, J. et al. Tree allometry and improved estimation of carbon stocks and balance in tropical forests. Oecologia 145, 87–99 (2005).
4. Chave, J. et al. Improved allometric models to estimate the aboveground biomass of tropical trees. Glob. Chang. Biol. 20, 3177–3190
(2014).
5. Fayolle, A. et al. A regional allometry for the Congo basin forests based on the largest ever destructive sampling. For. Ecol. Manage.
430, 228–240 (2018).
6. Henry, M. et al. GlobAllomeTree: International platform for tree allometric equations to support volume, biomass and carbon
assessment. IForest 6, 1–5 (2013).
7. Ploton, P. et al. Closing a gap in tropical forest biomass estimation: Taking crown mass variation into account in pantropical
allometries. Biogeosciences 13, 1571–1585 (2016).
8. Bastin, J.-F. et al. Pan-tropical prediction of forest structure from the largest trees. Glob. Ecol. Biogeogr. 1–18. https://doi.org/10.1111/
geb.12803 (2018).
9. Crowther, T. W. et al. Mapping tree density at a global scale. Nature 525, 201–205 (2015).
10. Momo Takoudjou, S. et al. Using terrestrial laser scanning data to estimate large tropical trees biomass and calibrate allometric
models: A comparison with traditional destructive approach. Methods Ecol. Evol. 9, 905–916 (2018).
11. Lau, A. et al. Tree biomass equations from terrestrial LiDAR: A case study in Guyana. Forests 10, 1–18 (2019).
12. IPCC. 2019 Refinement to the 2006 IPCC Guidelines for National Greenhouse Gas Inventories. (2019). https://www.ipcc-nggip.iges.
or.jp/public/2019rf/index.html. (Accessed: 20th June 2019).
13. Chave, J. et al. Towards a worldwide wood economics spectrum. Ecol. Lett. 12, 351–366 (2009).
14. Williamson, G. B. & Wiemann, M. C. Measuring wood specific gravity…correctly. Am. J. Bot. 97, 519–524 (2010).
15. Niklas, K. J. & Spatz, H. Worldwide correlations of mechanical properties and green wood density Linked references are available on
JSTOR for this article: Worldwide correlations of mechanical properties and green wood density1. 97, 1587–1594 (2010).
16. Niklas, K. J. Influence of Tissue Density-specific Mechanical Properties on the Scaling of Plant Height. Ann. Bot. 72, 173–179 (1993).
17. Van Gelder, H. A., Poorter, L. & Sterck, F. J. Wood mechanics, allometry, and life-history variation in a tropical rain forest tree
community. New Phytol. 171, 367–378 (2006).
18. Pratt, R. B., Jacobsen, A. L., Ewers, F. W. & Davis, S. D. Relationships among xylem transport, biomechanics and storage in stems and
roots of nine Rhamnaceae species of the California chaparral. New Phytol. 174, 787–798 (2007).
19. Lachenbruch, B. & Mcculloh, K. A. Tansley review Traits, properties, and performance: how mechanical functions in a cell, tissue,
or whole. New Phytol. 204, 747–764 (2014).
20. Santiago, L. S. et al. Coordination and trade-offs among hydraulic safety, efficiency and drought avoidance traits in Amazonian
rainforest canopy tree species. New Phytol. 218, 1015–1024 (2018).
21. Jacobsen, A. L., Pratt, B. R., Davis, S. D. & Ewers, F. W. Comparative community physiology: Nonconvergence in water relations
among three semi-arid shrub communities. New Phytol. 180, 100–113 (2008).
22. Zanne, A. E. et al. Angiosperm wood structure: Global patterns in vessel anatomy and their relation to wood density and potential
conductivity. Am. J. Bot. 97, 207–215 (2010).
23. Fortunel, C., Ruelle, J., Beauchêne, J., Fine, P. V. A. & Baraloto, C. Wood specific gravity and anatomy of branches and roots in 113
Amazonian rainforest tree species across environmental gradients. New Phytol. 202, 79–94 (2014).
24. Ziemińska, K., Westoby, M. & Wright, I. J. Broad anatomical variation within a narrow wood density range - A study of twig wood
across 69 Australian angiosperms. PLoS One 10, 1–25 (2015).
25. Ziemińska, K., Butler, D. W., Gleason, S. M., Wright, I. J. & Westoby, M. Fibre wall and lumen fractions drive wood density variation
across 24 Australian angiosperms. AoB Plants 5, 1–14 (2013).
26. Baker, T. R. et al. Variation in wood density determines spatial patterns in Amazonian forest biomass. Glob. Chang. Biol. 10, 545
(2004).
27. Fortunel, C., Fine, P. V. A. & Baraloto, C. Leaf, stem and root tissue strategies across 758 Neotropical tree species. Funct. Ecol. 26,
1153–1161 (2012).
28. Woodcock, D. & Shier, A. Wood specific gravity and its radial variations: The many ways to make a tree. Trees - Struct. Funct. 16,
437–443 (2002).
29. Poorter, L. et al. Are Functional Traits Good Predictors of Demographic Rates? Evidence From Five Neotropical Forests. 89,
1908–1920 (2008).
30. Adler, P. B. et al. Functional traits explain variation in plant life history strategies. Proc. Natl. Acad. Sci. USA 111, 740–5 (2014).
31. Wright, S. J. et al. Functional traits and the growth–mortality trade-off in tropical trees. Ecology 91, 3664–3674 (2010).
32. Wiemann, M. & Williamson, G. B. Wood Specific Gravity Gradients in Tropical Dry and Montane Rain Forest Trees. Am. J. Bot. 76,
924–928 (1989).
33. Parolin, P. Radial Gradients in Wood Specific Gravity in Trees of. Iawa J. 23, 449–457 (2002).
34. Rueda, R. & Williamson, G. B. Radial and Vertical Wood Specific Gravity in Ochroma pyramidale (Cav. ex Lam.) Urb.
(Bombacaceae). Assoc. Trop. Biol. Conserv. 24, 512–518 (1992).
35. Lehnebach, R. et al. Wood Density Variations of Legume Trees in French Guiana along the Shade Tolerance Continuum: Heartwood
Effects on Radial Patterns and Gradients. Forests 10, 80 (2019).
36. Whitmore, J. L. Wood density variation in Costa Rican balsa. Wood Sci. 5, 223–229 (1973).
37. Hietz, P., Valencia, R. & Joseph Wright, S. Strong radial variation in wood density follows a uniform pattern in two neotropical rain
forests. Funct. Ecol. 27, 684–692 (2013).
38. Osazuwa-Peters, O. L., Wright, S. J. & Zanne, A. E. Radial variation in wood specific gravity of tropical tree species differing in
growth-mortality strategies. Am. J. Bot. 101, 803–811 (2014).
39. Lachenbruch, B., Moore, J. R. & Evans, R. Size- and Age-Related Changes in Tree Structure and Function. 4, (2011).
40. Wiemann, M. C. & Williamson, G. B. Wood specific gravity variation with height and its implications for biomass estimation. Res.
Pap. FPL-RP-677 9 (2014).
41. Sagang, L. B. T. et al. Using volume-weighted average wood specific gravity of trees reduces bias in aboveground biomass predictions
from forest volume data. For. Ecol. Manage. 424, 519–528 (2018).
42. Morel, H. et al. Basic wood density variations of Parkia velutina Benoist, a long-lived heliophilic Neotropical rainforest tree. Bois
Forets des Trop. 335, 59–69 (2018).
43. Nogueira, E. M., Nelson, B. W. & Fearnside, P. M. Wood density in dense forest in central Amazonia, Brazil. For. Ecol. Manage. 208,
261–286 (2005).
Scientific Reports | (2020) 10:2001 | https://doi.org/10.1038/s41598-020-58733-w 9www.nature.com/scientificreports/ www.nature.com/scientificreports
44. Zanne, A. E. et al. Data from: Towards a worldwide wood economics spectrum. Dryad Digital Repository. Dryad 235, 33 (2009).
45. Chave, J., Muller-landau, H. C., Baker, T. R., Easdale, T. A. & Webb, C. O. Regional and Phylogenetic Variation of Wood Density
across 2456 Neotropical Tree Species. Ecol. Soc. Am. 16, 2356–2367 (2006).
46. Hawthorne, W. D. Ecological profiles of Ghanaian forest trees. Trop. For. Pap. No. 29, 345 pp. (1995).
47. Larjavaara, M. & Muller-Landau, H. C. Rethinking the value of high wood density. Funct. Ecol. 24, 701–705 (2010).
48. Anten, N. P. R., Herrera, R. A., Schieving, F. & Onoda, Y. Wind and mechanical stimuli differentially affect leaf traits in Plantago
major. New Phytol. 188, 1469–8137 (2010).
49. Hallé, F. & Oldeman, R. Essai sur l’architecture et la dynamique de croissance des arbres tropicaux. (Masson, 1970).
50. Martin-Ducup, O. et al. Canopy position and shade tolerance shape distinct aspects of crown architecture in 15 tropical tree species.
An approach from TLS data.
51. Poorter, L. et al. Wet and dry tropical forests show opposite successional pathways in wood density but converge over time. Nat. Ecol.
Evol. https://doi.org/10.1038/s41559-019-0882-6 (2019).
52. Disney, M. I. et al. Weighing trees with lasers: Advances, challenges and opportunities. Interface Focus 8, (2018).
53. Chave, J. et al. Ground Data are Essential for Biomass Remote Sensing Missions. Surv. Geophys. https://doi.org/10.1007/s10712-019-
09528-w (2019).
54. Tyukavina, A. et al. Aboveground carbon loss in natural and managed tropical forests from 2000 to 2012. Environ. Res. Lett. 10,
(2015).
55. Letouzey, R. Carte phytogéographique du Cameroun, 1:500 000, 8 feuillets + 5 notices. (1985).
56. Rondeux, J. La mesure des arbres et des peuplements forestiers. (Presses agronomiques de Gembloux, 1999).
57. Hackenberg, J., Spiecker, H., Calders, K., Disney, M. & Raumonen, P. SimpleTree - An efficient open source tool to build tree models
from TLS clouds. Forests 6, 4245–4294 (2015).
58. Bénédet, F. et al. CoForTraits, base de données d’information sur les traits des espèces d’arbres africaines. Version 1.0. http://
coforchange.cirad.fr/african_plant_trait (2013).
59. Loubota Panzou, G. J. et al. Architectural differences associated to functional traits among 45 coexisting tree species in central
Africa. Funct. Ecol. 0–2 https://doi.org/10.1111/1365-2435.13198 (2018).
60. Fayolle, A. et al. A new insight in the structure, composition and functioning of central African moist forests. For. Ecol. Manage. 329,
195–205 (2014).
61. Webb, C. O. & Donoghue, M. J. Phylomatic: Tree assembly for applied phylogenetics. Mol. Ecol. Notes 5, 181–183 (2005).
62. Davies, T. J. et al. Darwin’s abominable mystery: Insights from a supertree of the angiosperms. Proc. Natl. Acad. Sci. 101, 1904–1909
(2004).
Acknowledgements
S.T.M. was supported by an IRD grant (2017-2019) and the PREREDD + project (07/2015-10/2016) and P.P.
by the ERA-GAS 3DforMod project (ANR-17-EGAS-0002-01p). This study benefited from data from the
regional project on REDD + “Establishment of allometric equations for forest types in the Congo Basin” grant
N° TF010038 from the Global Environment Facility administered by the World Bank and implemented by
COMIFAC. Data collection was carried out by INDEFOR-AP (Equatorial Guinea), IRET (Gabon), the University
of Yaoundé 1 (Cameroon), the University of Bangui (CAR), the University of Marien Ngouabi (Congo) and the
University of Kisangani (DRC). We are also grateful to the logging companies involved in the project (COMALI,
Rougier, ALPICAM-GRUMCAM, SEFCA, CIB-OLAM and CFT) for their logistic support necessary for
fieldwork and laboratory measurements. Research carried out within LMI DYCOFAC.
Author contributions
S.T.M., P.P. and N.B. designed the research; B.S., F.B., J.L., V.M., A.N., D.O. and O.Y. and PREREDD collaborators
provided destructive data; S.T.M., P.P., O.M., R.L., C.F., L.B.T.S., P.C., A.F., M.L., R.P., V.R., B.S. and N.B. performed
the research, analyzed the data, wrote the paper or provided useful feedback; B.S. and N.B. co-supervised the
work.
Competing interests
The authors declare no competing interests.
Additional information
Supplementary information is available for this paper at https://doi.org/10.1038/s41598-020-58733-w.
Correspondence and requests for materials should be addressed to N.B.
Reprints and permissions information is available at www.nature.com/reprints.
Publisher’s note Springer Nature remains neutral with regard to jurisdictional claims in published maps and
institutional affiliations.
Open Access This article is licensed under a Creative Commons Attribution 4.0 International
License, which permits use, sharing, adaptation, distribution and reproduction in any medium or
format, as long as you give appropriate credit to the original author(s) and the source, provide a link to the Cre-
ative Commons license, and indicate if changes were made. The images or other third party material in this
article are included in the article’s Creative Commons license, unless indicated otherwise in a credit line to the
material. If material is not included in the article’s Creative Commons license and your intended use is not per-
mitted by statutory regulation or exceeds the permitted use, you will need to obtain permission directly from the
copyright holder. To view a copy of this license, visit http://creativecommons.org/licenses/by/4.0/.
© The Author(s) 2020
Scientific Reports | (2020) 10:2001 | https://doi.org/10.1038/s41598-020-58733-w 10www.nature.com/scientificreports/ www.nature.com/scientificreports
Consortia
PREREDD Collaborators
Yannick Bocko6, Noël Fonton12, Narcisse Kamdem1, John Katembo4, Henriette Josiane
Kondaoule12, Hervé Martial Maïdou13, Géraud Mankou6, Michel Mbasi4, Thomas Mengui10,
Gislain I. I. Mofack1, Cynel Moundounga8, Quentin Moundounga8, Lydie Nguimbous13,
Norberto Nsue Ncham9, Francisco Ondo Meye Asue9, Yvon-Patrick Senguela10, Lionel Viard12
& Louis Zapfack14
12
ONFi, Yaoundé, Cameroon. 13COMIFAC, Yaoundé, Cameroon. 14University of Yaoundé 1, Yaoundé, Cameroon.
Scientific Reports | (2020) 10:2001 | https://doi.org/10.1038/s41598-020-58733-w 11You can also read