Measuring difference in edge avoidance in grassland birds: the Corncrake is less sensitive to hedgerow proximity than passerines
←
→
Page content transcription
If your browser does not render page correctly, please read the page content below
See discussions, stats, and author profiles for this publication at: https://www.researchgate.net/publication/285597529

Measuring difference in edge avoidance in
grassland birds: the Corncrake is less sensitive
to hedgerow proximity than passerines

ARTICLE in JOURNAL OF ORNITHOLOGY · JANUARY 2016
Impact Factor: 1.71 · DOI: 10.1007/s10336-015-1281-7

READS

34

3 AUTHORS:

             Aurélien G. Besnard                                                        Yoan Fourcade
             University of Angers                                                       Swedish University of Agricultural Sciences
             6 PUBLICATIONS 20 CITATIONS                                                12 PUBLICATIONS 72 CITATIONS

                 SEE PROFILE                                                              SEE PROFILE

             Jean Secondi
             University of Angers
             45 PUBLICATIONS 548 CITATIONS

                 SEE PROFILE

All in-text references underlined in blue are linked to publications on ResearchGate,                                  Available from: Jean Secondi
letting you access and read them immediately.                                                                           Retrieved on: 17 March 2016
J Ornithol
DOI 10.1007/s10336-015-1281-7

    ORIGINAL ARTICLE

Measuring difference in edge avoidance in grassland birds:
the Corncrake is less sensitive to hedgerow proximity
than passerines
Aurélien G. Besnard1,2 • Yoan Fourcade1,2 • Jean Secondi1,2

Received: 9 February 2015 / Revised: 9 August 2015 / Accepted: 18 August 2015
Ó Dt. Ornithologen-Gesellschaft e.V. 2015

Abstract Edge avoidance is an important feature of                   in their efforts to improve management guidelines, which
habitat selection in grassland birds, as their density is            often do not take edge effects into account.
usually reduced close to habitat boundaries. In many
extensively managed European grasslands, fragmentation               Keywords Hay meadows  Ground-nesting birds
is caused by the presence of wooded hedgerows dividing               Whinchat  Yellow wagtail  Reed bunting  Corn bunting
meadows. Comparing the magnitude of hedgerow avoid-
ance by co-occurring species is essential for the manage-            Zusammenfassung
ment of grassland areas and the implementation of efficient
conservation schemes. We quantified hedgerow avoidance               Unterschiede in der Meidung von Randstrukturen bei
by the Corncrake and four grassland passerines in western            Grünlandarten: Wachtelkönige sind weniger empfind-
France. As expected, all species avoided hedgerows, but              lich gegenüber der Nähe zu Hecken als Singvögel
the effect was less pronounced for the Corncrake. We
hypothesize that this may reflect a lower predation risk             Randeffekte sind ein wichtiges Merkmal bei der Habitat-
towards the larger and most inconspicuous species. Alter-            wahl von Grünlandarten, da sie in der Nähe von Habitat-
natively, social communication in Corncrakes may be less             grenzen normalerweise eine geringere Dichte aufweisen. In
impeded by wooded vegetation than in passerines. How-                vielen extensiv bewirtschafteten Grünlandgebieten in
ever, the mechanisms responsible for the observed pattern            Europa sind die Wiesen und Weiden durch Gebüsch- und
remain uncertain. Nevertheless, our study provides a gen-            Heckenstrukturen zerteilt, was in einer Fragmentierung
eral technique that can be applied to measure boundary               dieser Flächen resultiert. Ein Vergleich des Umfangs der
avoidance. This information is important for policymakers            Heckenmeidung durch nebeneinander vorkommende Arten
                                                                     ist essentiell für das Management von Grünlandgebieten
                                                                     und die Implementierung effizienter Schutzkonzepte. Wir
                                                                     quantifizierten die Meidung von Hecken durch Wach-
Communicated by T. Gottschalk.                                       telkönige und vier weiteren Wiesensingvogelarten in
                                                                     Westfrankreich. Wie erwartet, mieden alle Arten Hecken-
A. G. Besnard and Y. Fourcade contributed equally to this work.      strukturen, wobei der Einfluss bei Wachtelkönigen weniger
                                                                     ausgeprägt war. Wir nehmen an, dass dies ein geringeres
Electronic supplementary material The online version of this
article (doi:10.1007/s10336-015-1281-7) contains supplementary       Prädationsrisiko zugunsten der größeren und unauffällige-
material, which is available to authorized users.                    ren Art widerspiegeln könnte. Andererseits könnte durch
                                                                     Gebüschvegetation die soziale Kommunikation bei Wach-
& Yoan Fourcade
  yoanfourcade@gmail.com
                                                                     telkönigen weniger behindert sein als bei Singvögeln.
                                                                     Dennoch bleiben die Mechanismen, die für das beobachtete
1
     GECCO, Université d’Angers, Angers, France                     Muster verantwortlich sind, unklar. Gleichwohl bietet diese
2
     UMR CNRS 6554 LETG, Université d’Angers, Angers,               Studie eine allgemeine Technik, die zur Abschätzung der
     France                                                          Meidung von Habitaträndern angewendet werden kann.

                                                                                                                       123
J Ornithol

Diese wichtigen Informationen helfen Entschei-                 grassland birds (Winter et al. 2006; Besnard and Secondi
dungsträgern Managementrichtlinien zu verbessern, die         2014). Therefore, the response of birds to the presence of
oftmals Randeffekte nicht mit einbeziehen.                     hedges appears to be an important factor to consider in
                                                               implementing conservation measures.
                                                                   In most parts of the European Union, the management of
                                                               grassland habitats of conservation interest is administered
Introduction                                                   through agri-environmental schemes (AES), which were
                                                               implemented to mitigate the effects of agricultural inten-
The fragmentation of ecosystems is one of the main drivers     sification (Kleijn and Sutherland 2003). Yet many grass-
of biodiversity loss worldwide (Saunders and Hobbs 1991;       land species continue to decline, and some habitats such as
Fischer and Lindenmayer 2007; Haddad et al. 2015). It          floodplain meadows are still threatened (Krause et al.
often results from habitat destruction, which divides habi-    2011). Grassland-targeted AES usually favour extensive
tats into smaller and more isolated patches (Fahrig 2003).     management through delayed mowing and banning or
Fragmentation may also occur with the introduction of          reducing the use of fertilization, with no consideration of
linear structures such as roads (Lesbarrères and Fahrig       the landscape context, which may strongly reduce their
2012) that reduce the size of continuous habitat patches.      effectiveness. For instance, subsidizing extensive meadows
Fragmentation not only contributes to the disruption of        in small parcels may fail to protect grassland birds that
connectivity within meta-populations (Baguette et al.          avoid the most fragmented areas (Besnard and Secondi
2013); it also alters the intrinsic characteristics of the     2014). AES would benefit, rather, from finer integration of
remnant patches. Indeed, changes in the shape and size of      habitat selection of target species and consideration of
habitat patches may lead to biodiversity loss due to the       interspecific variation in that response as a means to opti-
species–area relationship (Rybicki and Hanski 2013)—the        mize conservation measures.
link between the number of species found in a habitat and          In western France, the lower reaches of the Loire River
its area—or through edge effects (Fischer and Linden-          catchment are covered by extensive hay meadows that host
mayer 2007). Edge effects are changes in abiotic and biotic    a number of bird populations, including the nationally
conditions at the border between two adjacent habitats         endangered Corncrake (Crex crex), which is a species of
(Murcia 1995) that can prevent the settlement of some          conservation concern in western Europe (Crockford et al.
species in areas close to the habitat boundary.                1997; Green et al. 1997). The decline of the Corncrake
   The edge effect phenomenon in birds has received            population caused by high mortality during mowing (Tyler
considerable attention, particularly with respect to grass-    et al. 1998) was the main reason for implementing AES on
land birds, as this heterogeneous group faces a severe         these floodplain grasslands. These measures were expected
decline worldwide (Donald et al. 2001), largely caused by      to benefit the entire grassland community (Wilkinson et al.
agriculture intensification and fragmentation by roads or      2012), including grassland passerines. While these species
urbanization. The habitats of grassland birds in many areas    are known to be sensitive to patch size and hedgerow
are subject to fragmentation by wooded patches and             density (Besnard and Secondi 2014), responses to edge
hedgerows that are otherwise considered beneficial for         proximity—both among individual passerine species and in
biodiversity. These landscape features contribute signifi-     the Corncrake, the flagship species—have never been
cantly to edge effects in many grassland bird species          quantified. Since differences in landscape requirements
(Fonderflick et al. 2013). Because individuals tend to avoid   among species remain unknown, it is difficult to determine
settling near wooded hedges (Bollinger and Gavin 2004),        whether the whole bird community is optimally protected
local density is generally higher in large un-fragmented       by current conservation schemes. In the present study,
patches (Vickery et al. 1994). This pattern, extensively       therefore, we quantify and compare hedgerow avoidance
described in North American grassland birds (e.g., Imbeau      by the Corncrake and the main passerine species of the
and Desrochers 2002; Ribic et al. 2009; Sliwinski and          study area, and we propose a new method for quantification
Koper 2012), has often been attributed to higher parasitism    of edge avoidance.
and predation rates near hedges (Whittingham and Evans
2004). Empirical support of these hypotheses is scarce
(Paton 1994; Davis et al. 2006; Benson et al. 2013; Perkins    Materials and methods
et al. 2013), and thus the process or combination of pro-
cesses driving edge avoidance in grassland birds remains       Study area and species sampling
unclear. Regardless of the mechanism involved, studies
have shown that patch size and hedgerow proximity are          The study area covers ca. 50,000 ha of floodplains along
major predictors of distribution and breeding success for      the lower 200 km of the Loire River and its main

123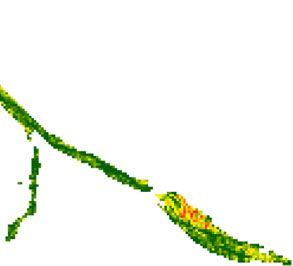
J Ornithol

                                 Hedgerow density (m/ha)
                                       328

                                         0
                                 Watercourse

                   0            20           40 Km

Fig. 1 Map of the study area showing the variation in hedgerow density (expressed in m/ha in each 250 9 250 m grid cell). The upper-left inset
shows the location of the study area in western Europe

tributaries (Fig. 1). The primary habitat type is grassland,             by LPO Anjou, a local ornithological NGO [non-govern-
representing 76 % of the land use across the area                        mental organisation], but the most complete sampling of
(37,800 ha). Patches of crops and woodlands represent 7 %                calling males is carried out only for national surveys, fol-
(3600 ha) and 16 % (8100 ha), respectively, of the entire                lowing a designated protocol. The most recent and com-
study area. Traditional land use includes hedgerows, but                 plete national survey available was conducted in 2006, with
their density varies greatly within the area, with patch size            the result that Corncrake data were a few years older than
ranging from approximately 1 to 250 ha (Fig. 1). Five                    passerines and landscape data. However, land use can be
species dominate the grassland bird community: four                      considered constant in the area on this time scale, given the
passerines—the Whinchat (Saxicola rubetra), Corn bunting                 technical constraints due to flooding and AES incentives.
(Emberiza calandra), Yellow wagtail (Motacilla flava) and                Corncrakes were surveyed at night between 11 p.m. and 3
Reed bunting (Emberiza schoeniclus)—and a rail species,                  a.m. All meadows were visited at least twice during the
the Corncrake (Crex crex). Whinchat and Corncrake                        breeding season (May–June). The location of each calling
numbers have declined drastically over recent decades, in                male was estimated by the observer from at least two
both the study area and most of western Europe, as a result              distant points. All observations were compiled at the end of
of agriculture intensification (Fuller et al. 1995; Green et al.         the season to remove duplicate individuals and to estimate
1997). Delayed mowing has been implemented as part of                    territory centres. Because it is more difficult to determine
agri-environmental schemes to mitigate the effects of grass              the precise location of a Corncrake than of a passerine, we
cutting on Corncrake breeding, which has contributed to                  verified the robustness of our results to errors of location
maintaining extensive practices. As a consequence, most                  assignment in the field. Thus we created ten jittered data-
grasslands within the study area are mown annually in June               sets in which Corncrake occurrences were moved randomly
or July, with little to no fertilizer application.                       within a 50-m buffer around their original locations, and
   Most of the grasslands were surveyed once during the                  the statistical models described below were also computed
2009, 2010, 2011 or 2013 breeding seasons (April–June) to                using these datasets.
record passerine occurrences. Sites were visited during the
peak of breeding activity, between sunrise and noon, in                  GIS and statistical analyses
good weather conditions with low wind and no precipita-
tion in order to ensure optimal detectability. Grasslands                Land use was mapped by digitizing grassland, woodland
were travelled on foot, and all birds encountered by the                 and cropland patches using aerial photographs (BD OrthoÒ
observer and confirmed by visual contact (using binoculars               IGN, pictures taken in 2011) and ArcGIS 10 (Esri), and
and spotting scopes) were reported on IGNÒ 1/25,000 maps                 hedgerows, i.e., linear wooded structures, were similarly
and then digitized on GIS [geographic information sys-                   digitized. We assessed landscape characteristics around
tems] software. This protocol allowed a nearly exhaustive                bird occurrences in buffers with a radius ranging from 10 to
survey of grassland sites, with constant sampling intensity.             1000 m, in increments of 10 m (400 buffer sizes in total).
The Corncrake is nocturnal and remains hidden in vege-                   Two types of data were extracted from these buffers: (1)
tation, and could not be sampled using the same protocol as              the proportion of grassland area in buffers compared to all
that used for passerines. The species is annually surveyed               habitat types (grassland, woodland and cropland in the

                                                                                                                                  123
J Ornithol

study area), and (2) hedgerow density, calculated as the           filters for the Yellow wagtail and a single filter for the other
total hedgerow length divided by the sum of the areas of           species. Spatial autocorrelation in random points was best
grassland, woodland and cropland. In addition to bird              described by 17 filters. Again, a spatial null model was
locations, we extracted the same landscape data from a set         computed using only the spatial filters as fixed effect and
of 1000 points randomly distributed in grasslands across           was compared with the full model using AIC. Partial
the study area to determine the baseline if birds settled at       regression plots showing the relationship between the
random in habitat patches. All GIS analyses were per-              proportion of grassland or hedgerow density and the spatial
formed using a Python routine under ArcGIS 10 (Esri).              scale (buffer radius) for each species were represented
    In order to assess the response of each species to land-       using the ‘‘visreg’’ R package (Breheny and Burchett
scape at all scales, we computed statistical models linking        2015).
grassland proportion and hedgerow density to buffer radius             We then quantified the influence of hedgerow proximity
(log-transformed to linearize the relationship). For hedge-        on bird presence more precisely. For each bird occurrence
row density, we used a compound Poisson general linear             and random point, we extracted the distance to the nearest
mixed model with a Tweedie distribution of errors to               hedgerow, and binned values in 20-m distance classes to
account for the fact that our response variables contained         obtain occurrence frequency as a function of distance to
an excess of null values. Grassland proportion was mod-            hedgerow. These raw data were transformed as a propor-
elled with a linear mixed model after logit transformation         tion of total occurrences across distances. Second, for each
of the response variable. Tweedie mixed models were                distance class and each species, we calculated the deviation
computed using the ‘‘cplm’’ R package (Zhang 2014),                between the observed proportion and the expected pro-
while linear mixed models were computed using the                  portion of occurrences estimated by the random points. We
‘‘lme4’’ R package (Bates et al. 2014). We included spatial        then modelled the relationship between the deviation and
filters as co-variables in all statistical models to control for   the distance to hedgerow by nonlinear regression. Prelim-
spatial autocorrelation. Spatial filters are eigenvectors          inary investigations showed that the most relevant function
extracted from the geographic coordinates of occurrences           was a damped sine wave-shaped function with the fol-
by a principal coordinate analysis on the distance matrix          lowing equation: difference vs: random ¼ A  expðc
[spatial eigenvector mapping, Diniz-Filho and Bini (2005);         distanceÞ  cosðx  distance þ uÞ  B. The unknown
Dormann et al. (2007)]. We selected eigenvectors based on          coefficients were estimated using the nonlinear least
the broken-stick method (Diniz-Filho et al. 1998), which           squares estimate function implemented in R (R Devel-
assumes that eigenvectors whose observed eigenvalue                opment Core Team 2013). The distance under which the
exceeds the expected eigenvalue are adequate to describe           modelled proportion of bird occurrence was lower than
spatial autocorrelation in the dataset. Spatial eigenvectors       the expected proportion was estimated using the ‘‘in-
and their associated eigenvalues were calculated with the          vestr’’ R package (Greenwell and Schubert Kabban
‘‘codep’’ R package.                                               2014).
    To test whether responses significantly differed among
species, we first computed models using the full dataset
with buffer radius, species and spatial filters (18 selected)      Results
included as fixed effects, while point IDs were included as
random effects. For each response variable, we also com-           Overall, we recorded 1602 bird occurrences: 595 Whin-
puted models including only the spatial filters as fixed           chats, 182 Corn buntings, 273 Yellow wagtails, 212 Reed
effect and point IDs as random effects, hereafter referred to      buntings and 340 Corncrakes. There was a significant
as ‘‘spatial models,’’ thus describing only the spatial            species effect in the proportion of grassland area around
information regarding the distribution of points. We also          occurrences, as shown by the difference in AIC values
computed an additional type of model excluding species             between the full model and the spatial model or the model
identity from the fixed effects. We extracted the Akaike           that did not include species identity as explanatory variable
information criterion (AIC) from these models to highlight         (Table 1). Species models were all significantly more
the most significant effects.                                      accurate than spatial models (Table 2, all DAIC [12,000),
    In a second step, to visualise the species-specific            and revealed that all bird species tended to be preferentially
responses to landscape features, we computed the same              found in areas where the proportion of grassland was larger
types of statistical models for each species (and random           than that observed at random locations (Fig. 2a). Corn-
points). Here, grassland proportion and hedgerow density           crake response (intercept 5.65; buffer size coefficient
were modelled as a function of buffer radius and spatial           -0.57) was in the same range as that of passerines (range:
filters, with point IDs as random effect. Spatial filters were     intercept 5.23–6.05; buffer size coefficient -0.64 to
extracted for each dataset, resulting in the selection of two      -0.47), and it is noteworthy that the Reed bunting was the

123
J Ornithol
Table 1 Coefficients (±standard-error) and Akaike information criterion (AIC) for models predicting grassland proportion or hedgerow density around occurrences, using the full dataset of
594,201.2
442,034.2
441,917.8
most sensitive species to grassland proportion while the
2,402,263
2,380,777
2,373,925
Whinchat was the least sensitive.
With regard to grassland proportion, the density of
AIC
hedgerows around occurrences was dependent on the spe-
cies considered. The full model gave a much better fit than
0.631 (0.063)
-0.894 (0.053)
Yellow wagtail
the spatial model and the model that did not take species
into account, as revealed by AIC values (Table 1). Again,
species models were significantly better than spatial mod-
els (Table 2, all DAIC [1700). This was not true for
models with random points, but as these include only
random locations, we did not expect them to exhibit a
0.563 (0.073)
-0.971 (0.060)
response different from that of a simple spatial model.
Reed bunting
Interestingly, the responses of individual species high-
lighted that the Corncrake (intercept 2.85; buffer size
coefficient 0.26) was less sensitive to hedgerow density
than passerines (range: intercept -2.70–0.31; buffer size
All models include the 18 spatial filters that describe spatial autocorrelation. Random points are taken as reference for species effect
coefficient 0.56–1.08), especially at small scales, and its
0.549 (0.073)
-0.647 (0.062)
Corn bunting
distribution was by far the closest to the distribution of
random points (intercept 3.59; buffer size coefficient 0.19)
(Fig. 2b). On the contrary, responses differed little between
passerine species regardless of spatial scale considered.
Although they departed slightly from the originals, the
models computed using the jittered Corncrake datasets
0.350 (0.052)
-0.677 (0.045)
showed the same pattern, especially at small scales (sup-
Whinchat
plementary Fig. S1), and had non-overlapping coeffi-
cients with passerines models (supplementary Table S1).
We thus considered that our inferences were robust to the
uncertainty related to Corncrake location.
0.213 (0.066)
-0.269 (0.057)
All species had a lower proportion of occurrences close
to hedgerows than expected by chance (Fig. 3). At 20 m,
Corncrake
the proportion of Reed bunting and Yellow wagtail was
25.0 % lower than expected by chance, and a similar value
was found for the Whinchat (-23.3 %). This deviation was
less pronounced for the Corncrake (-11.0 %) and the Corn
Log buffer radius
bunting (-15.6 %). The distance at which the proportion
-0.565 (0.001)
-0.565 (0.001)
0.327 (0.002)
0.328 (0.002)
of birds crossed the random proportion of presence varied
between 59 m (Corncrake) and 104 m (Reed bunting). The
three other species had intermediate values (Whinchat
76 m, Corn bunting 85 m, Yellow wagtail 88 m).
2.271 (0.017)
5.633 (0.019)
5.922 (0.065)
4.126 (0.012)
2.256 (0.015)
2.410 (0.028)
Discussion
Intercept
In this study, we compared the magnitude of hedgerow
avoidance among four co-occurring bird species in western
France. Although these four species were thought to rely on
Excluding species effect
Excluding species effect
the same type of grassland habitat, our results provide
Grassland proportion
evidence of interspecific variation in edge avoidance. We
Hedgerow density
observed no clear evidence of differential habitat selection
Spatial model
Spatial model
with regard to the proportion of meadow. In contrast, we
Full model
Full model
occurrences
found that all species exhibited a pattern of hedgerow
Models
avoidance, a response that had previously been suggested
in these bird species (Besnard and Secondi 2014). We
123J Ornithol
Table 2 Coefficients
Models Intercept Log buffer radius AIC AIC sp
(±standard error) for models
predicting grassland proportion Grassland proportion
or hedgerow density around
occurrences, for each dataset of Random 5.436 (0.033) -0.546 (0.002) 169,572.5 1,018,515.0
occurrences (random points and Corncrake 5.646 (0.050) -0.565 (0.004) 53,285.4 70,757.0
five bird species) Whinchat 6.025 (0.040) -0.641 (0.003) 105,311.4 146,658.3
Corn bunting 6.046 (0.073) -0.621 (0.005) 30,240.9 43,162.1
Reed bunting 5.584 (0.061) -0.506 (0.004) 34,925.4 46,268.3
Yellow wagtail 5.230 (0.068) -0.468 (0.004) 46,836.9 58,857.8
Hedgerow density
Random 3.590 (0.020) 0.194 (0.003) 1,021,413.0 227,394.2
Corncrake 2.849 (0.039) 0.261 (0.005) 285,920.7 287,685.3
Whinchat 0.215 (0.030) 0.650 (0.005) 516,739.9 524,721.6
Corn bunting 0.307 (0.054) 0.563 (0.010) 159,178.9 163,252.5
Reed bunting -2.695 (0.061) 1.079 (0.013) 168,521.0 174,140.5
Yellow wagtail -1.750 (0.049) 0.928 (0.010) 226,751.8 236,333.3
The Akaike information criterion (AIC) is given for each model, as well as for spatial models including
only spatial filters (AIC sp)
(a) areas with greater hedgerow density than passerines.
Likewise, the distance to the nearest hedgerow below
which fewer birds than expected were found was shorter
for the Corncrake. These new results provide essential data
for the management of grassland areas and the imple-
mentation of conservation schemes that can benefit the
entire community of grassland birds.
The analysis of land use surrounding occurrences showed
that birds settled in areas with a higher proportion of grass-
land than expected at random. This is congruent with several
studies highlighting area sensitivity in grassland birds
(Winter and Faaborg 1999; Johnson and Igl 2001; Ribic et al.
2009), i.e., they occur at higher densities in large patches of
suitable habitats—grasslands in the present case—than in
(b) small and fragmented patches (Robbins 1979). The fact that
the Reed bunting appeared to be the most sensitive species to
the proportion of grassland is, at first glance, intriguing.
Indeed, its main habitat is wetland rather than grassland per
se (Brickle and Peach 2004). However, the maintenance of
hay meadows in the area is often associated with high risk of
flooding, which prevents the implementation of other agri-
cultural activities. Therefore, large patches of grasslands are
now frequently located within the wettest areas, flooded
during several weeks or months per year, which could
explain why Reed buntings are primarily found in such
places rather than in more heterogeneous and drier areas. In
general, area sensitivity might be explained by mechanisms
Fig. 2 Partial regression plot showing the response of the five species involving patch size itself, such as higher food resources,
studied to a the proportion of grassland and b the density of microclimate, social attraction or vegetation structure (Ribic
hedgerows. The pattern resulting from 1000 random points is also
et al. 2009). However, this pattern is likely driven at least in
plotted
part by edge avoidance, a phenomenon we highlighted with
quantified this pattern for the first time for each species, the apparent avoidance of hedgerows by our study species.
revealing that avoidance was weaker for the Corncrake Historically, edge avoidance in grassland birds has been
than for passerines. Indeed, Corncrakes were observed in largely attributed to elevated predation risk close to parcel
123J Ornithol
Fig. 3 Difference between the observed and expected proportions linear regression and its 95 % confidence intervals. The dotted
(based on 1000 random points laid in grassland patches) of bird vertical line shows the distance at which bird occurrence proportion
occurrences plotted against the distance to the nearest hedgerow, for crosses the expected (horizontal line). The bottom-right box indicates
the five bird species. The shaded grey intervals show the fitted non- this minimum distance to the nearest hedgerow for each species
boundaries, and especially wooded hedgerows (Whitting- An alternative and non-exclusive hypothesis is that dif-
ham and Evans 2004). However, most empirical studies ferences in social behaviour could be responsible for the
have failed to demonstrate such a process (Lahti 2001; observed differences in hedgerow avoidance between
Renfrew et al. 2005). Nevertheless, this hypothesis may Corncrake and passerines. Corncrake males emit loud
explain the differences observed between Corncrake and broadband calls at night to attract mates (Tyler and Green
passerines. Although predation by feral cats or mustelids 1996) and deter competitors (Budka and Osiejuk 2013).
has been reported for adult Corncrakes (Green et al. 1997), Such a signal propagating across dense vegetation (Re˛k and
their vulnerability to predators using hedgerows is likely Osiejuk 2011) and through hedgerows, thus enabling night
lower than that for passerines. Indeed, passerine behaviour surveys, allows for social communication even in highly
may increase the risk of predation by visual predators. fragmented areas. In this respect, although a strict grassland
While Corncrakes remain hidden in the vegetation and are specialist, the Corncrake frequently makes use of isolated
essentially active at night (Schäffer and Koffijberg 2004), vertical structures like bushes as singing sites (Schäffer and
passerines are diurnal. They fly above the vegetation top Koffijberg 2004). In contrast, passerines rely on softer songs
and use the tallest swards as perching sites, which may aid and visual displays (Odeen and Bjorklund 2003), which are
in the detection of nest sites close to hedgerows (Ribic partly or entirely blocked by vertical hedges. Moreover,
et al. 2009), or at least induce a higher perception of pre- conspecific attraction can be an important driver of habitat
dation risk. Given their highly dissimilar body size selection in grassland passerines (Ahlering et al. 2006), and
(Corncrake 165 g; passerines 17–47 g), we might also thus the greater edge avoidance by passerine species may be
assume a more limited susceptibility to small predators for a consequence of their tendency to cluster in large un-
Corncrakes than passerines. fragmented patches to enhance social interaction.
123J Ornithol
In conclusion, we showed that the distribution pattern Baguette M, Blanchet S, Legrand D, Stevens VM, Turlure C (2013)
of co-occurring grassland birds differed according to the Individual dispersal, landscape connectivity and ecological
networks. Biol Rev 88:310–326
presence of hedgerows. Such vertical structures contribute Batáry P, Matthiesen T, Tscharntke T (2010) Landscape-moderated
to fragment habitat, rendering patches unsuitable when importance of hedges in conserving farmland bird diversity of
their shape or size does not allow settlement. The nega- organic vs. conventional croplands and grasslands. Biol Conserv
tive impact of hedgerows and wooded edges on habitat 143:2020–2027
Bates D, Maechler M, Bolker B, Walker S (2014) lme4: linear mixed-
selection in grassland birds has been demonstrated in effects models using eigen and S4. http://cran.r-project.org/
many species (Fletcher and Koford 2003; Renfrew and package=lme4
Ribic 2008). In response to these results, the removal of Benson T, Chiavacci S, Ward M (2013) Patch size and edge
hedgerows in order to enhance the density of grassland proximity are useful predictors of brood parasitism but not nest
survival of grassland birds. Ecol Appl 23:879–887
passerine populations has been tested with success in Besnard AG, Secondi J (2014) Hedgerows diminish the value of
North America (Ellison et al. 2013). However, this effect meadows for grassland birds: potential conflicts for agri-
remains sometimes unrecognized, especially when environment schemes. Agric Ecosyst Environ 189:21–27
hedgerows are traditional practices and have a high con- Bollinger EK, Gavin TA (2004) Responses of nesting bobolinks
(Dolichonyx oryzivorus) to habitat edges. Auk 121:767–776
servation value. Thus they are often encouraged in light Breheny P, Burchett W (2015) visreg: visualization of regression
of their positive impact on overall biodiversity (Batáry models. http://cran.r-project.org/package=visreg
et al. 2010). Grassland birds, however, are highly spe- Brickle NW, Peach WJ (2004) The breeding ecology of Reed
cialized and need un-fragmented grassland patches in buntings Emberiza schoeniclus in farmland and wetland habitats
in lowland England. Ibis 146:69–77
which to settle and breed. In this context, the conservation Budka M, Osiejuk TS (2013) Neighbour–stranger call discrimination
of hedgerows and grassland birds within the same area in a nocturnal rail species, the corncrake Crex crex. J Ornithol
may result in conflicting effects that could be detrimental 154:685–694
to the grassland bird community (Besnard and Secondi Crockford N, Green RE, Rocamora G et al (1997) A summary of the
European action plan for the corncrake Crex crex. Vogelwelt
2014). Moreover, in our study area, AES are strictly 118:169–173
defined to match the requirements of the Corncrake Davis SK, Brigham RM, Shaffer TL, James PC (2006) Mixed-grass
phenology, and are implemented in its breeding areas. prairie passerines exhibit weak and variable responses to patch
With the Corncrake considered here as an umbrella spe- size. Auk 123:807–821
Diniz-Filho JAF, Bini LM (2005) Modelling geographical patterns in
cies, AES are expected to benefit other grassland birds as species richness using eigenvector-based spatial filters. Glob
well. In view of our results, however, it appears that their Ecol Biogeogr 14:177–185
habitat requirements differ, since some grassland patches Diniz-Filho JAF, de Sant’Ana CER, Bini LM (1998) An eigenvector
hosting Corncrakes may be unsuitable for passerines method for estimating phylogenetic inertia. Evolution
52:1247–1262
because of the presence of hedgerows. Therefore, varia- Donald PF, Green RE, Heath MF (2001) Agricultural intensification
tion in edge avoidance should be better accounted for in and the collapse of Europe’s farmland bird populations. Proc R
the definition of protected areas. More broadly, a better Soc Lond B Biol Sci 268:25–29
integration of the landscape context would appear to be a Dormann CF, McPherson JM, Araújo MB et al (2007) Methods to
account for spatial autocorrelation in the analysis of species
valuable means of improving agri-environmental schemes. distributional data: a review. Ecography 30:609–628
Ellison KS, Ribic CA, Sample DW, Fawcett MJ, Dadisman JD (2013)
Acknowledgments This study was funded by the Plan Loire Impacts of tree rows on grassland birds and potential nest
Grandeur Nature, European Regional Development Fund (ERDF), predators: a removal experiment. PLoS One 8:e59151
Région des Pays de la Loire, Agence de l’eau Loire-Bretagne, Angers Fahrig L (2003) Effects of habitat fragmentation on biodiversity.
Loire Métropole, Direction Régionale de l’Environnement, de Annu Rev Ecol Syst 34:487–515
l’Aménagement et du Logement (DREAL), and Département Maine- Fischer J, Lindenmayer D (2007) Landscape modification and habitat
et-Loire. We are grateful to the Conservatoire Régional des Rives de fragmentation: a synthesis. Glob Ecol Biogeogr 16:265–280
la Loire et de ses Affluents (CORELA) for providing us a portion of Fletcher RJ, Koford RR (2003) Spatial responses of bobolinks
the environmental data. We thank Ligue de Protection des Oiseaux (Dolichonyx Oryzivorus) near different types of edges in
(LPO Anjou) and all volunteer ornithologists for Corncrake data, as Northern Iowa. Auk 120:799–810
well as Guillaume Berdin for his preliminary analyses of the land- Fonderflick J, Besnard A, Martin J-L (2013) Species traits and the
scape data. This project is part of Zone Atelier Loire. Field data response of open-habitat species to forest edge in landscape
collection complied with current laws of France. mosaics. Oikos 122:42–51
Fuller R, Gregory R, Gibbons DW et al (1995) Population declines
and range contractions among lowland farmland birds in Britain.
Conserv Biol 9:1425–1441
References Green RE, Rocamora G, Schäffer N (1997) Populations, ecology and
threats to the corncrake Crex crex in Europe. Vogelwelt
Ahlering MA, Johnson DH, Faaborg J (2006) Conspecific attraction 118:117–134
in a grassland bird, the baird’s sparrow. J Field Ornithol Greenwell BM, Schubert Kabban CM (2014) investr: an R package
77:365–371 for inverse estimation. R J 6:90–100
123J Ornithol
Haddad NM, Brudvig LA, Clobert J et al (2015) Habitat fragmen- Ribic CA, Koford RR, Herkert JR et al (2009) Area sensitivity in
tation and its lasting impact on Earth’s ecosystems. Sci Adv North American grassland birds: patterns and processes. Auk
1:e1500052 126:233–244
Imbeau L, Desrochers A (2002) Area sensitivity and edge avoidance: Robbins CS (1979) Effect of forest fragmentation on bird populations.
the case of the three-toed woodpecker (Picoides tridactylus) in a In: Management of North Central and Northeastern forests for
managed forest. For Ecol Manag 164:249–256 nongame birds, proceedings of the workshop. US Forest Service,
Johnson D, Igl L (2001) Area requirements of grassland birds: a St. Paul, MN, USA, p 198–212
regional perspective. Auk 118:24–34 Rybicki J, Hanski I (2013) Species–area relationships and extinctions
Kleijn D, Sutherland WJ (2003) How effective are European agri- caused by habitat loss and fragmentation. Ecol Lett 16:27–38
environment schemes in conserving and promoting biodiversity? Saunders DA, Hobbs RJ (1991) Biological consequences of ecosys-
J Appl Ecol 40:947–969 tem fragmentation: a review. Conserv Biol 5:18–32
Krause B, Culmsee H, Wesche K, Bergmeier E, Leuschner C (2011) Schäffer N, Koffijberg K (2004) Crex crex corncrake. BWP Updat
Habitat loss of floodplain meadows in north Germany since the 6:57–78
1950s. Biodivers Conserv 20:2347–2364 Sliwinski MS, Koper N (2012) Grassland bird responses to three edge
Lahti DC (2001) The ‘‘edge effect on nest predation’’ hypothesis after types in a fragmented mixed-grass prairie. Avian Conserv Ecol
twenty years. Biol Conserv 99:365–374 7:6
Lesbarrères D, Fahrig L (2012) Measures to reduce population Tyler GA, Green RE (1996) The incidence of nocturnal song by male
fragmentation by roads: what has worked and how do we know? corncrakes Crex crex is reduced during pairing. Bird Study
Trends Ecol Evol 27:374–380 43:214–219
Murcia C (1995) Edge effects in fragmented forests: implications for Tyler GA, Green RE, Casey C (1998) Survival and behaviour of
conservation. Trends Ecol Evol 10:58–62 corncrake Crex crex chicks during the mowing of agricultural
Odeen A, Bjorklund M (2003) Dynamics in the evolution of sexual grassland. Bird Study 45:35–50
traits: losses and gains, radiation and convergence in yellow Vickery PD, Hunter ML, Melvin SM (1994) Effects of habitat area on
wagtails (Motacilla flava). Mol Ecol 12:2113–2130 the distribution of grassland birds in maine. Conserv Biol
Paton PWC (1994) The effect of edge on avian nest success: how 8:1087–1097
strong is the evidence? Conserv Biol 8:17–26 Whittingham MJ, Evans KL (2004) The effects of habitat structure on
Perkins DG, Perlut NG, Strong AM (2013) Minor fitness benefits for predation risk of birds in agricultural landscapes. Ibis
edge avoidance in nesting grassland birds in the Northeastern 146:210–220
United States. Auk 130:512–519 Wilkinson NI, Wilson JD, Anderson GQA (2012) Agri-environment
R Development Core Team (2013) R: a language and environment for management for corncrake Crex crex delivers higher species
statistical computing. R Foundation for Statistical Computing, richness and abundance across other taxonomic groups. Agric
Vienna Ecosyst Environ 155:27–34
Re˛k P, Osiejuk TS (2011) No male identity information loss during Winter M, Faaborg J (1999) Patterns of area sensitivity in grassland-
call propagation through dense vegetation: the case of the nesting birds. Conserv Biol 13:1424–1436
corncrake. Behav Process 86:323–328 Winter M, Johnson DH, Shaffer JA, Donovan TM, Svedarsky WD
Renfrew RB, Ribic CA (2008) Multi-scale models of grassland (2006) Patch size and landscape effects on density and nesting
passerine abundance in a fragmented system in Wisconsin. success of grassland birds. J Wildl Manag 70:158–172
Landsc Ecol 23:181–193 Zhang W (2014) cplm: compound poisson linear models. http://cran.r-
Renfrew RB, Ribic CA, Nack JL (2005) Edge avoidance by nesting project.org/package=cplm
grassland birds: a futile strategy in a fragmented landscape. Auk
122:618
123You can also read