LIBYA ECONOMIC MONITOR - Spring 2021 - Middle East and North Africa Region - Public Documents
←
→
Page content transcription
If your browser does not render page correctly, please read the page content below
LIBYA ECONOMIC
      MONITOR

                            Spring 2021

        Middle East and North Africa Region
Libya
Economic Monitor

           Spring 2021

   Middle East and North Africa Region
© 2021 International Bank for Reconstruction and Development / The World Bank
1818 H Street NW
Washington DC 20433
Telephone: 202-473-1000
Internet: www.worldbank.org

This work is a product of the staff of The World Bank with external contributions. The findings, interpretations, and conclusions
expressed in this work do not necessarily reflect the views of The World Bank, its Board of Executive Directors, or the
governments they represent.

The World Bank does not guarantee the accuracy, completeness, or currency of the data included in this work and does not
assume responsibility for any errors, omissions, or discrepancies in the information, or liability with respect to the use of or
failure to use the information, methods, processes, or conclusions set forth. The boundaries, colors, denominations, and other
information shown on any map in this work do not imply any judgment on the part of The World Bank concerning the legal
status of any territory or the endorsement or acceptance of such boundaries.

Nothing herein shall constitute or be construed or considered to be a limitation upon or waiver of the privileges and immunities
of The World Bank, all of which are specifically reserved.

Rights and Permissions

The material in this work is subject to copyright. Because The World Bank encourages dissemination of its knowledge, this
work may be reproduced, in whole or in part, for noncommercial purposes as long as full attribution to this work is given.

Any queries on rights and licenses, including subsidiary rights, should be addressed to World Bank Publications, The World
Bank Group, 1818 H Street NW, Washington, DC 20433, USA; fax: 202-522-2625; e-mail: pubrights@worldbank.org.

Cover photos: Shutterstock.
Publication design and layout by The Word Express, Inc.
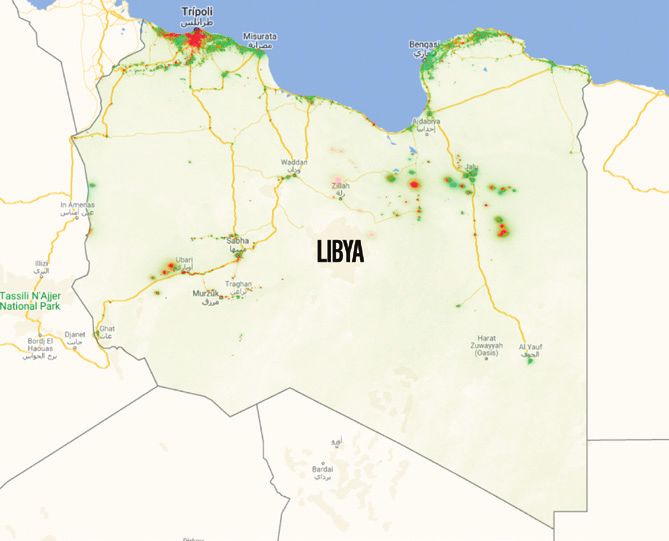
TABLE OF CONTENTS
Abbreviations  .  .  .  .  .  .  .  .  .  .  .  .  .  .  .  .  .  .  .  .  .  .  .  .  .  .  .  .  .  .  .  .  .  .  .  .  .  .  .  .  .  .  .  .  .  .  .  .  .  .  .  .  .  .  .  .  .  . v

Preface  .  .  .  .  .  .  .  .  .  .  .  .  .  .  .  .  .  .  .  .  .  .  .  .  .  .  .  .  .  .  .  .  .  .  .  .  .  .  .  .  .  .  .  .  .  .  .  .  .  .  .  .  .  .  .  .  .  .  .  .  . vii

Executive Summary  .  .  .  .  .  .  .  .  .  .  .  .  .  .  .  .  .  .  .  .  .  .  .  .  .  .  .  .  .  .  .  .  .  .  .  .  .  .  .  .  .  .  .  .  .  .  .  .  .  .  .  .  .  . ix

Chapter 1: Recent Developments  .  .  .  .  .  .  .  .  .  .  .  .  .  .  .  .  .  .  .  .  .  .  .  .  .  .  .  .  .  .  .  .  .  .  .  .  .  .  .  .  .  .  .  .  . 1
   Economic Developments . . . . . . . . . . . . . . . . . . . . . . . . . . . . . . . . . . . . . . . . . . . . . . . . . . . . . . . . . . . . . . . . . . . . . . .1
   Social Developments . . . . . . . . . . . . . . . . . . . . . . . . . . . . . . . . . . . . . . . . . . . . . . . . . . . . . . . . . . . . . . . . . . . . . . . . . . 8

Chapter 2: Outlook . . . . . . . . . . . . . . . . . . . . . . . . . . . . . . . . . . . . . . . . . . . . . . . . . . . . . .15
   Economic Policy Agenda . . . . . . . . . . . . . . . . . . . . . . . . . . . . . . . . . . . . . . . . . . . . . . . . . . . . . . . . . . . . . . . . . . . . . .15
   2021 Scenario . . . . . . . . . . . . . . . . . . . . . . . . . . . . . . . . . . . . . . . . . . . . . . . . . . . . . . . . . . . . . . . . . . . . . . . . . . . . . . .17

Appendix  .  .  .  .  .  .  .  .  .  .  .  .  .  .  .  .  .  .  .  .  .  .  .  .  .  .  .  .  .  .  .  .  .  .  .  .  .  .  .  .  .  .  .  .  .  .  .  .  .  .  .  .  .  .  .  .  .  .  .  . 23
   Selected Macroeconomic Indicators . . . . . . . . . . . . . . . . . . . . . . . . . . . . . . . . . . . . . . . . . . . . . . . . . . . . . . . . . . . . 23

                                                                                                                                                                                                     iii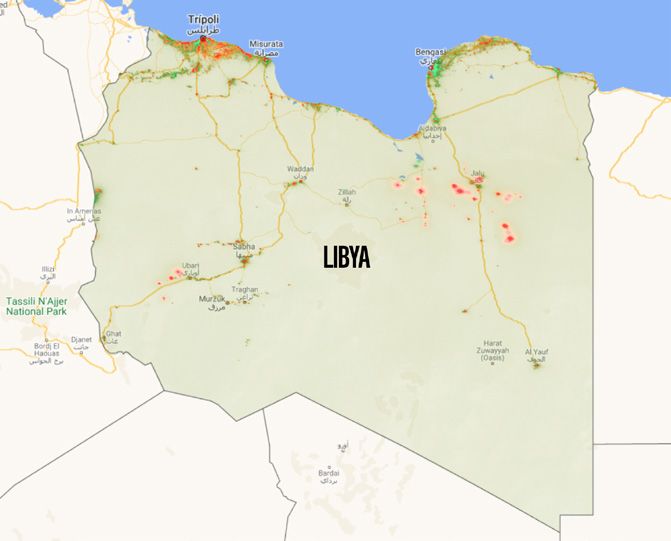
List of Figures
        Figure 1       Oil Production – Million Barrels Per Day . . . . . . . . . . . . . . . . . . . . . . . . . . . . . . . . . . . . . . . . . . . . . .2
        Figure 2       GDP Growth – Percent Year-on-Year . . . . . . . . . . . . . . . . . . . . . . . . . . . . . . . . . . . . . . . . . . . . . . . . . 2
        Figure B1.1    Night-Time Light Emissions in Libya  . . . . . . . . . . . . . . . . . . . . . . . . . . . . . . . . . . . . . . . . . . . . . . . . . 3
        Figure 3       Government Revenues and Expenditures – LYD Billions . . . . . . . . . . . . . . . . . . . . . . . . . . . . . . . .4
        Figure 4       Government Revenues and Expenditures, West and East – LYD Billions . . . . . . . . . . . . . . . . . . 4
        Figure 5       Government Debt Stock – % of GDP . . . . . . . . . . . . . . . . . . . . . . . . . . . . . . . . . . . . . . . . . . . . . . . . . 5
        Figure 6       Government Debt Flows, West and East – LYD Billions . . . . . . . . . . . . . . . . . . . . . . . . . . . . . . . . . 5
        Figure 7       Exports and Imports of Goods – US$ Billions . . . . . . . . . . . . . . . . . . . . . . . . . . . . . . . . . . . . . . . . . 6
        Figure 8       Money Supply – Annual Change, in Percent . . . . . . . . . . . . . . . . . . . . . . . . . . . . . . . . . . . . . . . . . . 7
        Figure 9       Currency Outside of Banks – LYD Billions and Annual Change in Percent  . . . . . . . . . . . . . . . . 7
        Figure 10      Exchange Rate – LYD/US$ . . . . . . . . . . . . . . . . . . . . . . . . . . . . . . . . . . . . . . . . . . . . . . . . . . . . . . . . . 7
        Figure B2.1    The Cost of the Minimum Expenditure Basket Increased during 2020 Compared
                       to December 2019 …  . . . . . . . . . . . . . . . . . . . . . . . . . . . . . . . . . . . . . . . . . . . . . . . . . . . . . . . . . . . . . . 9
       Figure B2.2     … with Variation Across Regions Compared to the Average  . . . . . . . . . . . . . . . . . . . . . . . . . . . . . 9
       Figure 11       Cumulative COVID-19 Cases and Deaths . . . . . . . . . . . . . . . . . . . . . . . . . . . . . . . . . . . . . . . . . . . . 12
       Figure 12       Stringency Index and Cumulative COVID-19 Cases  . . . . . . . . . . . . . . . . . . . . . . . . . . . . . . . . . . . 12
       Figure 13       Cumulative COVID-19 Cases in the Maghreb Region – per Million Population  . . . . . . . . . . . . 12
       Figure 14       Cumulative COVID-19 Deaths in the Maghreb Region – per Million Population . . . . . . . . . . . . 12
       Figure 15       Libya’s Score on the Global Health Security Index in 2019 – Index Score
                       (0–100, 100 = Most Favorable Health Security Conditions) . . . . . . . . . . . . . . . . . . . . . . . . . . . . .13
       Figure 16       Fiscal Breakeven Price of Oil – US$ per Barrel . . . . . . . . . . . . . . . . . . . . . . . . . . . . . . . . . . . . . . . 20
       Figure 17       External Breakeven Price of Oil – US$ per Barrel . . . . . . . . . . . . . . . . . . . . . . . . . . . . . . . . . . . . . 20

     List of Tables
        Table 1        Government Revenues and Expenditures – LYD Billions . . . . . . . . . . . . . . . . . . . . . . . . . . . . . . .19

     List of Boxes
        Box 1          Monitoring the Libyan Economy from Space . . . . . . . . . . . . . . . . . . . . . . . . . . . . . . . . . . . . . . . . . . 2
        Box 2          The Cost of Living in Libya: An Analysis Based on the Cost of a
                       Minimum Expenditure Basket (MEB)* for the Average Household . . . . . . . . . . . . . . . . . . . . . . . .9

iv   LIBYA ECONOMIC MONITOR
ABBREVIATIONS
CBL Central Bank of Libya MEB Minimum Expenditure Basket
COVAX COVID-19 Vaccine Access Facility NOC National Oil Company
COVID-19 Coronavirus Disease 2019 NTL Night-time Light
GDP Gross Domestic Product OCHA U.N. Office for the Coordination of
GNA Government of National Accord Humanitarian Affairs
IG Interim Government OPEC Organization of Petroleum Exporting
IMF International Monetary Fund Countries
IOM U.N. International Organization for PFG Petroleum Facilities Guard
Migration SDR Special Drawing Rights
JMMI Joint Market Monitoring Initiative U.N. United Nations
LNA Libyan National Army US$ U.S. dollar
LYD Libyan dinar WFP World Food Programme
MBD Million Barrels per Day WHO World Health Organization
vPREFACE
T
his report is the product of the Middle East Molini (Senior Economist), and Uche Eseosa Ekhator-
and North Africa (MENA) Region of the World Mobayode (Young Professional).
Bank Group. This report was prepared under the direction
The report was prepared by a team led by Harun of Jesko S. Hentschel (Country Director) and Eric Le
Onder (Senior Economist) and comprising Antonio Borgne (Practice Manager). Additional comments
M. Ollero (Macroeconomic Expert), Zied Ouelhazi and advice were provided by Gabriel Sensenbrenner
(Macroeconomic Expert), Dalia Al Kadi (Senior (Program Leader) and Michael G. Schaeffer (Resident
Economist), Ali Ibrahim Almelhem (Economist), Vasco Representative).
viiEXECUTIVE SUMMARY
L
ibya entered 2020 as a divided nation, with economic output and over 90 percent of both fiscal
competing political and military factions revenues and merchandise exports, the results
operating redundant and often conflicting were debilitating. “Lost” revenues from the blockade
systems of governance. The Government of amounted to around US$11 billion for the year,
National Accord (GNA) controlled the country’s according to the Central Bank of Libya in Tripoli.
western regions around the capital Tripoli, while Altogether (including the non-oil effects of the oil
the Interim Government (IG), backed by the Libyan blockade), total fiscal revenues stood at Libyan Dinar
National Army (LNA), controlled most of the eastern, (LYD) 23 billion in 2020, according to the Ministry of
central, and southern parts of the country. The Finance in Tripoli, some 40 percent of total revenues
separate controlling bodies operated on separate earned in 2019. These problems were also conflated
budgets. The Central Bank of Libya was divided into by the COVID-19 pandemic, which inflicted further
parallel branches with Central Bank of Libya in Tripoli economic and social dislocation on a war-torn country
controlling the country’s money supply and foreign with little health related infrastructure and few basic
reserves, with the branch in the east mimicking the health services.
central bank’s currency printing function. The National The plunge in oil revenues sharply
Oil Corporation, based in Tripoli, is solely responsible reduced government spending. The Tripoli-based
for oil exports; but the Petroleum Facilities Guard, government cut total expenditures by 22 percent from
which secures the country’s oil assets, is divided into LYD 46.1 billion in 2019 to LYD 36.2 billion in 2020,
rival western and eastern forces. with wages and salaries accounting for the bulk of
For the most part of 2020, the performance expenditures—LYD 21.9 billion or 61 percent. GNA
of the Libyan economy was the worst in recent announced a decision to cut the salaries of high-
records. In January 2020, a blockade of oil terminals ranking political officials by 40 percent starting in
and oil fields began that lasted nine months, cutting January 2020, and that of all public sector employees
oil output to about 228,000 barrels per day. This was by 20 percent starting in April 2020, but it is not clear
less than one-sixth of 2019 values and comparable whether these decisions were implemented or not.
to the lows experienced subsequent to 2014 after Subsidies, including those for fuel, electricity, water
the country’s civil war. The impact of the blockade, and sewage, sanitation, and medical supply reached
however, was felt with greater immediacy. For the LYD 5.6 billion, or 16 percent of total expenditures.
acutely undiversified Libyan economy, which counts Development expenditures were minuscule for
on oil and gas for over 60 percent of aggregate the year, LYD 1.8 billion or five percent of total
ixexpenditures, compared to LYD 4.6 billion in 2019. All and official rates, also rendering the foreign exchange
capital expenditures projects for 2020 were essentially transactions surcharge unnecessary.
canceled. The economic contraction in 2020 exacer-
Starting in mid-September, growing signs bated the effects of the long-running conflict on
of rapprochement between political/military fac- social conditions and poverty outcomes in the
tions brought much-needed relief to the econ- country. Since the beginning of the conflict, more
omy, albeit an inadequate one. With a ceasefire than half of the health facilities in Libya were either de-
agreement between the Government of National stroyed or were forced to close as a result of shortag-
Accord (GNA) and the Libyan National Army (LNA) in es of medicine and supplies as well as a lack of health
October 2020, oil production and exports rebounded. personnel. Similarly, about 6 percent of schools were
Al Sharara and El Feel oilfields restarted production closed and many more were diverted for use as emer-
and the Sidra and Ras Lanuf ports reopened, en- gency shelters for displaced families. In 2020, these
abling the National Oil Corporation to quickly ramp up trends deepened the socio-economic strife faced by
oil production to 453,000 barrels per day in October, Libyans. The number of people with humanitarian
1.108 million barrels per day in November, and 1.25 needs—food, health services, and protection—rose
million barrels per day in December. On average, the in 2020 over 2019. The number of food insecure
oil production in 2020 is estimated at 405,000 barrels people doubled from 2019 to 2020 to reach 699,000
per day, roughly a third of actual output in 2019 and people (nine percent of the population), with signifi-
under a fourth of the highest output in the last decade cant increases recorded among both displaced and
reported at 1.7 million barrels per day. non-displaced Libyans, according to the U.N. Office
Overall, the 2020 contraction of the Libyan for the Coordination of Humanitarian Affairs (OCHA).
economy is estimated at about 31 percent. The All of these challenges were compounded by the out-
precipitous fall in hydrocarbon output damaged the break of COVID-19 and the measures taken to contain
country’s external balance and fiscal position in 2020, the disease including workplace shutdowns, school
filtering through to weaker government spending, closures, and restraints on mobility. The effects were
reduced private consumption, and lower imports. worse among displaced persons, immigrants, and
The economic collapse also had adverse effects refugees.
on the non-hydrocarbon economy. Water shortages A recent array of negotiations and agree-
were prevalent, with reports of sabotage of water ments foresees a way forward after a decade of
wells. Power outages persisted throughout the year; military conflict and political strife. Following the
only 13 of 27 power plants were functioning. As late ceasefire agreement between the GNA and the LNA,
as mid-December 2020, three months after ports the U.N. Support Mission in Libya confirmed in mid-
were reopened, the government was still urging November that the GNA and the LNA had agreed
consumers to stop queueing at gasoline stations. to hold parliamentary and presidential elections in
The collapse of oil revenues strained the ability of December 2021. The breakthrough was achieved
the monetary and fiscal authorities to defend the through the Libyan Political Dialogue Forum, a meet-
country’s currency peg, and on December 16 for the ing of 75 Libyan delegates held in Tunisia, with a three-
first time in five years, the board of directors of the member Presidency Council headed by Mohamed
Central Bank of Libya, agreed to devalue the currency al-Mnefi and a Prime Minister, Abdelhamid Dabeiba,
from LYD 1.00 = SDR 0.5175 to LYD 1.00 = SDR tasked with forming a Government of National Unity,
0.156 effective January 3, 2021, with the equivalent that will in turn prepare Libya for general elections.
rate to the U.S. dollar at LYD 4.48 = US$1.00 using In addition to these developments, several economic
the current US$1.44 = SDR 1.00 rate. The new rate agreements have also come into fruition. The National
aims to apply to all governmental, commercial, and Oil Corporation and the western and eastern forces of
personal foreign exchange transactions, and largely the Petroleum Facilities Guard agreed in November
remove the growing wedge between black market 2020 to unify the latter’s operations to protect the
x LIBYA ECONOMIC MONITORoil industry’s assets across the country. Budget leading to stronger government consumption and
unification talks between the GNA and the Interim investment, and in turn supporting a recovery in
Government (IG) began in mid-January. private consumption.
There is reason for cautious optimism for The agenda for social policy, institutional
recovery and healing, but downside risks abound. reform, and public action is full and needs urgent
The ceasefire agreement of October 2020 stipulated attention. In addition to the conflict-driven challenges
that all military units and armed groups withdraw from and neglect, Libyans are also increasingly affected by
the front lines, with foreign fighters and mercenaries the COVID-19 pandemic. With relaxation of contain-
transferred to Tripoli and Benghazi before leaving ment measures, the spread of the virus has acceler-
Libya by January 23, 2021. However, the underlying ated. As of end-January 2021, there were 118,632
political and economic division of the country confirmed cases and 1,877 reported deaths due to
has complex roots and competing international COVID-19. This problem is probably under-monitored
influences can make a difference in outcomes. With and compounded by an incapacitated health sector.
major uncertainties associated with these dynamics, More than one in three health facilities in Benghazi
projecting future economic trends is a daunting and one in six in Tripoli were damaged or destroyed,
task. However, if the current rapprochement remains and nearly 20 percent were closed. Surviving health
on track, a significant economic recovery from the centers face critical gaps in medicines and supplies,
2020 slump is within reach in 2021. In light of major as well as a loss of health workers, many of whom
maintenance problems that will limit oil production, were from overseas and have fled amid the violence.
a 1.1 million barrel per day (MBD) production is In the overall ranking of the Global Health Security
possible. As a result, GDP growth is forecast at 67 Index, Libya ranks 168 out of 195 countries. With
percent in 2021 in real terms. Higher international oil these challenges, the rollout of vaccines for the virus
prices—the Bank forecasts crude oil prices to rise to will likely be slow by regional standards, with delays
US$44 per barrel in 2021 from US$41 per barrel in related to territorial insecurity, lack of cold storage fa-
2020—will help support overall rebound in oil output, cilities, and strained public finances.
Executive summary xi1
RECENT
DEVELOPMENTS
Economic Developments in 2019. The blockade was directed by the LNA,
which controls the oil-rich east of the country, and it
The Libyan economy contracted by about 31 was enforced by the eastern faction of the Petroleum
percent in 2020. Oil exports have been the mainstay Facilities Guard, the force tasked with protecting
of the economy since they began over five decades the country’s energy infrastructure. The blockade of
ago, and accounted for roughly 60 percent of GDP in eastern oil ports and the shut-ins at core southwestern
2019. In 2020, however, a drastic cutback in oil and oilfields reduced oil production from 1.169 MBD in 2019
gas production (Figure 1) and exports shrunk the to an average 228,000 barrels per day in the first nine
economy after three years of growth over 2017–19 months of 2020. A ceasefire agreement struck between
(Figure 2).1 With hydrocarbons accounting for 95 the GNA-aligned Presidential Council of Libya and the
percent of merchandise exports and 93 percent of LNA in mid-September allowed the Al Sharara and El
fiscal revenues (excluding foreign exchange fees), Feel oilfields to restart and the Sidra and Ras Lanuf
the precipitous fall in hydrocarbon output damaged ports to reopen, enabling the National Oil Corporation
the country’s external balance and fiscal position to quickly ramp up oil production to 453,000 barrels
in 2020, resulting in weaker government spending, per day in October, 1.108 MBD in November, and 1.25
reduced private consumption, and lower imports. MBD in December. Overall, the average oil production
The economic collapse had adverse effects on the in 2020 is estimated at 405,000 barrels per day, roughly
non-hydrocarbon economy and the value of the a third of actual output in 2019 and under a fourth of the
currency, straining the ability of the monetary and highest annual output achieved in the last decade (1.7
fiscal authorities to defend the country’s currency million barrels per day in 2010).
peg. The overall drag on the economy is reflected in Non-oil activity did not compensate for the
night-time light data, a proxy measure for economic downturn in the oil sector. Although systematic
activity (Box 1).
The blockade of oil and gas export ports, 1
Libya last reported official national accounts data in
beginning in January and lifted in mid-September, 2014. GDP data cited in this report are World Bank staff
cut oil production to less than a third their levels estimates.
1FIGURE 1 • Oil Production FIGURE 2 • GDP Growth
Million Barrels per Day Percent Year-on-Year
1,400 140
120
1,200 100
80
1,000
60
800 40
20
600 0
–20
400 –40
–60
200 –80
0 2016 2017 2018 2019 2020e
Jan-16
Apr-16
Jul-16
Oct-16
Jan-17
Apr-17
Jul-17
Oct-17
Jan-18
Apr-18
Jul-18
Oct-18
Jan-19
Apr-19
Jul-19
Oct-19
Jan-20
Apr-20
Jul-20
Oct-20
GDP Hydrocarbon Nonhydrocarbon
Source: World Bank staff estimates. Source: World Bank staff estimates.
data on non-oil activity is not generally available either machinery, and utility malfunctions hampered farm
on the demand or production side, certain partial production. Water shortages were prevalent in 2020,
figures indicate that the non-oil sectors could not with reports of sabotage of water wells. Power outages
have lifted the economy during the blockade. Cereal persisted throughout the year; only 13 of 27 power
crop production in the country was 5 percent lower plants were functioning. As late as mid-December
in 2020 than in 2019 and crop yield was 12 percent 2020, three months after ports were reopened,
below average, according to the Food and Agriculture the government was still urging consumers to stop
Organization of the United Nations. Insecurity, queueing at gasoline stations; the fuel crunch had
expensive inputs including seeds and tools and been addressed with the arrival of the Anwar Africa
BOX 1. MONITORING THE LIBYAN ECONOMY FROM SPACE
“The first casualty of war is truth” said the U.S. Senator Hiram Johnson during the First World War. Unfortunately, this observation still holds
true today. In modern fragile and conflict affected situations, either by necessity or by design, economic and social data can quickly become
sparse. Libya has not been an exception. With the prolonged conflict, the country’s statistical capacity has taken a heavy blow, and reliable
information regarding national accounts, spatial aspects of the economy, and key socio-demographic indicators have become inaccessible.
But technological progress has begun to facilitate remedies to this problem, albeit in an imperfect manner. With advances in satellite
imagery, and the public availability of systematically collected data, using various remote-sensing indicators as proxy indicators of economic
activity has become more acceptable among economists. This approach can shed light on spatial dynamics of economic activity in Libya.
For the purposes of this Libya Economic Monitor, we explore using low-light imaging (night-time light emissions – NTL) satellite data, the
Visible Infrared Imaging Radiometer Suite, collected by the National Aeronautics and Space Administration and the National Oceanic and
Atmospheric Administration, to analyze the light-emission changes over time. This data series helps to analyze both long-term (2012–
2020) and short-term (2019-May 2020) changes. Figure B1.1 below shows the trends.
Between 2012 and 2019, the Libyan NTL series exhibited a U-shaped pattern. The series was in a gradual decline from the start of tracking,
but this trend accelerated with the onset of the conflict in 2014. By 2016, about 20 percent of the NTLs from 2012 were lost. A large
portion of these losses were concentrated in the eastern part of the country (Figure B1.1, Panel a and Panel c), and were primarily driven
by NTL around major oil fields (flaring and other production driven emissions) (Figure B1.1, Panel d). At the lowest point between 2012 and
2016, the NTL around major oil fields in the East was only at 20 percent of its 2012 value. From 2016 until 2019, the trends were gradually
reversed, and as the NTLs in eastern oil fields rebounded, the aggregate light emissions in Libya recovered almost all losses and reached
back to its 2012 level. In this period, there were some localized losses in western Libya (in Southern Tripoli, for example), however, these
were offset with gains in NTL in other localized settings.
(continued on next page)
2 LIBYA ECONOMIC MONITORBOX 1. MONITORING THE LIBYAN ECONOMY FROM SPACE (continued)
FIGURE B1.1 • Night-Time Light Emissions in Libya
a. NTL changes, 2012–19 b. NTL changes, May 2019–May 2020
Lost NTL Preserved or new NTL Lost NTL Preserved or new NTL
c. Night-time light emissions, by region d. Night-time light emissions, by function
0.9 1.8
0.8 0.10 0.09 0.09 0.08 Sum of lights (million pixels) 1.6
Sum of lights (million pixels)
0.05 0.06 1.4
0.7 0.03 0.04 1.2
0.6 0.04 1.0
0.5 0.38 0.40 0.38 0.8
0.44 0.39
0.4 0.45 0.42 0.43 0.6
0.3 0.37 0.4
0.2
0.2
0.30 0.28 0.31 0.0
0.1 0.24 0.19 0.23
4/1/2012
4/1/2013
4/1/2014
4/1/2015
4/1/2016
4/1/2017
4/1/2018
4/1/2019
4/1/2020
0.18 0.17 0.14
0.0
2012 2013 2014 2015 2016 2017 2018 2019 2020
East West South Hydrocarbon related Others
Source: World Bank staff estimations using data from the National Aeronautics and Space Administration and the National Oceanic and Atmospheric Administration .
Between 2019 and May 2020 (the last available data point), the Libyan NTLs took another dive, this time by about 45 percent, in what
constituted the most rapid decline in a single year since the first civil war in the last decade. This was again largely driven by hydrocarbon
activity, which lost about 80 percent of NTL associated with it in the process.
These trends are overall well correlated with aggregate data on GDP and crude oil production. Thus, although more recent NTL data is not
available at this stage, based on administrative data on oil production, we expect the NTL series to exhibit an imperfect rebound towards
the end of 2020. Overall, the NTL data remains promising in analyzing the temporal and spatial dynamics of economic activity especially in
Libya where the hydrocarbon economy has a large footprint of light emissions.
tanker at the port of Tripoli, the government assured. to around US$11 billion for the year, according to
However disparate, these numbers and indicators the Central Bank of Libya in Tripoli which also acts
convey the idea that non-oil activity was weak if not as the de facto Treasury. All revenues—hydrocarbon
dormant in 2020. revenues, taxes on income and profits, customs
The oil production cutback had a duties, and foreign exchange fees—accrue to the
catastrophic effect on government revenues in GNA. Hydrocarbon revenues were LYD 5.3 billion for
2020. “Lost” revenues from the blockade amounted the year, well under a tenth of hydrocarbon revenues
Recent Developments 3FIGURE 3 • Government Revenues and FIGURE 4 • Government Revenues and
Expenditures Expenditures, West and East
LYD Billions LYD Billions
100 70
60
50
50
40
LYD billions
30
LYD
0 20
10
0
–50
–10
–20
–100 –30
2016 2017 2018 2019 2020
2016
2017
2018
2019
2020
2016
2017
2018
2019
2020
2015
2015
Budget balance Revenues West East
Wages and salaries Capital expenditure
Subsidies and transfers Budget balance Revenues Expenditure
Source: Government estimates (revenues and expenditures) and World Bank staff Source: Government estimates.
estimates (percent of GDP).
of LYD 31.4 billion in 2019. Non-hydrocarbon expenditures. The oil revenue would instead be held
revenues, consisting principally of tax revenues but in escrow at the Libya Foreign Bank, the offshore
also including customs fees, telecommunications bank fully owned by the central bank. The withholding
revenues, the central bank’s profits, local fuel sales, of oil revenue from the Central Bank of Libya affected
and other revenue items, were LYD 2.5 billion for the ability of the government to meet obligations to-
the year, roughly the same as in 2019. A surtax on ward the end of the year. The freeze also triggered a
foreign currency sales for commercial and personal depreciation of the Libyan dinar in the parallel market
purposes, introduced in 2018 and accounting for a to LYD 7 = US$1 in end-November, the highest dispar-
sizable 40 percent of all revenues last year, earned ity from the official rate since 2017.
LYD 15.2 billion for 2020, about two-thirds of the LYD The plunge in revenues had a dramatic
23.4 billion in 2019. Approximately LYD 13.7 billion effect on government spending. The West cut total
of the surtax was allocated upfront to pay off public expenditures by 22 percent from LYD 46.1 billion in
debt, leaving LYD 1.6 billion to fund development 2019 to LYD 36.2 billion in 2020 (Figure 4), with wages
expenditures in the budget. Altogether, total revenues
stood at LYD 23 billion in 2020 (Figure 3),2 some 40
percent of total revenues earned in 2019. 2
Data on revenues cited in this report are from the
The adverse impact of the oil revenue loss- Ministry of Finance. The Ministry of Finance, which
es on government finances was compounded by acts as the fiscal authority, and the Central Bank of
a decision by the National Oil Corporation to tem- Libya, which acts as the de facto Treasury, differ in their
accounting and reporting of fiscal revenues, which has
porarily freeze transfers from oil revenues late in
been attributed only to the West. Although the Ministry
the year. In November 2020, the state oil company of Finance treats all proceeds of the surtax on foreign
alleged that US$3.7 billion in oil revenue deposited exchange transactions as fiscal revenue, the Central
at the Central Bank of Libya from January to October Bank of Libya considers only the portion that is available
2020 had not been accounted for in the official data, to finance the budget as fiscal revenue, excluding the
which showed only US$1.7 billion of oil revenue dur- part which is set aside to pay public debt. Moreover, the
Central Bank of Libya adjusts the Ministry of Finance’s
ing the period. The company declared that oil reve-
cash accounting by excluding oil revenues received in
nue would no longer be deposited at the central bank January each year for exports shipped in December in
accounts until the central bank provided transpar- the previous year and telecommunications fees received
ency and established clear mechanisms for tracking in January for services rendered in December.
4 LIBYA ECONOMIC MONITORFIGURE 5 • Government Debt Stock FIGURE 6 • Government Debt Flows, West
% of GDP and East
LYD Billions
500
400 2020
300 2019
% of GDP
200
2018
100
2017
0
2016
–100
2016 2017 2018 2019 2020 0 5 10 15 20 25 30
Public debt (stock) West East
Source: Government estimates (debt stock) and World Bank staff estimates (percent Source: Government estimates.
of GDP).
and salaries accounting for the bulk of expenditures expenditure in the East, claiming 51 percent of total
for the year—LYD 21.9 billion or 61 percent. The spending at LYD 5 billion in 2020. Expenditures on
GNA had announced a decision to cut the salaries goods and services of LYD 2 billion were 20 percent
of high-ranking political officials by 40 percent of total expenditures, compared to 10 percent of
starting in January 2020 and of all public sector total expenditures in the West. The IG allocated
employees by 20 percent starting in April 2020, but proportionately less to subsidies than the GNA, both
it is not clear whether the decision was implemented in 2020 and in the preceding five years. Rather, the IG
for either group. Subsidies reached LYD 5.6 billion, spent more on capital investment that the GNA, both
or 16 percent of total expenditures. The GNA had in levels and percentage of expenditure terms
reportedly decided to implement the reform of the Government debt is large. Revenues, exclud-
fuel subsidy system previously adopted in 2015 and ing set-asides for debt payment, barely covered a fifth
replace it with a universal cash transfer system, but of government expenditures in the West, forcing the
fuel subsidy expenditures remained at LYD 3.4 billion government to turn to the Central Bank of Libya anew
for the year. Apart from fuel, other items in the subsidy for deficit financing of LYD 26.7 billion.3 With the IG
list included electricity, water and sewage, sanitation, lacking access to state oil revenues, spending in the
and medical supply. Development expenditures were East was financed almost entirely by bond issuance in
miniscule for the year, LYD 1.8 billion or five percent 2020, in the amount of LYD 9.7 billion. Total debt stock
of total expenditures, compared to LYD 4.6 billion in stood at an estimated at LYD 154 billion in end-2020
2019. All capital expenditures projects for 2020 were (Figure 5) and has been calculated as the cumulation
virtually scrapped. of debt flows over the years (Figure 6).4 Government
Deprived of national oil revenues, the East debt in the West is placed at LYD 84 billion, following
managed to maintain government spending in
2020 at its level in 2019. Expenditures by the IG
were only marginally lower at LYD 9.7 billion in 2020, 3
Data on expenditures cited in this report are from the
compared to LYD 10 billion in 2019. Government Ministry of Finance. As with revenues, the Ministry of
Finance and the Central Bank of Libya also differ in their
spending in the East is a fraction of that in the West,
accounting and reporting of expenditures.
averaging a fifth to a fourth of spending in the West 4
Debt data are based on government, IMF, and World
over the five-year period from 2015 to 2019. As Bank staff estimates (Schaeffer and Ouelhazi, “Libya: An
in the West, salaries and wages were the largest Economy in Fiscal and Monetary Crisis” 2021).
Recent Developments 5FIGURE 7 • Exports and Imports of Goods end-September 2020.6 Reserves are 60 months im-
US$ Billion ports of goods, using goods imports data for 2019
40 before imports were slightly trimmed in 2020. The
30 global average is 11 months of imports; the average
20
for countries in the Middle East and North Africa is
20 months of imports. Reserves are 197 percent of
10
(1.97 times) broad money (M2), which was LYD 111.7
0
billion in end-June 2020, according to data from the
–10
Central Bank of Libya. The average is 15 percent for
–20
2016 2017 2018 2019 2020p 116 countries for which data is available. This ratio
is especially useful for assessing reserve adequacy
Trade balance Exports Imports
under fixed exchange rate regimes where credibility
Source: IMF, Direction of Trade Statistics. needs to be established.
Note: p=preliminary. Data for 2020 are for January-October.
The long-running liquidity crisis continues to
fester. Households are reportedly not able to withdraw
sufficient amounts of cash to meet their basic needs—
deficits in 2013–17 and again in 2020. Government only four percent of respondents in a survey reported
debt in the East is calculated at LYD 71 billion from being able to make purchases using cash withdrawn
annual deficits since 2015. In addition, the govern- from banks over the past month. Meanwhile, vendors
ment owes LYD 26 billion in accrued family benefits, continued to demand cash—more than half covered
LYD 19 billion in delayed benefit payments, and LYD by the same survey reported accepting only cash.
8 billion in dues to the Social Security Fund. Overall, Inability to access money service providers, a poorly
including these payables, total liabilities are estimated functioning internet, and recurrent power shortages
at LYD 207 billion at end-2020. In Libya, reported gov- hindered the use of electronic payments. Money
ernment debt is almost completely domestic, and any supply gained two percent in September 2020 from
public obligations with third parties are unknown. end-2019 (Figure 8), with currency in circulation
Export receipts collapsed with the oil outside banks dropping by around LYD 870 million
facilities blockade. Exports amounted to US$8.9 (Figure 9). Net foreign reserves declined, reflecting
billion in January-October 2020, some 61 percent lower the fall in exports, while net credit to the government
than over the same period in 2019 (Figure 7).5 Imports rose, reflecting the increase in the deficit.
were lower too, but less dramatically than exports. Credit from commercial banks declined in
Imports amounted to US$10.5 billion in January- the first half of 2020, leveling the small annual
October 2020, about 15 percent lower than over the gain in 2019. Outstanding credit by commercial
same period in 2019. About 40 percent of Libya’s banks for various economic activities stood at LYD
imports are consumer goods and another 40 percent 16.7 billion in end-June 2020, two percent lower than
are intermediate goods. The heavy concentration LYD 16.9 billion in end-2019, which was less than a
of consumer and intermediate goods in the import quarter of GDP according to data from the Central
basket implies that goods imports cannot be readily Bank of Libya. Six state-owned banks, including three
pared without substantial economic consequences.
The trade account was in deficit, at US$2 billion in
January-October 2020, reversing a surplus of US$9.9 5
Monthly data on exports and imports for 2019 and
billion over the same period in 2019. Prior to 2020, the 2020 are from the IMF, Direction of Trade Statistics. The
last time Libya posted an annual goods trade deficit Central Bank of Libya and the U.N. Conference on Trade
and Development also report Libya trade data, but the
was 1962.
data are not yet available for any period in 2020.
International reserves remain adequate 6
Reserves data for 2020 are IMF staff estimates
by most headline metrics. The latest data avail- (Schaeffer and Ouelhazi, “Libya: An Economy in Fiscal
able for international reserves is US$49 billion in and Monetary Crisis” 2021).
6 LIBYA ECONOMIC MONITORFIGURE 8 • Money Supply FIGURE 9 • Currency Outside of Banks
Annual Change, in Percent LYD Billions and Annual Change in
Percent
40
40 40
30
20
35 35
LYD billions
10
%
0
30 30
–10
–20
2016 2017 2018 2019 2020p 25 25
2016 2017 2018 2019 2020p
Other items net Net claims on other sectors
Net claims on govt Net foreign assets Cash outside of banks, LYD billion (lhs)
Money supply Cash outside of banks/M2, in percent (rhs)
Source: Central Bank of Libya. Source: Central Bank of Libya.
Note: p = preliminary. Data up to September 2020. Note: p = preliminary. Data up to September 2020
which are co-owned with private interests, dominate FIGURE 10 • Exchange Rate
the banking system, but perform little financial LYD/US$
intermediation beyond servicing state financial activity 7the dollar accounts where all sales by the National Oil that disruptions from the intensified conflict in the
Corporation are collected. The parallel market rate in west and the south, the temporary stoppage in foreign
the western areas, which stood at LYD 4.19 = US$1 currency transactions by the central bank, and the
at the beginning of the year, depreciated to LYD 6.50 outbreak of the COVID-19 crisis boosted prices for
=US$1in May as fighting between the GNA and LNA essential goods in the first half of the year (Box 2).
forces intensified, appreciated to LYD 5.52 = US$1 Rising demand from internally displaced persons
on September 26 when the National Oil Corporation boosted prices for essential goods in the east in the
resumed exports from safe ports, depreciated to second half of the year.
LYD 6.38 = US$1 on November 12 as the National
Oil Corporation stopped deposits of oil revenues at
the Central Bank of Libya in Tripoli, and appreciated
Social Developments
to LYD 5.96 = US$1 on December 17 the day after
Years of military and civil strife in Libya, punctu-
the central bank agreed to devalue the official rate
ated by the economic downturn in 2020, have
beginning in January 2021.
worsened social and poverty outcomes in the
The devaluation of the official exchange
general population and among migrant commu-
rate effectively eliminates the need for the surtax
nities. The ongoing conflict and the deteriorating
on foreign exchange transactions. First imposed
economic conditions constrained the delivery of ba-
in September 2018, the surtax aimed to narrow the
sic social services to the general population and to
difference between the parallel market rate and the
migrants. Some 1.3 million people (17.6 percent of the
official rate on commercial and personal transactions
total population) needed humanitarian assistance in
covered by the tax. The redundancy of the surtax
2020, and the number is expected to reach 1.8 mil-
implies that there will not be any foreign exchange fee
lion in 2021, according to OCHA.9 Among those in
revenues in 2021. The devaluation is also expected to
need, 40 percent were women and 35 percent were
have other effects on the economy moving forward.
children. Notably, 60 percent were either internally
The U.S. dollar equivalent value of the LYD 154 billion
displaced persons, returnees, migrants, or refugees.
government debt, which would have been US$110
Those in the “severe” and “extreme needs” category
billion before the devaluation of the Libyan dinar,
represented 17 percent of all people in need. Most of
stands at US$34.4 billion at the new exchange rate.
the needs reported were for health services (92 per-
Although all of government debt is domestic, the
cent of all people in need), food security (54 percent),
debt is still effectively serviced with external receipts
and protection (38 percent). The needs reported and
(oil revenues), making the debt less costly to the
their severity as well as the factors associated with
government. The devaluation is also expected to
boost the inflation rate, both by stimulating domestic
demand and by increasing the price of imports. In 7
Ha, Stoecker, and Yilmazkuday, Inflation and Exchange
emerging market and developing economies, the Rate Pass-Through, World Bank Policy Research Working
median value of the exchange rate pass-through Paper 8780, 2019. The exchange rate pass-through ratio
is defined as the percentage increase in consumer
was +0.08 over the period from 1998 to 2017.7 The
prices associated with a one percent depreciation of the
increase in prices in Libya from the 220 percent effective exchange rate after one year.
devaluation of the Libyan dinar in January 2021 will 8
Libya has had a sizable parallel foreign exchange
likely be less than implied by this ratio.8 market for some period; rate changes in the parallel
Notwithstanding the economic downturn, market would have passed through to prices over time.
consumer prices likely rose in 2020. The full-year Moreover, the surtax on foreign exchange transactions
effectively devalued the currency in 2018, at least for
report of consumer prices remains incomplete as the
commercial and personal transactions; there would have
Central Bank of Libya has only reported official data been price effects since that time.
for the first quarter of 2020 (a 0.9 percent inflation 9
U.N. Office of the Coordinator of Humanitarian Affairs,
rate for the quarter). However, survey data indicate Humanitarian Needs Overview – Libya, 2021.
8 LIBYA ECONOMIC MONITORBOX 2. THE COST OF LIVING IN LIBYA: AN ANALYSIS BASED ON THE COST OF A MINIMUM
EXPENDITURE BASKET (MEB)* FOR THE AVERAGE HOUSEHOLD
Prices of essential goods, which rose significantly in the beginning of 2020 but decreased during the second half of the year, remained
higher in 2020 than in 2019. The average median cost of the MEB increased on average by three percent during the first quarter and 36
percent in April compared to December 2019 (Figure B2.1). The average median cost of the MEB then decreased by three percent on
average compared to April 2020. The cost of food items and cooking fuel led to this variation. In the first months of 2020 intensified conflict
in the west of Libya disrupted supply routes. The Central Bank of Libya halted foreign currency transactions in March, impeding the flow of
goods into the country and spurring demand for foreign exchange in the parallel market. In response to the COVID-19 crisis, the authorities
stockpiled essential goods in March disrupting the markets. By June 2020, hostilities in the southern regions of Tripoli ended. Market
logistical barriers were lifted. The oil blockade negotiations began. Fuel prices declined.
FIGURE B2.1 • The Cost of the Minimum FIGURE B2.2 • … with Variation across Regions
Expenditure Basket Increased Compared to the Average
During 2020 Compared to
December 2019 … 1,300
1,200
130 8
1,100
Cost index (May 2018 = 100)
120 7
6 1,000
110 5 900
LYD/US$
100 4 LYD 800
90 3
2 700
80 1 600
70 0
500
Jan-18
Apr-18
Jul-18
Oct-18
Jan-19
Apr-19
Jul-19
Oct-19
Jan-20
Apr-20
Jul-20
Oct-20
400
May-18
Jul-18
Sep-18
Nov-18
Jan-19
Mar-19
May-19
Jul-19
Sep-19
Nov-19
Jan-20
Mar-20
May-20
Jul-20
Sep-20
Nov-20
Minimum expenditure basket
Exchange rate – official (RHS)
Exchange rate – parallel market (RHS) East South West Average
Sources: REACH Initiative – Libya Joint Market Monitoring Initiative, Central Bank Sources: REACH Initiative – Libya Joint Market Monitoring Initiative, Central Bank
of Libya, and World Bank staff estimates. of Libya, and World Bank staff estimates.
The cost of living varied across regions with higher costs in the southern regions of Libya. The average median cost of the MEB in the
south was 34 percent higher than the national average and 50 percent higher than in the west during 2020 (Figure B2.2). While running
below the average, the average cost in the east was only 2 percent higher than in Tripoli. Beginning in April 2019, the conflict in the south
of Tripoli led to a logistical isolation created by checkpoints and road blockages, which increased transaction costs and food and cooking
fuel prices. Compared to the other regions, the average median cost of the MEB in the east rose steadily during the second half of 2020
due to increased demand from internally displaced persons escaping intensified insecurity.
* The Minimum Expenditure Basket is defined as what a household requires in order to meet their essential needs, on a regular or seasonal basis, and its cost—it sets a
monetary threshold for what is needed to cover these essential needs (U.N. World Food Programme, Minimum Expenditure Baskets – Guidance Note, 2020). For Libya, the
basket includes 18 food items, five non-food items, and cooking fuel, the quantities of which reflect the needs of a household of 5.2 persons. The MEB was drawn by the Libya
Cash and Market Working Group, a community of humanitarian groups supporting and coordinating humanitarian cash and market interventions in the country. The group
established the Libya Joint Market Monitoring Initiative (JMMI) in 2017, aiming to inform cash-based interventions and better understand market dynamics in the country. The
JMMI has produced cost data for the MEB since January 2018.
these needs differed from one group of the popula- human rights violations” hindered the capacity of mi-
tion to another. However, “conflict,” “access to servic- grants and refugees to meet their needs.
es,” and “deteriorating quality of services” emerged The conflict has adversely affected the
as common factors for the general population, while usability of health facilities. More than half of
“discrimination” and “international humanitarian law/ healthcare facilities that were operational in 2019,
Recent Developments 9have closed especially in rural areas due to security Approximately 699,000 people (nine percent of the
threats and a lack of funds, according to the OCHA. population) were considered food insecure in 2020,
Meanwhile, the remaining operating healthcare almost double the number in 2019, with significant
facilities have faced critical gaps in medicines and increases recorded among both displaced and non-
supplies, as well as an acute shortage of health displaced Libyans, according to the OCHA. With
workers. Over the second half of 2019 and the first persistent insecurity and conflict, displaced people
half of 2020, Libya recorded 28 attacks on medical were forced to abandon their homes and livelihoods,
facilities, ambulances, and medical personnel. The Al losing their jobs and income in their search for safety.
Khadra Hospital in Tripoli, assigned to receive patients Almost a third of all migrants and refugees were food
with COVID-19, was struck by rockets on four separate insecure, with the highest number reported among
occasions in early April 2020. The fragmentation migrants in Benghazi and refugees in Tripoli. Libyans,
of the country into competing governments and migrants, and refugees adopted one or more coping
militia-controlled areas has eroded stewardship and mechanisms to maintain some level of food security:
governance in the health sector. Health budgets have buying less expensive food, reducing the number or
been sharply reduced due to the country’s budgetary size of meals, or prioritizing children for food with the
crisis. In the overall ranking on the Global Health adults reducing their own food consumption, according
Security Index,10 Libya ranks 168 out of 195 countries, to the World Food Programme (WFP)12 and the U.N.
42 out of 54 African countries, and 46 out of 56 upper International Organization of Migration (IOM).13
middle-income countries. Recent surveys also confirm the level of
The education sector has suffered from the social strife faced by Libyans. Data from the WB-
protracted conflict and from underinvestment. A WFP Libya Food, Security and Nutrition Survey
total 287 schools—six percent of all schools—have collected amidst the COVID 19 pandemic—between
been damaged or destroyed and 27 schools are 8 December 2020 to 6 January 2021—in eight
used as shelters for displaced families, according Libyan municipalities (Tripoli, Tobruk, Almargeb,
to the OCHA. Some of the functioning schools lack Nalut, Aljufra, Murzuq, Zwara and Alkufra) from 1000
adequate drinking facilities (25 percent), handwashing randomly sampled households consisting of 11
facilities (15 percent) and gender-segregated toilets
(35 percent). According to the survey conducted
by the REACH Initiative,11 households with enrolled 10
Produced by the Nuclear Threat Initiative, the Johns
children reported that schools lacked transportation Hopkins Center for Health Security, and the Economist
Intelligence Unit, the index is the comprehensive
(12 percent), needed teachers or learning materials
assessment and benchmarking of global health
(11 percent), offered poor quality of teaching security capabilities across 195 countries that comprise
(12 percent), and suffered from overcrowding due the States Parties to the World Health Organization
to the presence of displaced families (12 percent). (WHO) International Health Regulations (https://www.
Internally displaced families and returnees who had ghsindex.org/).
lost, or did not have, their identification documents
11
REACH Initiative, Multi-Sector Needs Assessment in
Libya, December 2020. The survey conducted from June
faced additional barriers in enrolling their children
to August 2020 covered 6,061 households with different
in schools. According to the OCHA, some 316,000 status (non-displaced, internally displaced, and returnees)
children and 10,000 teachers are estimated to need in 22 districts. The sample was not representative. The
assistance. These include 55,000 displaced persons, REACH Initiative is a humanitarian organization providing
73,000 returnees, 146,000 non-displaced Libyans, data, information, and analysis on the humanitarian
36,000 migrants and 6,000 refugees. The numbers situation in various countries and territories in the context
of crisis, disaster, and displacement.
increased by 157 percent from 2019. 12
World Food Programme, Mobile Vulnerability Analysis
Instability across the country caused a and Mapping (mVAM) Bulletin No. 4, April–May 2020.
significant negative impact on food security in 13
U.N. International Organization for Migration, Migrant
2020. The conflict affected food availability and cost. Emergency Food Security Report, Libya, 2020.
10 LIBYA ECONOMIC MONITORpercent displaced persons showed that 10 percent because the limited testing capacity is concentrated in
of Libyans had inadequate food consumption (poor Benghazi and Tripoli. The relaxation of government’s
and borderline food consumption). Food insecurity containment measures in the west during the second
was found to be higher in the Eastern and Southern half of 2020 accelerated the spread of the pandemic
regions. There was an increase in food insecurity in the country.
reported in Tobruk (32 percent), Murzuq (23 percent) National and local authorities implemented
and Alkufra (15 percent) compared to May 2020. On stringent containment measures to control the
average, households reported consuming pulses spread of the disease in line with international
and fruits on the least number of days. Households experience. A range of containment measures were
in Alkufra, Murzuq and Tobruk reported to have implemented prior to the identification of the first
consumed these on only two days in the previous confirmed COVID-19 case, including closing schools,
week. encouraging people to work from home, canceling
Given the fragile and vulnerable nature public events, restricting very large gatherings, and
of the country, the COVID-19 pandemic could requiring the quarantine of arrivals from high-risk
not have hit at a worse time. The pandemic has regions. These measures were tightened with the
exacted a heavy economic and social toll on the diagnosis of the first case and were complemented by
country, exacerbating already difficult conditions. curfew, confinement, border closure, and restrictions
Containment measures led to job losses and reduction on internal movement (Figure 12). As the curve
in household incomes, notably among migrants and remained flat, the authorities adopted more targeted
refugees. Border closures, mobility restrictions, and measures. On May 28, the government either required
curfews disrupted trade and dislocated markets, or recommended that people stay at home. On July
resulting in higher prices for food, basic goods, and 7, the authorities relaxed restrictions on work from
essential services. Loss of employment and delays home for some economic sectors and categories of
in the payment of salaries and wages for those still workers. On July 27, Libya reopened its borders for
at work diminished the people’s capacity to provide travelers arriving from some regions.
for their basic needs and forced many households Libya posted the highest number of con-
to adopt negative coping mechanisms to maintain firmed cases and the second highest number
food consumption. COVID-19 also affected people’s of deaths per million population among the
access to various social services. The authorities Maghreb countries in 2020. Continued relaxation
implemented measures to control the spread of of containment measures in July to November 2020
the pandemic and to cope with its socioeconomic raised the number of cases to 14,594 per million by
impact but these measures lacked coordination and end-December 2020, the highest among the Maghreb
effectiveness. countries (Figure 13). The retightening of containment
The relaxation of containment measures measures beginning in December 2020 slowed down
accelerated the spread of COVID-19 cases in the spread of the disease but to a lower extent than in
Libya during the second half of 2020. The first Morocco. Libya registered a steady increase in num-
confirmed case of COVID-19 was reported on March ber of deaths over the second half of 2020 totaling
24. The number of new cases grew slowly during the 274 deaths per million by the end of January 2021,
second quarter of 2020 with an average of eight new exhibiting almost the same trend as Morocco but far
cases per day. During the second half of 2020, the below Tunisia (Figure 14).14
number of new confirmed cases climbed quickly,
reaching a peak of 1,603 daily confirmed cases on
14
A breakdown of COVID-19 data by demographic
October 25 (Figure 11). As of end-January 2021, there
characteristics and health status of the affected and
were 118,632 confirmed cases and 1,877 reported deceased population is arguably needed for a better
deaths due to COVID-19. However, the true scale understanding of the observed differences among the
of the pandemic is likely far higher than reported Maghreb countries.
Recent Developments 11FIGURE 11 • Cumulative COVID-19 Cases and FIGURE 12 • Stringency Index and Cumulative
Deaths COVID-19 Cases
2,000 140 1,200 100
1,800 1,000
Score (0–100 stringent)
120 80
1,600
1,400 100 800
Thousand cases
60
Cases
1,200 80 600
Cases
1,000 40
60 400
800
200 20
600 40
400 0 0
20
200
Mar-20
Apr-20
May-20
Jun-20
Jul-20
Aug-20
Sep-20
Oct-20
Nov-20
Dec-20
Jan-21
0 0
Mar-20
Apr-20
May-20
Jun-20
Jul-20
Aug-20
Sep-20
Oct-20
Nov-20
Dec-20
Jan-21
New cases (smoothed) Stringency index (RHS)
New cases New cases (smoothed) Source: European Centre for Disease Prevention and Control, COVID-19 Situation
Total deaths Total deaths (RHS) Update Worldwide.
Note: The stringency index is a composite measure based on nine indicators of
Source: European Centre for Disease Prevention and Control, COVID-19 Situation government responses to the pandemic, including school closures, workplace
Update Worldwide. closures, and travel bans, scaled to a value from 0 to 100 (100 = strictest measure).
FIGURE 13 • Cumulative COVID-19 Cases in the FIGURE 14 • Cumulative COVID-19 Deaths in the
Maghreb Region Maghreb Region
Per million population Per Million Population
20,000 600
500
Total deaths per million
Total cases per million
15,000
400
10,000 300
200
5,000
100
0 0
Feb-20
Mar-20
Apr-20
May-20
Jun-20
Jul-20
Aug-20
Sep-20
Oct-20
Nov-20
Dec-20
Jan-21
Feb-20
Mar-20
Apr-20
May-20
Jun-20
Jul-20
Aug-20
Sep-20
Oct-20
Nov-20
Dec-20
Jan-21
Libya Tunisia Algeria Morocco Libya Tunisia Algeria Morocco
Source: European Centre for Disease Prevention and Control, COVID-19 Situation Source: European Centre for Disease Prevention and Control, COVID-19 Situation
Update Worldwide. Update Worldwide.
The pandemic additionally strains the a hospital, came into contact with a known case, or
country’s already fragile health system. Libya’s returned from overseas—were tested. Many hospitals
low rank on numerous indicators pertaining to across the country regularly suspended operations
epidemic and pandemic preparedness in the Global due to high rates of COVID-19 infection among staff and
Health Security Index underlines the weak capacity patients. Furthermore, many health workers refused to
of the health system to address the COVID-19 crisis report for duty due to a lack of protective equipment,
(Figure 15). Laboratory testing for COVID-19 faced inadequate infection protection and control measures,
persistent and acute shortages of test kits. Libya or because they had not been paid for work rendered.
adopted a targeted testing policy and limited contact The government allocated an additional budget of
tracing. People with COVID-19 symptoms that met a LYD 1.2 billion for emergency investment in the health
specific criterion—being a key worker, was admitted to sector, about 2.7 percent of total expenditures in 2020.
12 LIBYA ECONOMIC MONITORYou can also read