LOGISTICS SECTOR IN OVERVIEW OF THE - BRAZIL - Centro de Excelência em ...
←
→
Page content transcription
If your browser does not render page correctly, please read the page content below
OVERVIEW OF THE
LOGISTICS
SECTOR IN
 BRAZIL
  ABRIDGED VERSION

                   Norwegian Embassy
                   Brasilia

     PRODUCED BY
Norwegian Embassy
  Brasilia

NOVEMBER 2020
OVERVIEW OF THE

          LOGISTICS
          SECTOR IN
           BRAZIL
                     ABRIDGED VERSION
   The full version of this Report is available only to Norwegian organisations,
and may be requested directly from the Norwegian Embassy or Innovation Norway.

                              PRODUCED BY:

                         IN COOPERATION WITH
Coordinated by

Marcus Vinicius Quintella Cury – FGV Transportes

              Technical Staff

Marcus Vinicius Quintella Cury – FGV Transportes

   Marcelo Prado Sucena – FGV Transportes

Priscila Laczynski de Souza Miguel – FGV Celog

     Michele Esteves Martins – FGV Celog

                   Layout

                Bruno Masello

               Carlos Quintanilha

                 Translation

                  Patricia Tate

                 Realization

       Website: http://transportes.fgv.br

         E-mail: fgv.transportes@fgv.br

               Collaboration
CONTENTS
CHAPTER 1
INTRODUCTION.................................................................................................................. pág   4

CHAPTER 2
BRAZILIAN LOGISTICS: PRODUCTIVITY............................................................................. pág                   8

CHAPTER 3
TRANSPORT INFRASTRUCTURE..................................................................................... pág                   12

CHAPTER 4
MAIN LOGISTICS CORRIDOR PROJECTS....................................................................... pág                         20

CHAPTER 5
MAIN PRODUCTION CHAINS.......................................................................................... pág                26

CHAPTER 6
MAIN LOGISTICS PLAYERS............................................................................................. pág             32

CHAPTER 7
LOGISTICS CORRIDORS.................................................................................................. pág           34

CHAPTER 8
TECHNOLOGIES INVOLVED............................................................................................. pág              38

CHAPTER 9
AFTER COVID-19: POST-PANDEMIC EXPECTATIONS...................................................... pág                                42

CHAPTER 10
REFERENCES................................................................................................................... pág   46

                                                                                                                                         3
                                                                                      Norwegian Embassy
                                                                                      Brasilia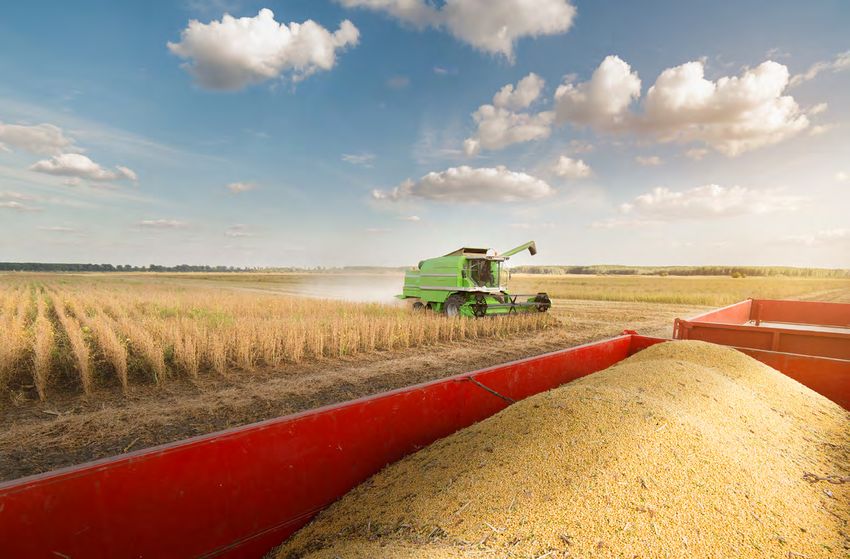
1
CHAPTER

INTRO
DUCTION
In simplified terms, logistics may be defined as a      regulatory risks, among other hurdles. According
set of actions focused on planning, operating and       to a survey by the Ministry of the Economy, and
controlling resources that underpin the efficiency      conducted in partnership with the Competitive
of the physical and logistical flows (data and          Brazil Movement (MBC – Movimento Brasil
information) of input materials from suppliers to       Competitivo), the Brazil Cost is equivalent to 22%
the production system and then, as the process          of its Gross Domestic Product (GDP). On the other
continues, warehousing and storage, transport           hand, the World Economic Forum calculates that
(by land, water and air) and the distribution of        Brazil’s logistics costs account for more than 12%
finished goods to the end consumer.                     of its national GDP, ranking Brazil 65th for transport
                                                        infrastructure in a list of 137 countries.
Logistics may also be understood as the
operating pillar that upholds expanded supply           The Global Competitiveness Index (GCI) drawn
chains that interlink all the players involved, in      up by the World Competitiveness Yearbook,
order to efficiently service end consumers with         noted in its 2020 edition that Brazil ranked 56th
the right products, at the right places, and at the     in the GCI, out of 63 nations, with gains in
lowest possible costs.                                  competitiveness for four consecutive years.
                                                        As an international reference, the other BRICS
Driven by globalization and the high-speed              countries (Brazil, Russia, India, China and South
development of technologies, in parallel to rising      Africa) did not progress this latest yearbook,
global competitiveness, logistics has become the        while the USA – which is an international
strategic foundation for the economic development       competitiveness benchmark – ranked tenth.
of the nation, allowing homogenous services
nationwide. Logistics underpins improvements            Along    the      same   lines,   the    2019    Global
in the income distribution processes, lessening         Competitiveness Report presenting data and
inequalities,   boosting     production      system     information compiled by the World Economic
capacities and endowing foreign trade with a            Forum, presented the Global Competitiveness
keener competitive edge, thus lowering the costs        Index 4.0 (GCI 4.0) on the economic outlooks for
of national impediments.                                141 economies, with Brazil in the 71st position.
                                                        Before the COVID-19 pandemic, Brazil’s Ministry
In Brazil, these national impediments are called        of the Economy posted a target of reaching the
the Brazil Cost, encompassing excessive red tape,       50th position in 2022. Among the 110 variables
trade barriers, high and complex taxation, poor         analysed in the national infrastructure assessment,
transport infrastructure, together with juridical and   Brazil stands 78th; specifically, for transport, it drops

                                                                                                                    5
                                                                   Norwegian Embassy
                                                                   Brasilia
to 85th position, despite being one of the world’s       According               to   the   overall   2019   –   2020
    ten largest economies. For this issue, poor highway      Competitiveness ranking, among 18 counties,
    quality has been relegated to 116 position.
                                          th
                                                             Brazil ranks next to last, ahead only of Argentina.
                                                             In addition to Brazil and Argentina, the lowest-
    Specifically with regard to logistics, the 2018          ranking countries in this index are Indonesia,
    Logistics Performance Index (LPI) – which is             India, Colombia and Peru, with Chile and Mexico
    drawn up every two years by the World Bank –             in 8th and 12th place, respectively. The most
    shows Brazil ranking 56th (LPI = 2.99), among the        competitive economies in this ranking are:
    160 countries assessed dropping three places to          South Korea, Canada, Australia, China, Spain
    50   th
              position (LPI = 2.93) for the infrastructure   and Thailand. For the infrastructure and logistics
    item. As a comparison, Germany heads this                items, considering all the modes of transport
    ranking with LPI = 4.20, with Afghanistan bringing       assessed (road, rail, water and air), Brazil is in the
    up the rear at LPI = 1.95, which is the only figure      lower third of this ranking in the 15th position,
    below 2.00. The highest LPI score is 5.00.               out of the 18 countries selected for this listing.

    FIGURE 1 – COMPETITIVENESS OF BRAZIL: INFRASTRUCTURE AND LOGISTICS FACTOR

    (Maximum score = 10)
                                        South Corea                           7.83
                                                   Spain                    7.34
                                               Canada                   7.19
                                               Australia                6.85
                                                  Poland               6.72
                                                   China               6.67
                                                   Chile             6.02
                                                   Tukey             6.02
                                                  Russia         5.85
                                               Thailand          5.80
                                           Argentina            5.68
                                        South Africa            5.45
                                                  Mexico        5.41
                                            Indonesia          5.19
                                                   Brazil     4.77
                                                    Peru      4.72
                                           Colombia           4.67
                                                   India      4.65

    Source: National Confederation
    of Industry (CNI) 2019-2020

6
                                       Norwegian Embassy
                                       Brasilia
Consequently, in this dynamic context swept by      The adopted methodology follows bibliographic
the COVID-19 pandemic, investors, entrepreneurs     research      precepts,        examining   theoretical
and businesses all over the planet are seeking      materials that might record basic data and
markets through competitive edges, pinpointing      information, with qualitative analysis based
opportunities that could add value, demonstrating   on interpretative and reflective treatment, and
clear, firm possibilities of paybacks.              quantitative assessments using empirical and
                                                    analytical approaches. An explanatory survey will
With this end in view, this report provides data    be presented, listing factors that define Brazil’s
and information that could underpin strategic       logistics conditions. Furthermore, descriptive
decision-making processes on Brazil’s logistics     research will also be used, organizing data in
sector, highlighting changes resulting from the     ways that allow exploratory hypotheses.
COVID-19 pandemic, together with trends and
outlooks for the next ten years.

       According to the overall 2019 – 2020
       Competitiveness ranking, among 18 counties,
       Brazil ranks next to last, ahead only of Argentina.

                                                                                                             7
                                                               Norwegian Embassy
                                                               Brasilia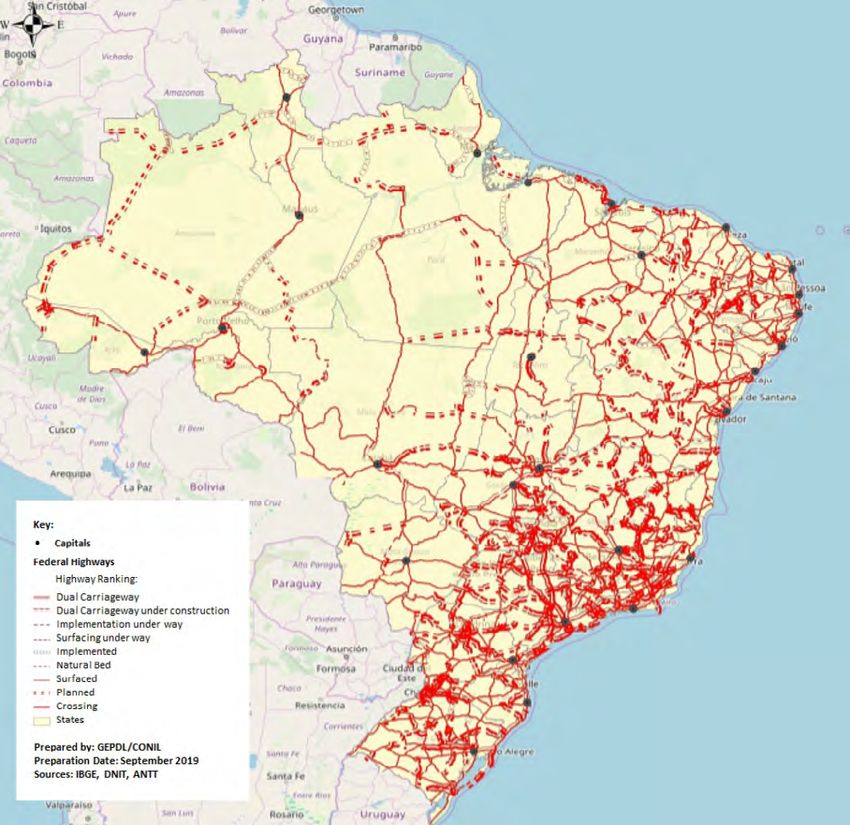
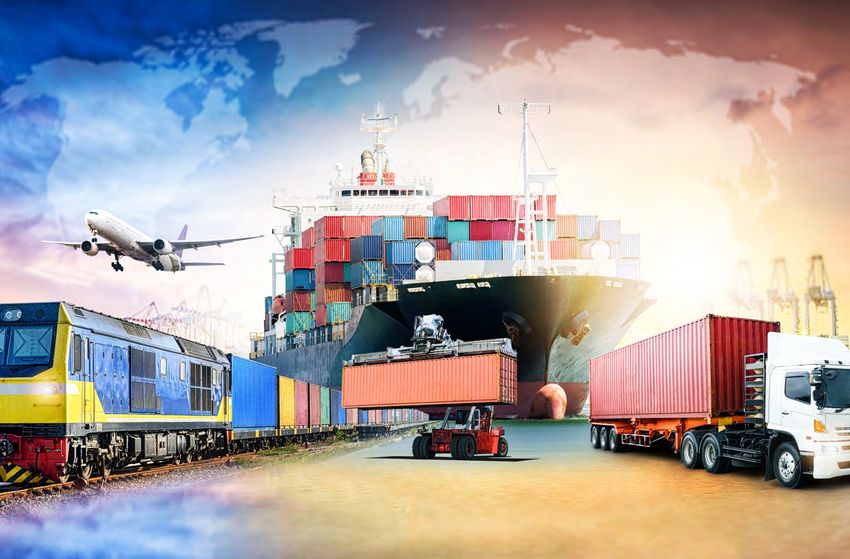
2
CHAPTER

BRAZILIAN
LOGISTICS:
PRODUCTIVITY
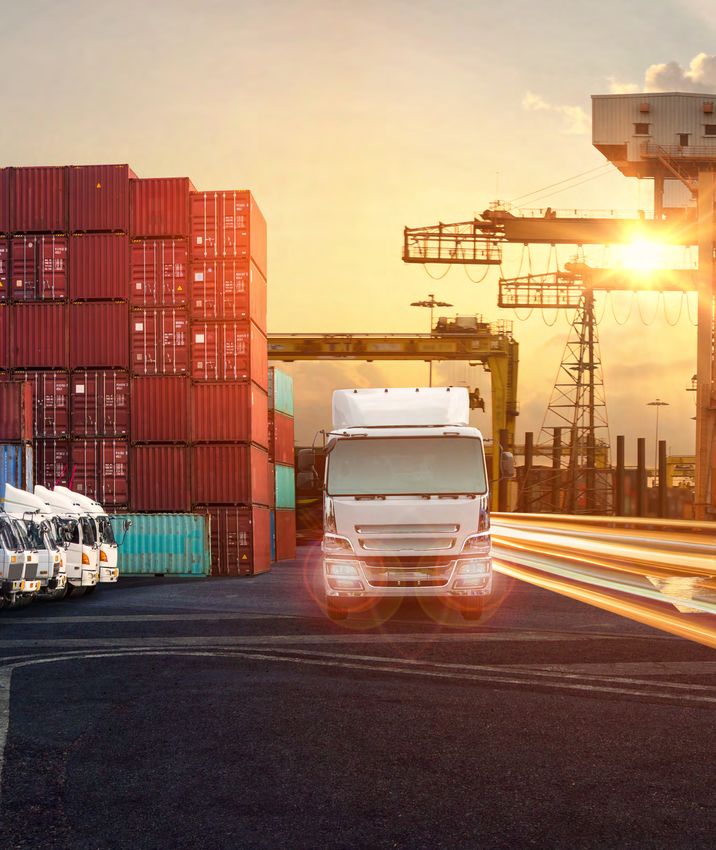
Viewed as a connecting link within systemic                       highways, only 214,000 kilometres are asphalted,
logistics, cargo transport is a means-activity                    equivalent to 12.4% of the entire road network.
handling input and finished materials in logistics                Among these hard-surfaced highways, just over
flows. In Brazil, cargo transport developed as a                  10% have been assigned to private enterprise, under
response to the European colonization process,                    concessions. Most highways are still administered
prompted by the need to export primary                            by the government and the latest survey by the
products, shipped out mainly by water. As                         National Transport Confederation (CNT) rated 66%
demands for these products rose, with overland                    of them as fair, poor or extremely poor.
access difficult, Brazil’s first railways were laid,
connecting mining areas with ports.                               Declining since 2010, investments in transport
                                                                  infrastructure continue downtrending in 2020, due
Although Brazil has 1.72 million kilometres of                    to the COVID-19 pandemic, as shown in Graph 1.

GRAPH 1 – PROGRESSION OF INVESTIMENTS IN TRANSPORT

by year (billion BRL)

     25
                         21.0
     20
           22.6                                              16.8
     15                     16.1             15.4                                         11.8
                                                                                                       10.2
     10
                                                                        10.5
                                                                                                                  9.7
      5

      0
       2010          2011          2012         2013         2014          2015           2016        2017              2018

Source: National Transport and Logistics Observatory (ONTL) / Brazilian Planning and Logistics Enterprise (EPL)

                                                                                                                               9
                                                                               Norwegian Embassy
                                                                               Brasilia
Presented in 2015 by the Brazilian government, Matrix (O/D Matrix) for 2025, with the as-is
the National Logistics Plan (PNL) is divided up by multimode network supply for 2015, plus work on
mode for the reference year, handling a total of the BR-163/230 Pará State, BR-135, Pará State,
2.4 Freight Tonnes Kilometre (FTK), in addition BR-135, Bahia State/MG and BR-242, Bahia State,
to simulations for the 2025 scenario. The PNL highways, in addition to doubling the Estrada de
presents strategic planning for fine-tuning cargo Ferro Carajás – EFC railway. For demand, the
transport, taking into consideration the potential 2025 scenario used this same 2025 O/D Matrix,
of each mode of transport. but with the supply increased by new segments
that will be operational by 2025. These modes
It is worth stressing that the as-is scenario is of transport divisions for the 2015 and 2025
based on demand through the Origin / Destination scenarios are presented in Graphs 2 and 3.
GRAPH 2 - TRANSPORT MATRIX
(% by mode) 2015
4
11
Road
5
Rail
Water
15 65
Coastal Shipping
Pipeline
Source: EPL/PNL (2015)
GRAPH 3 - TRANSPORT MATRIX
(% by mode) Simulation 2025
4
10
5 Road
Rail
Water
50
Coastal Shipping
31
Pipeline
Source: EPL/PNL (2015)
10
Norwegian Embassy
BrasiliaAccording to data released in 2020 by the Logistics cabotage, 4% by pipelines, 2% by waterways
and Supply Chain Institute – ILOS for volumes and less than 1% by air. Brazil’s Cargo Transport
transported in Brazil, 61% of cargoes are hauled Matrix is presented in Figure 2, in a comparison
along highways, 21% are carried by rail, 12% by with this distribution in six other countries.
FIGURE 2 – NATIONAL TRANSPORT MATRIX COMPARISON (% FTK)
Brazil 61% 21% 12% 4% 2%
Japan 51% 5% 44%
Road
EU 50% 11% 32% 3% 4% Rail
Cabotage
USA 43% 27% 3% 22% 5%
Pipeline
China 35% 14% 25% 3% 23%
Water
Australia 27% 55% 14% 4%
Canada 19% 34% 3% 40% 4%
Source: ILOS (2020)
11
Norwegian Embassy
Brasilia3 CHAPTER TRANSPORT INFRASTRUCTURE
Moving on from the situation presented in the             of federal highways, of which 6.4% are double-lane,
previous chapters, which does not indicate a              and 48.6% asphalted. Most hard-topped highways
systemic and integrative view of Brazilian logistics,     are in the Federal District (62.2%); Sergipe State
reflecting a drop in investments in transport during      (41.8%) and Amazonas State (34.7%). Compared
at least the last five years, the current cargo           to other countries, Brazil’s highway density falls
transport infrastructure conditions are presented         well below that of other continent-sized nations
below, by mode of transport.                              like China and the USA, and also lags behind other
                                                          countries in South America, including Argentina,
ROAD TRANSPORT                                            Uruguay and Ecuador, as shown in Graph 4.
According to the Federal Highways Portal, run by
the EPL, Brazil has a total of 129.824,60 kilometres      Further details are presented in Figure 3.

GRAPH 4 – ASPHALTED ROAD NETWORK DENSITY BY COUNTRY

(kilometres / 10 3.km2 )

           500,0
                      452.1
           450,0               437.8

           400,0

           350,0

           300,0

           250,0

           200,0

           150,0

           100,0
                                         54.3
            50,0                                   43.9       42.3          41.6
                                                                                    28.8     25.1
               0
                      China     USA     Russia   Uruguay Argentina      Canada     Ecuador   Brazil

Source: CNT Highways Survey (2019)

                                                                                                                13
                                                                     Norwegian Embassy
                                                                     Brasilia
FIGURE 3 – MAP: FEDERAL HIGHWAYS
Source: ONTL / EPL
RAIL TRANSPORT network for operating efficiency, with many
Rail transport in Brazil is influenced by some curves, slopes and height constraints.
logistics hurdles that undermine its performance
and haulage capacity. They include, for example: Brazil’s rail network runs a total of 29,800
trespassing on rights of way; critical level kilometres (EPL, 2019). However, a study by the
crossings; diversified gauges; segments running National Confederation of Industry (CNI), based
through towns; low speed; tangled legal aspects on ANTT data, shows that 8,600 kilometres
related to rights of access; and inadequate (28.9%) of the lines assigned to private
14
Norwegian Embassy
Brasiliaenterprise through concessions are unused or Figure 4 shows that Brazil’s railways are
out of operation. On the other hand, the National concentrated along its coastline, due to aspects
Transport Users Association (ANUT) states that related to European colonization and the need to
only 12,000 kilometres of Brazilian railways are in export primary goods. Today, this region accounts
full operation, as the remaining 18,000 kilometres for 80% of Brazil’s GDP, with the Southeast
are underused or abandoned. accounting for almost 60%.
FIGURE 4 – MAP: RAILWAYS
Source: ONTL / EPL
15
Norwegian Embassy
BrasiliaWATERWAY TRANSPORT Port of São Sebastião in São Paulo, administered
Brazil’s Cargo Transport Matrix indicates that by the Company Docas de São Sebastião; the
waterborne transportation (sea and river) holds only port with steady growth every year, this
a 5% share of waterborne (sea and river) traffic could well become one of the most important
and 11% for cabotage, as noted in the PNL. The ports in Brazil. With five mooring berths, four
cabotage performance for Brazil’s five busiest storage yards and five silos with 4,000 tons of
cargo ports between 2014 and 2019 is shown static capacity, it is earmarked for concession to
in Graph 5. Particularly noteworthy is the public private enterprise.
GRAPH 5 – CABOTAGE PRODUCTIVITY AT MAJOR PORTS
(tons)
100,000,000
90,000,000
80,000,000
70,000,000
60,000,000
50,000,000
40,000,000
30,000,000
20,000,000
10,000,000
0
2014 2015 2016 2017 2018 2019
São Sebastião Angra dos Reis Aratu Salvador Rio de Janeiro - Niterói Itaqui
Source: ONTL / EPL
GRAPH 6 - RIVER TRANSPORT PRODUCTIVITY AT MAJOR PORTS
(tons)
80,000,000
70,000,000
60,000,000
50,000,000
40,000,000
30,000,000
20,000,000
10,000,000
0
2014 2015 2016 2017 2018 2019
Vila do Conde - Belém Santarém Manaus Itaqui Óbidos
Source: ONPL / EPL
16
Norwegian Embassy
BrasiliaGraph 6 shows Brazil’s five busiest river cargo Figure 5 shows port facilities, locks, waterways
ports. The Porto de Vila do Conde, in Pará and cabotage flows. With a coastline some 7,400
State, is particularly noteworthy, with growth kilometres long, 60,000 kilometres of navigable
of 108% between 2014 and 2019. This port rivers and lakes, Brazil makes use of only 21%
has a multi-use mooring terminal, a bulk liquids its total capacity, with around 12,600 kilometres
terminal for carriers and barges, and a road- of waterways (EPL, 2019). According to ANTAQ,
river terminal designed only for barges. It is there are 215 port facilities, including 34
connected to road transportation options by the established ports, 147 private use terminals, 32
BR-316 highway. transhipment stations and two tourism facilities.
FIGURE 5 – MAP: WATERWAYS
Source: ONTL / EPL
17
Norwegian Embassy
BrasiliaPIPELINE TRANSPORT
Pipeline transport can be classified by the type Pipeline distribution throughout Brazil is shown
of cargo handled, including oil pipelines, (oil, in Figure 6. Brazil has 718 pipelines, with a total
oil-fuel, gasoline, diesel), gas pipelines (natural length of 21,200 kilometres, and seven ore
gas), ore pipelines (rock salt and iron ore), water pipelines, with a length of 1,700 kilometres (EPL,
pipelines and multi-product pipelines (other types 2019). In comparative terms, the USA, Canada and
of cargoes). China have 2,225 kilometres, 100,000 kilometres
and 87,000 kilometres of pipelines respectively.
FIGURE 6 – MAP: PIPELINES
Source: ONTL / EPL
18
Norwegian Embassy
BrasiliaAIR TRANSPORT
Air transport encompasses air paths, airports Brazil has 2,340 airports and aerodromes, of
(areas set aside for landings, take-offs and which 78% are private, with a mean landing strip
taxiing), passenger and cargo terminals and air length of 1.05 kilometres, and 88% following
traffic control systems. Figure 7 shows airport daytime Visual Flight Rules (VFR). Some 37% of
positions throughout Brazil. Brazil’s airports and aerodromes are clustered in
Mato Grosso and Mato Grosso do Sul States.
FIGURE 13 – MAP: AIRPORTS AND AERODROMES
Source: ONTL / EPL
19
Norwegian Embassy
Brasilia4 CHAPTER MAIN LOGISTICS CORRIDOR PROJECTS
Coordinated by the General Staff of the Brazilian        For road transport, there are 21 projects under way.
Presidency, the Investment Partnerships Program          Eight projects are in the environmental licensing
(PPI) was set up in order to extend and buttress         phase, with thirteen ready for concession to the
interactions between the State and private enterprise.   private sector. Figure 8 shows these projects on
Its portfolio encompasses 119 projects and nine          a map.
policies under development, as shown below.

FIGURE 8 – MAP: ROAD TRANSPORT PROJECTS

Source: PPI (2020)

                                                                                                                21
                                                                   Norwegian Embassy
                                                                   Brasilia
For rail transport, there are four projects listed, of and one is a sub-concession. These projects are
which two are concessions, one is privatisation, shown on the map in Figure 9.
FIGURE 9 – MAP: RAIL TRANSPORT PROJECTS
Source: PPI (2020)
22
Norwegian Embassy
BrasiliaThe only waterway project listed for PPI is related However, there are 29 projects presented for
to the environmental licensing for the Pedral cabotage and ports. Figure 10 presents the
do Lourenço navigable waterway dredging and projects grouped by Region.
clearing project along the Rio Tocantins river.
FIGURE 16 – MAP: CABOTAGE PROJECTS AND PORTS
Source: PPI (2020)
23
Norwegian Embassy
Brasilia24
Norwegian Embassy
BrasiliaAir transport is included in the PPI with three Figure 11 presents the North I, Central and
projects, all earmarked for private concessions. South Blocks in greater detail.
As these projects are scattered all over Brazil,
FIGURE 17 – MAP: AIR TRANSPORT PROJECTS
Source: PPI (2020)
25
Norwegian Embassy
Brasilia5 CHAPTER MAIN PRODUCTION CHAINS
In order to define the main production chains in        industries also use soybean complex products,
Brazil, an approach was adopted based on the            including the chemical, healthcare, cosmetics and
contributions to its GDP by different sectors of its    biodiesel sectors.
economy. According to data released by the IBGE
(2018), the sector with the highest contribution        According to data released by CONAB (2020), the
to Brazil’s GDP is Services (approximately 73%),        2020/21 harvest may reach 37.85 million planted
followed by Industry (21%) and Ranching &               hectares, with an estimated output of 133.5
Farming (6%). Brazil’s main production chains           million tons, up 7.3% over the 2019/20 harvest.
were selected from the Ranching & Farming and           This is the harvest segment with the heaviest
Industry segments, chosen for their importance          weight (26%), beating past harvest records, up
in terms of domestic demands and exports.               by 5.1% in 2020.

Production chains were selected from these              In terms of commodities, soybeans are among
segments by volume of cargoes hauled, and               the world’s leading crops, with Brazil and the USA
contributions   to   Brazil’s   balance   of   trade.   the main growers as shown in Table 1. In May
According to data released by the Ministry of           2020, Brazil outstripped the USA as the world’s
Transport, Ports and Civil Aviation (2018), the         leading soybeans producer. Other countries
main products for this study are: soybeans; oil and     ranking high for soybean production, such as
fuels; iron ore; sugarcane; beef; and automobiles.      the USA, state that they are already using their
A brief description of each chain is given below,       full land capacity for soybean plantations . Brazil
for each major product.                                 is the only nation with potential for expansion
                                                        (WORLDATLAS, 2020).

SOYBEANS                                                In 2021, Brazil will export around 86.79 million
In Brazil, soybeans are the most widely grown crop,     tons of soybeans, with China remaining the main
and one of the main grains grown in its agricultural    destination, absorbing around 80% of all exports
sector. The products constituting the soybean           in 2021 (CONAB, 2020). According to data
complex are beans, meal and oil (EMBRAPA,               released by EMBRAPA (2020), 63% of soybeans
2010). According to APROSOJA (2017) the human           grown in Brazil are earmarked for export, with the
foodstuffs industry processes soybeans, oil and         rest consumed on the domestic market. Volumes
meal within its product compositions, with soy-         processed internally are divided into soy meal for
based beverages also joining this list. Livestock       export (38%) and domestic consumption (39%)
fodder must also be mentioned, as many types of         and soy oil for household use (16%) and for
feed are produced from soybeans and meal. Other         export (4%) (MTPA, 2017).

                                                                                                              27
                                                                  Norwegian Embassy
                                                                  Brasilia
TABLE 1 – HIGHEST SOYBEAN OUTPUTS (000 TONS)
Ranking Country Output (2019/2020)
1 Brazil 124
2 USA 96.79
3 Argentina 51
4 China 18.1
5 Paraguay 9.9
6 India 9.3
7 Canada 6
Source: WorldAtlas (2020)
OIL AND FUELS
Oil is one of the leading energy sources used nations with the largest global reserves are
worldwide. Important products are made by Venezuela, Saudi Arabia, Canada, Iran and Iraq,
refining oil, including gasoline, diesel oil, jet according to the US Central Intelligence Agency
fuel (ATF), liquefied petroleum gas (LPG), (CIA), with Brazil ranking 15th (MINFRA, 2020).
naphtha, lubricants and fuel oil. In 2018, global
consumption reached some 98.82 million barrels Table 2 shows the distribution of the main fuels
per day, according to the Organization of the produced in Brazil: oil, gasoline A, diesel oil, jet
Petroleum Exporting Countries (OPEC). The fuel, biodiesel and ethanol.
TABLE 2: FUEL DISTRIBUTION BY VOLUME
Domestic
Product Output Imports Exports Consumption
OIL 150,102 10,805 65,186 95,721
GASOLINE A 23,707 2,966 1,390 25,283
DIESEL OIL 41,880 11,650 945 52,585
JET FUEL 6,376 858 515 6,719
BIODIESEL 5,350 - - 5,350
ETHANOL 33,056 1,737 1,682 33,111
Source: MINFRA (2020) – Data: ANP/SECEX (2018)
28
Norwegian Embassy
BrasiliaIRON ORE The iron ore production chain is the most
The ores and mining sector accounts for some important mining activity in Brazil, ranging from
4% of Brazil’s GDP, according to data released ore prospecting to define ore beds through to
by the IBGE and the Geology, Mining and Ore international marketing and sales of products
Processing Bureau under the Ministry of Mines deriving from iron ore (MTPA, 2018a)
and Energy (SGM/MME). This 4% includes
contributions from the ore extraction and With the world’s second-largest iron ore
processing segments (metals and non-metals), reserves, Brazil ranks second only to Australia
in addition to oil and gas. During the first quarter (US Geological Survey, 2020) and is also the
of 2020, the ores and mining sector posted second-largest producer of this metal (in 2015,
revenues of BRL 36 billion (excluding oil and gas) it accounted for 18.9% of global output), with
(IBRAM, 2020). Australia being its main competitor (Table 3).
TABLE 3 – HIGHEST IRON ORE OUTPUT (MILLION TONS, ACTUAL WEIGHT)
Ranking Country Output (2017)
1 Australia 883.4
2 Brazil 435.5
3 India 201.8
4 China (1) 115.0
5 South Africa 62.3
6 Canada 49.0
(1) Output adjusted so that Fe content is similar to world average
Source: United Nations (2020)
SUGARCANE
The sugarcane industry has a long history in 2020/21 harvest (with estimates for August 2020)
Brazil, as the country is endowed with natural was the outcome of working a harvested area
conditions making it the perfect place to plant this planted with sugar cane covering some 8,409,800
crop. In the course of its history, sugar exports hectares, according to the 2020 historical data
have brought in five times more foreign exchange set released by the Companhia Nacional de
earnings than other agricultural produce shipped Abastecimento (CONAB). In the Southeast, São
out to foreign markets (MTPA, 2018c). Paulo and Minas Gerais States harvested 5,174,000
hectares, which was the area with the highest
Brazil’s sugar industry continues to expand. The productivity and output in Brazil (CONAB, 2020).
29
Norwegian Embassy
BrasiliaAccording to the WorldAtlas (2020), Brazil is the and alcohol, by-products and solid wastes are
world’s leading sugarcane producer, followed by also used to co-generate electricity, as well as
China and India (Table 4). It is also a global leader livestock fodder and cropland fertiliser (AGEITEC,
in ethanol production technology. In addition 2015; MTPA, 2018c).
to the raw material needed to produce sugar
TABLE 4: HIGHEST SUGARCANE OUTPUTS (000 METRIC TONS)
Ranking Country Outputs
1 Brazil 793,300
2 India 341,200
3 China 125,500
4 Thailand 100,100
5 Pakistan 63,800
6 Mexico 61,200
7 Colombia 34,900
Source: WorldAtlas (2017)
BEEF the toughest isolation measures were in place
In 2018, Brazil’s beef cattle chain handled volumes in Brazil.
worth BRL 597,22 billion, reaching 8.7% of its GDP
(MALAFAIA et al., 2020). Nevertheless, according Worldwide, Brazil ranks second for beef output,
to a study conducted by CONAB (2020), the cattle- behind only the USA (USDA, 2020) and followed by
ranching contribution to GDP growth was negative The European Union and China, as shown in Table 5.
in the farming and ranching sector, particularly According to the Livestock Output Statistics Survey
for cattle. During the second quarter of 2020, 7.3 for January – June 2020 (IBGE, 2020), the number of
million head of cattle were slaughtered, down 8% cattle slaughtered over the period dropped, despite
over the same quarter in 2019, but 0.3% higher an upsurge in beef exports driven by rising demands
than the figures for the first quarter of the year. in China.
The Brazilian Meat Exporter Industries Association
(ABIEC) believes that there was a drop of up to The countries with the highest beef demands in
40% in the food service sector, due to lockdowns 2019 were the USA and China, followed by Brazil
and meals eaten at home during the months when as the third-largest consumer market (USDA, 2020).
30
Norwegian Embassy
BrasiliaTABLE 5: MAIN BEEF PRODUCERS (000 METRIC TONS)
Ranking Country Output
1 USA 12,514
2 Brazil 10,200
3 European Union 7,900
4 China 6,670
5 India 4,305
6 Argentina 3,120
7 Australia 2,432
Source: USDA (2020)
AUTOMOBILES main countries of origin were Argentina (26.1%), the
A major player in the global economy, the automotive European Union (21.1%), China (10.5%) and Mexico
sector put down firm roots in Brazil during the 1950s, (10.2%). In 2019, Brazil’s trade balance was negative
its importance confirmed through specific policies by USD 2.9 billion, including auto-parts, with exports
for this sector. of around USD 15.9 billion and imports reaching
some USD 18.8 billion.
Today, there are 26 auto-assemblers in Brazil,
operating out of 65 plants in ten States and 43 Most (90%) industrial plants are clustered in the
municipalities, according to data released by Southeast and South Regions, with 46% (27 plants)
ANFAVEA (2020). As stated in this Yearbook, Brazil located in São Paulo State (MTPA, 2018b). In 2019,
has an annual installed production capacity of 5.05 the total output of automotive vehicles reached
million vehicles, with revenues reaching USD 61.9 2,951,446 units, including production, domestic
billion in 2018. Its accumulated output of automotive sales and exports. Of this total, São Paulo State
vehicles from 1957 through to 2019 topped 84.4 accounted for 40.1%, followed by Paraná State with
billion. This industry employs 1.3 million people in 15%; Minas Gerais and Rio Grande do Sul States
direct and indirect jobs, with a total share of 3% in with 10.7% each; and Pernambuco and Bahia States
Brazil’s GDP (2017). with 7.5% each. (ANFAVEA, 2020)
In the 2019 global ranking, Brazil is the eighth Furthermore, this sector encompasses some 592
largest producer, and sixth for domestic market size. business units in the auto-parts sector that feed
The domestic market absorbs 88% of all vehicles into the supply chain, as shown in data released by
produced in Brazil, with exports accounting for only SINDIPEÇAS (2020), together with 3,980 dealerships
12% (MTPA, 2018b). In 2019, the main destination that distribute automotive vehicles nationwide,
countries for its automotive exports world were mainly in the Southeast (44%), followed by the
Argentina (25.3%), the USA (16.4%), Mexico (10.7%) South (24%) and Northeast (16%), according to
and the European Union (10.1%). For imports, the FENABRAVE (2020).
31
Norwegian Embassy
Brasilia6 CHAPTER MAIN LOGISTICS PLAYERS
There are currently 275 logistics operators in Brazil,         in taxes, social security and other levies. ABOL
 bringing in gross revenues of BRL 100.8 billion a              study, in partnership with Fundação Dom Cabral
 year, generating more than 1.5 million direct and              (2020), points out that logistics operators in Brazil
 indirect jobs, and paying around BRL 26.2 billion              operate in different segments (Table 6),

 TABLE 6 – OPERATORS WITH THE LARGEST SELF-OWNED FLEETS ACTIVE IN BRAZIL

                                                                                                    Imple-    Total
   Company                        Services                       Segments               Trucks
                                                                                                    ments    (units)
                      Transport, logistics and
                      supply chain, fleet rental and
                                                       General cargoes, poultry,
JSL S/A               management, vehicle sales,                                          2,122     4,368      6,490
                                                       and farm produce
                      passenger transport, machine
                      rental and rubbish collection

Ouro Verde            Leasing vehicles and
                                                                                          1,251     2,346      3,597
Locação e Serviço     equipment

Martelli
                      Transport                        Grains                            1,023      2,473      3,496
Transportes

Centro Oeste                                           Beers, alcoholic and non-
                      Industry                                                           2,335        280      2,615
Logística                                              alcoholic beverages.

                                                       Beef, pork, lamb, and
JBS S/A               Industry                                                            1,149      1,420     2,569
                                                       chicken; leather processing

                                                       Agribusiness,
HU Transporte         Transport and fleet
                                                       petrochemicals, consumer               691   1,502      2,193
Rodoviário Ltda       management
                                                       goods

Comando Diesel
Transporte e          Transport                        Assorted                               756   1,408      2,164
Logística

Transportes
                      Transport                                                               470   1,687      2,157
Bertolini Ltda

                                                       Poultry and farm produce,
Transpanorama
                      Transport                        timber, grains, bulk liquids,          946    1,041     1,987
Transportes Ltda
                                                       general cargoes

                                                      Sugar and alcohol, forest
                      Spot cargo transport through to products, chemicals,
Expresso
                      complete logistics operations   beverages, and automotive               743    1,198     1,941
Nepomuceno S/A
                      projects                        items in several regions of
                                                      Brazil

 Source: World Transport (2018)

                                                                                                                        33
                                                                          Norwegian Embassy
                                                                          Brasilia
7 CHAPTER MAIN LOGISTICS CORRIDORS
RAIL CORRIDORS
As illustrated in Table 7, there are thirteen       they are essential for other chains, particularly
rail corridors in Brazil, showing that the main     soybeans and maize, iron ore, sugar and fuels.
production chains described in Chapter 5 (Main      It is also stressed that the Imbituba corridor,
Production Chains), rail corridors do not service   which carries mainly charcoal, is unrelated to the
the beef and automotive chains. However,            production chains examined in this Report.

TABLE 7 – RAIL CORRIDORS AND PRODUCTION CHAINS

                              Soybeans
          Corridor                         Iron ore    Sugar             Fuels    Vehicles   Beef
                              and Maize
São Luís                          X             X                          X
Intra-regional Northeast                        X                          X
Vitória                           X             X                          X
Centre-West – São Paulo           X                       X
São Paulo – Northeast             X             X         X
Rio de Janeiro – Belo
                                                X
Horizonte
Rio de Janeiro –
                                                X         X
São but Paulo
Santos
                                  X             X         X
(broad gauge)
Corumbá – Santos
                                                X         X
(narrow gauge)
Paranaguá                         X                       X                X
São Francisco do Sul              X                       X                X
Rio Grande                        X                                        X

Source: CNT Railways (2015)

                                                                                                         35
                                                              Norwegian Embassy
                                                              Brasilia
PORTS In terms of cargoes handled by ton, the main ports
According to the Brazilian infrastructure sector are listed in Table 8. The ten largest established
(CBIE), there are 175 cargo port facilities in Brazil, ports handle 85% of all cargoes shipped through
including marine terminals, ports and waterway this type of facility, while the ten largest private
facilities. Among them, 99 are ports and terminals ports handle 65% of these cargoes (ANTAQ, 2019).
along the coast, while 76 are inland facilities.
It is worth stressing that the ports most commonly
During 2019, 64,600 mooring operations took used for long-haul shipping of containerised
place in 34 established ports, 147 private use cargoes (imports and exports) are Santos, Itajaí,
terminals, 32 cargo transshipment stations and Paranaguá, São Francisco do Sul and Rio Grande.
two ports with tourism facilities, handling volumes Cabotage takes place mainly in private ports, with
that totalled 1,104 billion tons (ANTAQ 2019). only 22% handled by established ports (ANTAQ
Statistics Yearbook, 2019).
TABLE 8 – MAIN PORTS BY ACTIVITIES
Cargoes
handled Private or
Port Main goods
Organised
(million tons)
Ponta da Madeira Marine Private Use
190.1 Iron ore, manganese, copper
Terminal (MA) Terminals (Vale)
Santos (SP) 106.2 Organised Containers, soybeans, bulk liquid
Private Use Iron ore, coal, grains, fertilisers, bulk
Tubarão (ES) 76.4
Terminals (Vale) liquids
Private Use
Terminal Angra dos Reis –
51.9 Terminals Oil
Tebig (RJ)
(Petrobras)
Agricultural produce (soybeans),
Paranaguá in Paraná State 48.5 Organised
containers, automobiles, sugar
Itaguai (RJ) 43.2 Organised Iron ore and containers
Terminal de São Sebastião Private Use
43.2 Oil, oil products, alcohol, biodiesel
– Tebar (SP) Terminals (Petrobras)
Woodpulp and timber, bulk solids,
Rio Grande (RS) 25.8 Organised
containers, automobiles
Bulk solids (soybeans and maize)
Itaqui (MA) 25.2 Organised
and bulk liquids (diesel, gasoline)
Bulk liquids(oil), automobiles, iron
Suape (PE) 23.9 Organised
ore, soybeans and sugar, containers
Source: ANTAQ Statistics Yearbook (2019) • Note: TUP – Private Use Terminals
36
Norwegian Embassy
BrasiliaWATERWAY CORRIDORS year), followed by containerised cargoes and bulk
Despite the length of Brazil’s rivers, inland shipping solids (bauxite, iron ore, iron and steel) (ANTAQ,
uses only 30% of this network for commercial 2018; ANTAQ, 2019).
purposes, with only 5% of its cargoes carried
by waterways. This is well below the figures for Among the major production chains described in
other continent-sized countries such as China and this Report, cabotage is used largely by the fuels
the USA (CNT Navegação Interior, 2019). and iron ore chains, and to a lesser extent for
soybeans and maize (carrying grains as well as
River shipping in Brazil is relatively important, fertilisers), in addition to vehicles, sugar and beef.
particularly in the North Region, due to the
availability of navigable waterways, low transport
costs and the absence of road networks. PIPELINES
In Brazil, pipeline shipping systems are used
There are six major river basins in Brazil: the mainly to carry fuels and natural gas, as well as
Amazon, with a length of 15,014 kilometres assorted oils and oil products, fuels, natural gas
(80.6% of all Brazil’s navigable waterways, the and iron ore, providing efficient and sustainable
Tocantins-Araguaia (1,338 kilometres and 7.2%); means of transport.
Paraná (1,267 kilometres and 6.8%); Paraguay
(591 kilometres and 3.2%); and the South Atlantic The infrastructure needed to transport fuels
(406 kilometres and 2.2%), in addition to the Vale includes bulk liquids terminals and oil pipelines.
do São Francisco river valley, which is not yet in Built to receive, store and ship out goods (fuels
use (VEN, 2018). and liquid oil products) terminals may be located
onshore, as well as alongside lakes or waterways.
The main cargoes shipped along waterways in In oil-producing areas, products may be shipped
Brazil are bulk solids (soybeans, maize, and iron from oil fields to terminals, or pumped directly
ore), followed by bulk liquids and gases (oil and oil to refineries. For biofuels such as ethanol and
products), as well as general cargoes, mainly in the biodiesel, output is delivered to distributors or
river-laced North Region. This mode of transport at terminals (ANP). Oil pipelines may be onshore
has potential for the expansion of containerised or subsea, with the main oil pipeline in Brazil
cargoes, due to its limited representativity. running more than 990 km between Paulínia
and Brasília. The main players shipping liquids
through pipelines are Transpetro and Logum.
CABOTAGE CORRIDORS
During 2018, cabotage was mainly for carrying With lighter environmental impacts, ore pipelines
bulk liquids and gases (with crude and oil products carry minerals over long distances, shipped out
accounting for 60.6% of coastal cargoes that as thick slurries consisting of water and solids.
37
Norwegian Embassy
Brasilia8 CHAPTER TECHNOLOGIES INVOLVED
Discussed below are the current and future              on industry (focal point) and all its connections
technologies that might be notable for logistics        along the supply chain (SC). Viewing logistics as
management in Brazil.                                   an operating support, this transformation of the
                                                        focal point created ongoing impacts on its services,
In 2011, the term Industry 4.0 arose during an          particularly transport, warehousing and customer
industrial technology trade fair in Hanover, Germany,   order cycle management.
which highlighted the possibility of linking machines
with smart systems. The Brazilian Government            Leite (2020) and Trevisan (2020) highlights
opened the http://www.industria40.gov.br/ portal,       some market solutions (Table 9) that are already
which presents the impacts and challenges for all       available in Brazil, trending towards an even
industrial links. This new paradigm has impacts         larger share.

            In 2011, the term Industry 4.0 arose during
            an industrial technology trade fair in Hanover,
            Germany, which highlighted the possibility of
            linking machines with smart systems.

                                                                                                               39
                                                                  Norwegian Embassy
                                                                  Brasilia
TABLE 9 – SOLUTIONS AVAILABLE ON THE MARKET
Provider Solutions
Defines and assembles cargoes, fine-tuning times, costs and
Traveling Salesman Problem – Ailog
distribution sequences
Analyses driver behaviour, allowing accidents to be predicted
Sascar / Trimble
prevented, together with traffic offences
Deliveries and Collection Management, Route Planning and Freight
Benner
Rates Listing
Reply Machine Learning provides support for transport planning
AI and Predictive Modelling for simulating scenarios and
Sialog and Mitra
simplifying decision processes
Compuletra Dock scheduling and control with no human intervention
Senior Logistics optimisation
Opentech/GKO Contracting and parametrising transport
Fretebras Price analysis
GoogleMaps, Alexa associated with
Route Planning
MyTracking (Point Sistemas)
Vuxx Forecasting infrequent routes
Lincros Control towers and cargo tracking
Source: Trevisan (2020), Milk (2020).
Leveraged during the pandemic and buttressed by Planning (ERP) offers greater confidence in
last-mile logistics, e-commerce upgraded its control shipping movements.
systems and movement activities, running from
distribution centres through to end-destinations, There is also the possibility of flying over areas
with growth in this area, in addition to boosting with high vehicle density and traffic jams, through
customer loyalty through unboxing experiences using drones.
Some analysts suggest that the last mile accounts Another technology that can increase the
for up to 30% of transport costs in an order cycle. visibility of operations and allow rapid action
For last-mile distribution, companies have also when needed are control towers, transmitting
appeared as alternatives for retailers that do not information in real time, with gains through
intend to have their own fleets. For customers, lower fuel consumption, greater fleet efficiency,
AI-driven tracking visibility with direct B2B and shorter times and better service levels (OLIVEIRA
B2C connections through Enterprise Resource NEVES, 2019; TARALLO et al., 2019).
40
Norwegian Embassy
Brasilia41 Norwegian Embassy Brasilia
9
CHAPTER

AFTER
COVID-19:
POST-PANDEMIC
EXPECTATIONS
The post-pandemic period could well be beneficial           horizon may be considered for the implementation
for Brazil, despite beginning only after the advent of      and completion of the announced projects.
a safe and efficacious vaccine available worldwide,
probably in mid-2021. The reason for this statement         The main expectation of the Brazilian Government
is that there are positive expectations that the            is to forge ahead with port privatisation, in order to
Brazilian economy might move to the fore as a               streamline the shipment of goods and commodities,
major global supplier of agricultural commodities,          while doubling the rail share in the Transport Matrix
contributing above all through supplying food to many       and thus reducing free charges for the logistics
peoples all over the world. For this possibility, the       market. During the next two years, the Brazilian
development of Brazilian logistics and upgrading the        Government intends to conduct 24 port lease
nation’s transport infrastructure will be fundamental       auctions, signing 54 private terminal adherents
in order to ensure that Brazil is endowed with a keen       agreements, increasing Brazil’s cargo fleet by 40%,
competitive edge on global markets. This public             while preparing the country for a massive upsurge in
health crisis is a major opportunity for Brazil, although   rail transport.
there are many challenges to be surmounted.
                                                            However, according to the IPEA (2020), investments
The Ministry of Infrastructure has been announcing          in infrastructure have been very low for years,
major projects, many of them begun during the               as shown in Graph 7, and are not even enough
pandemic, with the government targets of BRL 30             to offset the depreciation of the patchy transport
billion in public investments and BRL 250 billion in        structure and energy supply system in place in
federal concessions, during the next two years, as          Brazil today. Expectations for the next ten years are
well as BRL 40 billion for railways and BRL 1.9 billion     not encouraging, with the as-is scenario projections
for upgrading road access to the Port of Santos.            keeping public investments in infrastructure at the
                                                            extremely low level of 1.7% of the GDP each year.
With the large amounts of money announced                   Any transformative scenarios that might include
and based on the track record of allocating public          upscaled investments in infrastructure, moving
funds to Brazil’s transport infrastructure, these           towards a desirable 3.5% of the GDP over ten
expectations will certainly not firm up over the short      years, will require the approval of new laws by the
term. However, in a best-case scenario, a ten-year          Brazilian Congress.

                                                                                                                     43
                                                                        Norwegian Embassy
                                                                        Brasilia
GRAPH 7 – INFRASTRUCTURE INVESTMENT RATE (1990 – 2031)
(at constant 2010 prices, in % GDP)
4,0
3,5
3,0
2,5
2,0
1,5
1,0
1990
1991
1992
1993
1994
1995
1996
1997
1998
1999
2000
2001
2002
2003
2004
2005
2006
2007
2008
2009
2010
2011
2012
2013
2014
2015
2016
2017
2018
2019
2020
2021
2022
2023
2024
2025
2026
2027
2028
2029
2030
2031
As-Is Scenario Transformative Scenario
Source: FGV (prepared by Dimac / Ipea)
In terms of agricultural output, according to the The worldwide public health crisis caused by COVID-
Ministry of Agriculture, Livestock and Supply (MAPA), 19 has prompted expectations of tight economic
the Gross Production Value (GPV) for every business constraints on both the supply and demand sides.
will increase by 8.5% in 2020 over 2019, reaching Social distancing in order to curtail the dissemination
BRL 703.8 billion. The Brazilian Agriculture and of the virus is undermining the confidence of
Ranching Confederation (CNA) is more optimistic, consumers, business executives and governments,
forecasting that the GPV will reach BRL 740.3 billion, resulting in the sharpest drop in Brazil’s GDP since
up 12.4% over the 2019 figures. this historic dataset began in 1901.
On the other hand, according to projections drawn up In its study of the impacts of the COVID-19 pandemic
by IPEA during the COVID-19 pandemic, Brazil has on the Brazilian economy, the IPEA noted that
shifted from a reasonably promising outlook to the production activities were strongly impacted, with
current context, with forecasts for 2020 indicating the service sector – accounting for 70% of Brazil’s
the possibility that the Brazilian economy will shrink GDP – most severely affected.
by up to 6%.
44
Norwegian Embassy
BrasiliaAnother post-pandemic expectation is related New technologies will start to reach a commercial
to the behavioural, economic, social and cultural scale. For instance, drones will be important for fine-
changes imposed on individuals, companies and tuning logistics for deliveries (B2C) as well as carrying
governments, including the digital transformation, input materials, feedstock and products between
for example, which has progressed very quickly over industries, hospitals, companies, stores and service
a brief period, together with the appearance of new providers (B2B).
business models and innovative solutions.
Post-pandemic shifts in people’s consumption habits
Market surveys show that Internet purchases are will drive e-commerce to an increasing extent,
up by around 50% over 2019, with this situation prompting the adaptation of marketplace platforms
indicating massive progress for the retail logistics run by major retail chains, in order to increase their
sector during the next few months. Consequently, product mixes, including products and services
retail logistics will play a key role and may gain ample offered by macro-enterprises and small businesses,
headroom, despite shortfalls in Brazil’s transport resulting in the modernisation and optimisation of
infrastructure, as Brazilian consumers sheltering logistics processes.
at home have understood and opted strongly for
delivery services, creating a context that is far more There is also the possibility that the logistics sector
favourable for on-line commerce. will adhere to the shared economy. This would
consist of haulage companies joining forces in order
The first six months of 2021 will be decisive for to offer better and more personalised services to their
adapting and migrating off-line markets to on-line customers, with low costs and impractical and smart
options, with a major restructuring process for ways, through using automation and technology.
the retail logistics sector. To an increasing extent,
consumers will continue to buy their medications, Finally, the main expectation is the implementation
food, cleaning and grooming products, among of multi-mode logistics in Brazil. The first major step
others, without leaving the house, while demanding in this direction will be the completion of the design
fast deliveries and low freight fees. project for the Electronic Transport Document (DT-e)
by the Ministry of infrastructure, which proposes a
There will probably be many mergers, acquisi new electronic fiscal transport document, using smart
tions, partnerships, court-supervised restructuring technology to connect up hauliers and shippers. This
processes and bankruptcies, including the logistics would reduce paperwork and streamline transport
sector, in addition to expanded operations, extended operations, while lowering logistics costs, improving
Polarity, lower operating costs, higher process inspections and contributing to trip planning
automation and extended remote management for in all modes.
haulage companies and logistics operators.
45
Norwegian Embassy
Brasilia10 CHAPTER REFERENCES
ABOL – Associação Brasileira de Operadores Logísticos. Perfil dos Logísticos no Brasil. 2020. Available
at: https://abolbrasil.org.br/

AGEITEIC. Cana-de-Açúcar. Agência Embrapa de Informação Tecnológica. 2020. Available at http://
www.agencia.cnptia.embrapa.br/gestor/cana-de-acucar/arvore/CONTAG01_1_711200516715.html

ANFAVEA – Anuário da Indústria Automobilística Brasileira. 2020. Available at http://anfavea.com.br/
anuarios

ANTAQ. Anuário Estatístico. 2019. Available at: http://portal.antaq.gov.br/wp-content/uploads/2020/02/
Anu%C3%A1rio-2019-vFinal.pdf.

______. Boletim Aquaviário 4º Trimestre. 2019. Available at: http://portal.antaq.gov.br/wp-content/
uploads/2020/06/Boletim-Aquavi%C3%A1rio-4%C2%B0_2019-VERS%C3%83O-FINAL.pdf

______. Estudo da Cabotagem. 2020. Available                at:     http://portal.antaq.gov.br/wp-content/
uploads/2020/02/Estudo_Cabotagem_06-02.pdf

______. Vias Economicamente Navegáveis. 2018. Available at: http://portal.antaq.gov.br/wp-content/
uploads/2020/01/VEN_2018_Finalizado.pdf

ASSOCIAÇÃO DOS PRODUTORES DE SOJA E MILHO DO ESTADO DO MATO GROSSO – APROSOJA.
Uso da Soja. 2017. Available at: http://aprosojabrasil.com.br/2014/sobre-a-soja/uso-da-soja/

CANAL RURAL. Projeto Soja Brasil. Confira como está a colheita de soja em cada estado. 2020.
Available at: https://www.canalrural.com.br/projeto-soja-brasil/noticia/confira-como-esta-a-colheita-da-
soja-em-cada-estado-do-pais/

______. 10 portos que mais embarcaram soja 2019. Available at: https://www.canalrural.com.br/
projeto-soja-brasil/noticia/10-portos-que-mais-embarcaram-soja-2019/

______. Exportações de agronegócio cresceram 4,8% em setembro, puxadas pelo açúcar 2020.
Available at: https://www.canalrural.com.br/noticias/exportacoes-do-agronegocio-cresceram-48-em-
setembro-para-us-856-bilhoes-puxadas-pelo-acucar/

CANA ONLINE. Maior exportação de açúcar desafia Logística. 2020. Available at: http://www.
canaonline.com.br/conteudo/maior-exportacao-de-acucar-desafia-logistica.html

                                                                                                             47
                                                                  Norwegian Embassy
                                                                  Brasilia
CENTRO DE ESTUDOS AVANÇADOS EM ECONOMIA APLICADA – CEPEA. PIB do Agronegócio.
Agosto 2020. Available at: https://www.cepea.esalq.usp.br/br/pib-do-agronegocio-brasileiro.aspx
CHOPRA, S.; MEINDL, P. Gestão da Cadeia de Suprimentos: Estratégia, Planejamento e Operações.
4ª edição. São Paulo: Pearson, 2011.
CNT. Aspectos gerais da navegação interior no Brasil. – Brasília: CNT, 2019. Available at:. https://cnt.
org.br/aspectos-gerais-navegacao-brasil
___._ Pesquisa CNT de Rodovias – Brasília: CNT: SEST SENAT, 2019. Available at: https://
pesquisarodovias.cnt.org.br/
___. Anuário CNT de Transportes. Estatísticas Consolidadas. 2019. Available at: https://
anuariodotransporte.cnt.org.br/2019/Referencias.
___. Pesquisa CNT de Ferrovias. 2015. Available at: https://www.cnt.org.br/estudo/pesquisa-cnt-
ferrovias
COMPANHIA NACIONAL DE ABASTECIMENTO - CONAB. Acompanhamento da Safra Brasileira:
Grãos. v. 4, n. 4, 2017. Available at: http://www.conab.gov.br/conteudos.php?a=1028
______. Acompanhamento safra brasileira de grãos, v. 7 - Safra 2019/20 - Décimo primeiro levantamento,
Brasília, p. 1-31, Agosto 2020. Available at: https://www.conab.gov.br/info-agro/safras
______. Perspectivas agropecuárias, Brasília, v.8 - safra 2020/21, p. 1-75, Agosto 2020. Available at:
https://www.conab.gov.br/perspectivas-para-a-agropecuaria
______. Análise Mensal Cana-de-açúcar, agosto/setembro 2020. Available at: https://www.conab.gov.
br/info-agro/analises-do-mercado-agropecuario-e-extrativista/analises-do-mercado/historico-mensal-
de-cana-de-acucar
CONTINI, E., GAZZONI, D., ARAGÃO, A., MOTA, M., MARRA, R., Série Desafios do Agronegócio.
Produto Soja. Caracterização e Desafios Tecnológicos. NT Sire. 2018. Available at: https://www.
embrapa.br/agropensa/produtos-sire?p_p_id=20&p_p_lifecycle=0&p_p_state=normal&p_p_
mode=view&p_p_col_id=column-1&p_p_col_pos=1&p_p_col_count=2&_20_struts_
action=%2Fdocument_library%2Fview_file_entry&_20_redirect=https%3A%2F%2Fwww.
embrapa.br%2Fagropensa%2Fprodutos-sire%3Fp_p_id%3D20%26p_p_lifecycle%3D0%26p_p_
state%3Dnormal%26p_p_mode%3Dview%26p_p_col_id%3Dcolumn-1%26p_p_col_
pos%3D1%26p_p_col_count%3D2&_20_fileEntryId=53876248
CUNHA, S. A tecnología como fator de eficiencia na gestão de transporte. Revista Mundo Logística,
v.72, pp. 38-48, 2019.
48
Norwegian Embassy
BrasiliaDE LIMA RODRIGUES, Hydra Walesca; DE ATHAYDE PRATA, Bruno. UM MODELO DE PROGRAMAÇÃO
LINEAR PARA A CADEIA DE SUPRIMENTOS DE PETRÓLEO E DERIVADOS NO BRASIL. 2013.
Available at: http://www.din.uem.br/~ademir/sbpo/sbpo2013/pdf/arq0030.pdf
DIAS, M.A. Logística, transporte e infraestrutura: armazenagem, operador logístico, gestão via TI,
multimodal. São Paulo: Pearson, 2012.
DNIT. Departamento Nacional de Infraestrutura de Transportes. Atlas Ferroviário. Available at: https://
www.gov.br/dnit/pt-br/assuntos/ferrovias/AtlasFerrovirioVersoFinal.pdf
EMPRESA BRASILEIRA DE PESQUISA AGROPECUÁRIA – EMBRAPA. Sistemas de Produção. Londrina:
EMBRAPA Soja, 2010. Available at: www.cnpso.embrapa.br/download/Sistema_Producao14_VE.pdf
EPL – Empresa de Planejamento e Logística – Plano Nacional de Logística (PNL) - Rede Georeferenciada
– PNL 2025 - Available at , Screenshot on:
______. Estudo das Características da Demanda de Transportes de Cargas. 2016. Available at: https://
www.epl.gov.br
EPL/ONTL – Empresa de Planejamento e Logística / Observatório Nacional de Transportes e Logística –
GeoLogística - Available at , Screenshot on:
______. Indicadores - Available at , Screenshot on:
______. Painéis Analíticos - Available at , Screenshot
on:
GLOBO RURAL. Na exportação de soja, portos do Arco Norte crescem mais do que Santos e Paranaguá.
2020. Available at: HTTPS://REVISTAGLOBORURAL.GLOBO.COM/COLUNAS/CASSIANO-RIBEIRO/
NOTICIA/2020/05/NA-EXPORTACAO-DE-SOJA-PORTOS-DO-ARCO-NORTE-CRESCEM-MAIS-DO-
QUE-SANTOS-E-PARANAGUA.HTML
IEA – INSTITUTO DE ECONOMIA AGRÍCOLA. Os frigoríficos e a logística de exportação da carne
bovina. 2005. Available at: http://www.iea.sp.gov.br/out/LerTexto.php?codTexto=2567
IPEA - Brasil Pós Covid-19 Contribuições do Instituto de Pesquisa Econômica Aplicada (IPEA), Brasília,
2020.
ILOS. Matriz de Transportes a Espera de Investimentos. Available at: https://www.ilos.com.br/web/
tag/matriz-de-transportes/
49
Norwegian Embassy
BrasiliaYou can also read