Long-range convective ozone transport during INTEX
←
→
Page content transcription
If your browser does not render page correctly, please read the page content below
JOURNAL OF GEOPHYSICAL RESEARCH, VOL. 113, D14S90, doi:10.1029/2007JD009345, 2008
Long-range convective ozone transport during INTEX
M. L. Büker,1 Matthew H. Hitchman,1 Gregory J. Tripoli,1 R. B. Pierce,2 E. V. Browell,2
and J. A. Al-Saadi2
Received 1 September 2007; revised 11 February 2008; accepted 21 March 2008; published 18 July 2008.
[1] Ozone transport across the tropopause near a convective region in the central Pacific
is calculated for a 1-day period using a nested grid, high-resolution simulation with the
University of Wisconsin Nonhydrostatic Modeling System (UWNMS). This ozone is
then tracked into the region where DC-8 lidar ozone observations on 6 July 2004 were
taken over the United States during the Intercontinental Chemical Transport Experiment-
North America (INTEX-NA). On 2 July a convective complex developed north of the
Midway Islands and intensified as it propagated eastward. Satellite observations captured
this event well, and the UWNMS simulation placed the convection just east of an upper
level trough along the subtropical jet. The proximity of the strong convection to the
lowered tropopause resulted in significant stratospheric ozone contribution (SOC) to the
troposphere. During the 24 h period starting at 1200 UTC 2 July, total net ozone flux
into the troposphere was calculated to be about 0.2 Tg across the nested grid domain.
Because the convective outflow was feeding the subtropical jet, the SOC was quickly
transported across the eastern Pacific and into the INTEX-NA region. Using an ‘‘SOC
tracer’’ we show that a small but significant percentage of observed ozone on the DC8
flight can be attributed to SOC from this one convective event. This supports the idea
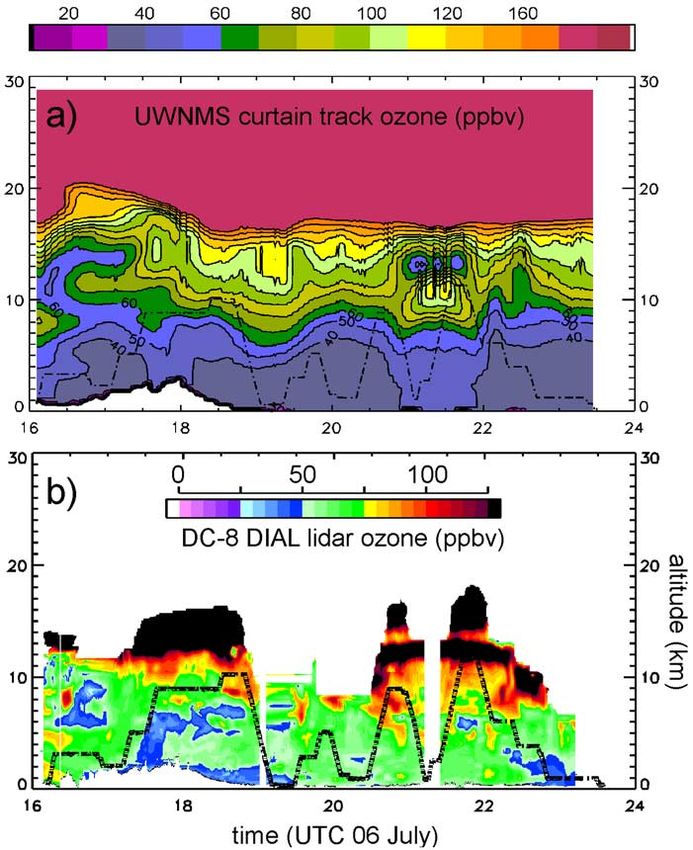
that the stratosphere over the Pacific is an important source of ozone for air entering North
America from the west.
Citation: Büker, M. L., M. H. Hitchman, G. J. Tripoli, R. B. Pierce, E. V. Browell, and J. A. Al-Saadi (2008), Long-range convective
ozone transport during INTEX, J. Geophys. Res., 113, D14S90, doi:10.1029/2007JD009345.
1. Introduction on 2 July developed near an upper level trough, just
southwest of a jet streak. The University of Wisconsin
[2] One of the primary goals of the Intercontinental Chem- Nonhydrostatic Modeling System (UWNMS) was used to
ical Transport Experiment-North America (INTEX-NA) was simulate this convection and its effect on ozone redistribution.
to quantify transpacific transport of ozone from anthropo- A schematic diagram of this process is shown in Figure 1.
genic sources in east Asia and the stratospheric ozone [4] In addition, the outflow from the convection led to
contribution (SOC) over the Pacific and their impact on
enhancement of the jet streak [e.g., Fritsch and Maddox,
tropospheric ozone over North America [Singh et al.,
1981; Mecikalski and Tripoli, 1998, 2003], creating a
2006]. The INTEX-NA campaign was conducted during
conduit for long-range transport of SOC over North America.
1 July to 15 August 2004.
Four days later, INTEX DC-8 ozone observations on flight
[3] The onset of the summer monsoon over the western
4 surveyed a portion of the southwestern United States,
North Pacific (150 to 180°W) begins in July [e.g., Wu and
where a small, yet significant percentage of background
Wang, 2000], increasing low-level moisture convergence
tropospheric ozone could be attributed to the SOC by the
over the region. When an upper level trough (or jet streak)
convective event.
moves into this environment, mesoscale convective system
[5] This paper presents a case study yielding quantifica-
(MCS) formation can occur [e.g., Waugh and Funatsu,
tion of the SOC in the convective region. It also provides
2003] (hereinafter referred to as WF2003). These convec-
quantification of SOC transported into the INTEX-NA
tive events have been shown to be a significant source of
region.
SOC to the troposphere as a result of downwelling around
[6] Coincident studies involving SOC include Al-Saadi et al.
the periphery of the convection [Poulida et al., 1996;
[2005] (hereinafter referred to as AS2005), who examined the
Hitchman et al., 2004]. The MCS which began to form
time mean impact of SOC (among other constituents and
sources) over the INTEX domain using Lagrangian source-
1
receptor analysis, and found midlatitude upper tropospheric air
Department of Atmospheric Sciences, University of Wisconsin- had a significant source region in the central Pacific lower
Madison, Madison, Wisconsin, USA.
2
NASA Langley Research Center, Hampton, Virginia, USA. stratosphere. Pierce et al. [2007] calculated SOC using a
discrete method with the Realtime Air Quality Modeling
Copyright 2008 by the American Geophysical Union. System (RAQMS) in the context of a continental ozone budget
0148-0227/08/2007JD009345
D14S90 1 of 14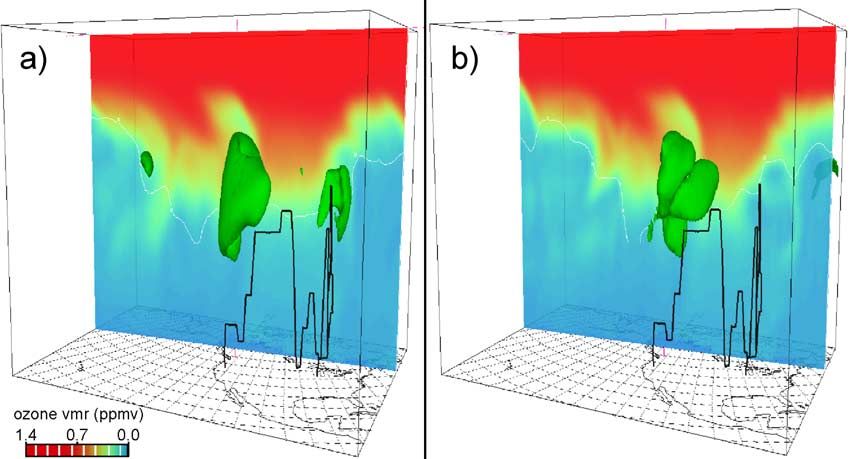
D14S90                      BÜKER ET AL.: CONVECTIVE OZONE TRANSPORT DURING INTEX                                       D14S90

         Figure 1. Schematic showing the domains of the inner and outer nested grid, horizontal path of INTEX-
         NA flight 4, and a general overview of the convectively induced long-range SOC transport process.

over North America. Since these analyses look at SOC over the      a global isentropic model [Johnson et al., 1993] and a
period of several weeks, they include various modes of SOC,        detailed chemistry package from the Langley IMPACT
including synoptic-scale events as tropopause folding and          model [Eckman et al., 1995] to create the Regional Air
Rossby wave breaking, as well as mesoscale events such as          Quality Modeling System (RAQMS) [Pierce et al., 2003].
convective complexes. A discussion comparing our local pro-          [10] We initialize the meteorological fields with Global
cesses with their bulk results is made in section 4.2. Many        Forecast System (GFS) analyses from the National Center
studies have aimed to quantify SOC in the vicinity of synoptic-    for Environmental Prediction with 1°  1° horizontal
scale disturbances [e.g., Wirth and Egger, 1999; Wei, 1987; Ebel   resolution, interpolated to a model grid with isotropic
et al., 1991; Lamarque and Hess, 1994; Sigmond et al., 2000;       horizontal resolution of 50 km. This large outer grid
Gray, 2003]. Büker et al. [2005] applied a new two-scale          spanned much of the central and eastern North Pacific
method toward calculating SOC in the vicinity of a strongly        region and North America, centered at 125°W and 45°N,
filamented jet and strengthening cyclone.                          with the domain extending 11,000 km zonally and 7,000 km
   [7] Hitchman et al. [2004] (hereinafter referred to as          meridionally. Additionally, for a 1-day period, a nested,
H2004) utilized this technique for a large convective event        two-way interactive grid with 12.5 km horizontal resolution
over east Asia, and found that about 0.8 Tg d1 of ozone           was placed at 35°N and 168°W, spanning 1,250 km on each
entered the troposphere around the periphery of the con-           side. Figure 1 shows the horizontal extent of both the inner
vection. Given the frequency of convective events over the         and outer grids. Vertical resolution was kept constant for all
central Pacific (WF2003), it is desirable to examine the           simulations at 300 m, with the top of the domain extending
ozone flux around a convective complex in the context of           to 22.5 km. Rayleigh friction sponge layers were imple-
long-range transport of SOC.                                       mented on the sidewalls (7 grid points) and top (10 grid
   [8] A description of the UWNMS and model specifica-             points) of each domain. The UWNMS has several convec-
tions are provided in section 2, followed by details of the        tive parameterizations that can be used; we have chosen the
two-scale method and SOC tracer, and an overview of                Emanuel moist convection scheme for consistency with
aircraft and satellite data used in this study. Section 3 gives    other RAQMS studies. Three dimensional ozone profiles
asynoptic overview of the case study for both the convective       of the same resolution as the GFS data are obtained from
region and the far-field domain along with UWNMS simu-             RAQMS simulations [Pierce et al., 2007] and allowed to
lation results. Section 4 describes INTEX-NA DC-8 flight 4         advect as a passive tracer. After initialization, the boundary
observations and compares them with our results. A summary of      conditions are forced by subsequent analyses, linearly
the results is given in section 5.                                 interpolated in time and space with updates every 6 h, while
                                                                   the interior is allowed to evolve within the parameters of the
2. Model and Observational Data                                    model physics. Standard meteorological fields (e.g., winds,
                                                                   temperature, pressure, water vapor, rainfall) as well as
2.1. UWNMS Specifications and Initialization
                                                                   derived and constituent fields (e.g., potential vorticity and
  [9] The UWNMS is a multiscale numerical weather                  ozone) are archived at 20 and 30 min intervals in VIS-5D
prediction model, applicable physics scalable to processes         format [Hibbard et al., 1994], with the simulations spanning
on scales ranging from meters to typical general circulation       5 days. The model time step for the outer grid was 60 s, and
model resolutions [Tripoli, 1992] along with two-way,              15 s for the inner grid.
interactive multiple nested grid capabilities. The model
has a history of utilization in recent field campaigns such        2.2. Two-Scale Method and SOC Tracer
as the SAGE III Ozone Loss and Validation Experiment                 [11] Mass flux across the tropopause is calculated using
(SOLVE), and Transport and Chemical Evolution over the             the two-scale method described by Büker et al. [2005], with
Pacific (TRACE-P) campaigns [Hitchman et al., 1999,                some minor modification. A range of PV values spans the
2003, 2004]. The UWNMS has also been combined with                 upper troposphere and lower stratosphere. The 1.3 potential

                                                             2 of 14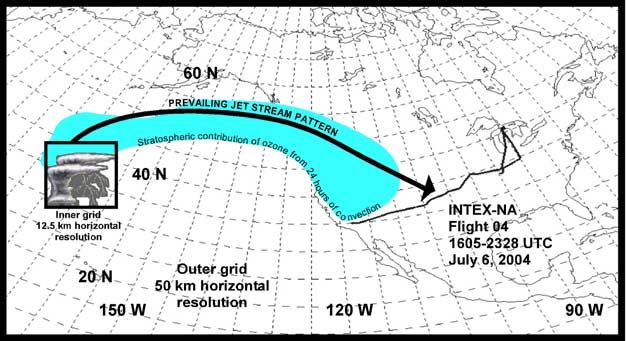
D14S90                     BÜKER ET AL.: CONVECTIVE OZONE TRANSPORT DURING INTEX                                       D14S90

         Figure 2. (a) Structure of the tropopause (1.3 PVU surface) at 1200 UTC 2 July 2004. The surface is
         shaded by pressure (hPa), where darker indicates a lower altitude. Sea level pressure (black contours,
         every 2 hPa) is also indicated. Note the surface trough (denoted with an ‘‘L’’) and upper level shortwave
         (white dashed line) around 37°N and 175°W. (b) Horizontal streamlines and equivalent potential
         temperature (K) at 1 km altitude for the same time, showing surface convergence and a plume of moisture
         in the vicinity of the surface low.

vorticity unit (PVU) surface is used for this study. The low-   The parameters c and g are chosen to tune the filter, and l is
pass filter used to separate the wind field into the advec-     the wavelength. With c = 30000 and g = 0.1, the filter
tive, conserving flow (Vs) and smaller-scale (resolved)         retains 90% of the wind field at 1000 km, 60% at 500 km,
nonconservative ‘‘mixing’’ motions (Vm = V  Vs) is             and 25% at 300 km scales. As opposed to the 1-2-1
now based on the modified Barnes scheme [Barnes, 1973].         ‘‘triangle filter’’ used by Büker, et al. [2005] (where
The response of this filter [Maddox, 1980] is given by          hundreds of passes are needed at high resolution and large
                                                                spatial scales [Haltiner and Williams, 1980]), only two

                  R ¼ R0 1 þ Rg1  Rg0 ;                       passes are required for tuning the filter to the correct spatial
                              0
                                                                scale. Additionally, the dropoff in the response function is
                                                                much sharper around horizontal scales of 300– 500 km,
where                                                           which was shown to be an ideal separation scale [Büker et
                                                               al., 2005]. The PV tropopause is calculated and advected
                    R0 ¼ exp p2 4c=l2 :                        using this smoothed wind field, with its motion described by
                                                                (Vs  n)n, with n the local vector norm of the tropopause
                                                                surface. Flux is then assigned the value of the mixing wind

                                                           3 of 14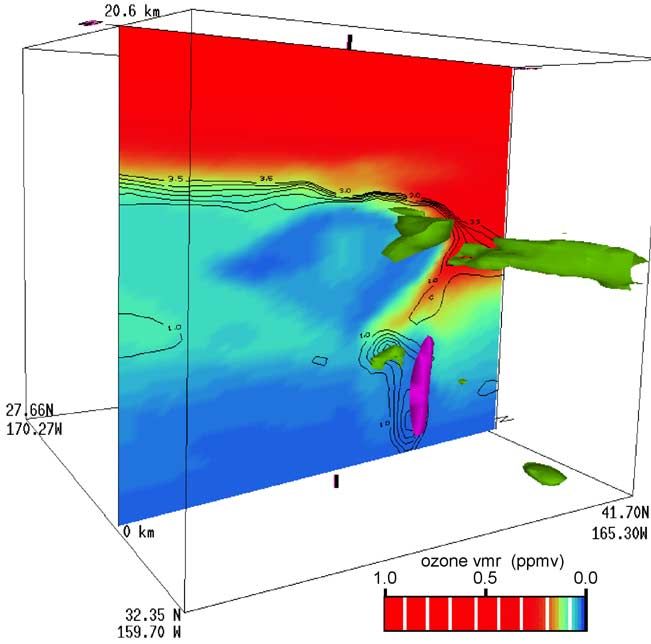
D14S90                     BÜKER ET AL.: CONVECTIVE OZONE TRANSPORT DURING INTEX                                        D14S90

         Figure 3. (a) Vertical motion (0.1 m s1 isosurface, indicating convection in the UWNMS) and 11.5 km
         horizontal streamlines (black) and isotachs (grey, every 10 m s1) at 0000 UTC 3 July, showing the
         direction of the convective outflow. (b) A GOES 9 infrared image for 0302 UT 3 July, with an L
         indicating the position of the surface low and convection.

normal to the tropopause, or cO3(Vm  n)n, where cO3 is the      time interval. In terms of advection, diffusion, and other
local ozone number density. The ozone field is left              modes of transport, it is treated as any other passive tracer in
unaltered, retaining the small-scale variability of both the     the model. The tracer can accumulate in the inner grid, but
tracer and of Vm to obtain the fine structure of the flux        is allowed to advect into the larger domain. This allows for
normal to the smoothed PV surface, circumventing                 direct attribution of SOC due to the convective region in the
uncertainty in gradient calculations of a noisy PV field,        far-field.
and providing an upper limit on the flux without resorting to      [13] To more accurately simulate photochemical influen-
uncertainties in real and numerical diffusion.                   ces, ozone production and loss rates were calculated by the
  [12] Upon calculation of SOC using this method, a              global isentropic and chemistry components of the
passive ‘‘SOC tracer’’ is increased or decreased in value        RAQMS, interpolated to the outer grid and updated every
according to the sign and magnitude of the instantaneous         6 h.
flux. Values can be added or subtracted to account for ozone
transported both into and out of the stratosphere. As the flux   2.3. Observational Data
was calculated and archived only every 20 min (because of          [14] Water vapor imagery from GOES 9 and GOES 10
computational expense), the value was multiplied by that         was provided by the Space Science and Engineering and the
                                                                 National Climate Data Center. Visible and infrared imagery

                                                            4 of 14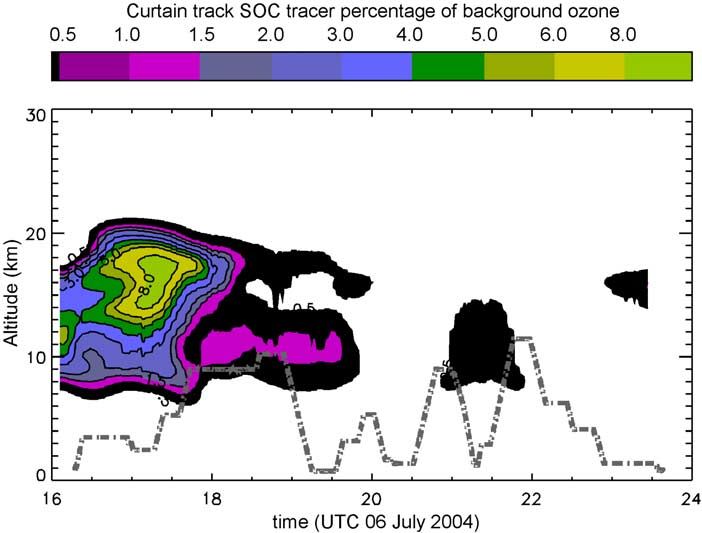
D14S90                     BÜKER ET AL.: CONVECTIVE OZONE TRANSPORT DURING INTEX                                     D14S90

         Figure 4. A view of convection in the inner grid at 0000 UT 3 July, showing (a) vertical motion
         exceeding 0.1 m s1, contours of sea level pressure (every 2 hPa), and surface wind vectors. (b) A
         northwest-southeast vertical cross section (position shown above) of ozone (ppmv, shaded), vertical
         motion (white contours, every 0.02 m s1, dashed for downward velocities), and the 1.3 PVU contour
         (black). Note the horizontal convergence in Figure 4a and ‘‘V-shaped’’ pattern of vertical velocity
         (indicating gravity waves) in Figure 4b.

from Japan’s Geostationary Meteorology Satellite 5 (GMS-5)       first 12 h from 0000 UTC to 1200 UTC 2 July. The inner
were used to correlate synoptic and convective features in the   grid was activated for the next 24 h of the simulation,
simulations. Time-height profiles of Langley Differential        until 1200 UTC 3 July. After this, only the outer grid was
Absorption Lidar (DIAL, see http://asd-www.larc.nasa.gov/        used for the remaining 84 h of integration, until 0000 UTC
lidar/intex-na/dial/04.html) ozone for DC-8 flight 4 are used    7 July.
to compare with ozone structure in the UWNMS.                      [16] Figure 2a shows mean sea level pressure and the
                                                                 1.3 PVU isosurface shaded by pressure for 1200 UTC 2 July.
3. Case Study for INTEX-NA Flight 4:                             The feature of interest is a compact shortwave, centered just
2–6 July 2004                                                    west of surface low pressure (L) near 37°N, 175°W. This
                                                                 shortwave was traveling northeastward around a large upper
3.1. Synoptic Overview, Convective Region: 2 – 3 July            ridge extending from 20 to 35°N and 160°W to the dateline.
  [15] The UWNMS simulation was carried out in three             Figure 2b shows values of equivalent potential temperature
stages. Only the outer grid (see section 2) was used for the

                                                            5 of 14
D14S90 BÜKER ET AL.: CONVECTIVE OZONE TRANSPORT DURING INTEX D14S90
Figure 5. As in Figure 2a, at 1200 UT for (a) 3 July, (b) 4 July, (c) 5 July, and (d) 6 July, showing the
large Rossby wave breaking (RWB) feature extending from the southwestern United States to north of
Hawaii. The strong potential vorticity anomaly (and convectively enhanced ridge south of it) moves east
across the Gulf of Alaska, disturbing the RWB signature and pushing the ridge over the western United
States.
6 of 14D14S90 BÜKER ET AL.: CONVECTIVE OZONE TRANSPORT DURING INTEX D14S90
Figure 6. Four-day trajectories initialized 1200 UTC 3 July in the vicinity of the convection at 11.5 km.
Note the split flow near the shortwave over the Rockies.
(qe) and horizontal streamlines at 1 km altitude for the same is collocated with the strongest convection. Figure 4b is a
time period. Strong surface convergence can be seen in the vertical cross section of ozone mixing ratio, the 1.3 PVU
vicinity of the shortwave. Southwesterly flow is bringing contour, and vertical motion. Relatively high mixing ratio
high qe air from a region where the monsoonal circulation values are being brought down around the periphery of the
becomes established during this time of year [Wu and Wang, convection (as evidenced by higher values of downward
2000]. It is not surprising that convection developed in the vertical velocities), while low tropospheric values are trans-
region just east of the shortwave, given this combination of ported up through the convective turret [Poulida et al.,
strong moisture convergence at low levels, pressure height 1996]. H2004 examined a similar case study with dramatic
falls and positive vorticity advection [Holton, 1992]. In downwelling (and associated SOC) surrounding a meso-
addition, Figure 3 (top) reveals that this area should also scale convective system. Squall lines also tend to produce a
experience enhanced ascent, as it underlies the right rear broad spectrum of gravity and inertia-gravity waves
quadrant of a large jet streak (shaded regions) [Bluestein, [Alexander et al., 1995] which can contribute to strato-
1993]. This collocation of a narrow stratospheric intrusion sphere-troposphere exchange (STE) through Stokes drift
and transient convection occurs quite frequently over the [Stokes, 1847]. and wave breaking. The vertical motion
central and eastern North Pacific, with static stability being field shows the typical ‘‘V-shaped’’ structures in the strato-
reduced in the upper troposphere (WF2003). Upper tropo- sphere emanating from the top of the convection [Holton,
spheric streamlines also show upper level divergence in this 1992]. The close juxtaposition of the convective system
area, enhancing upward motion. The 0.1 m s1 isosurface with the lowered tropopause of the compact shortwave max-
(dark ‘‘blobs’’) shows where convection is being simulated. imized the potential for STE in both directions. A 24-h inte-
[17] These storms organized into a multicellular squall gration was chosen to capture the bulk of this activity. Once
line, as the 0– 4 km wind shear (not shown) was fairly strong SOC was produced in this region, the intensified jet trans-
and unidirectional. GOES 9 Satellite imagery (10.7 mm ported it nearly a quarter of the way around the 45°N latitude
infrared) (Figure 3, bottom) for 0400 UTC 3 July shows a circle.
line of convection extending from 45°N, 155°W to 32°N,
170°W, which correlated very well with the UWNMS loca- 3.2. Synoptic Overview, Long-Range Transport and
tion for the convection. The convection had two effects on the Flight 4: 3– 6 July
jet: first, by acting as a solid body impinging from below, the [19] The broader synoptic situation is depicted in Figure 5,
jet was redirected northward. Second, by transporting west- with the pressure-shaded 1.3 PVU isosurface and mean sea
erly momentum further northward, the jet intensified on the level pressure contours for 3 –6 July. A large reversal in the
northeastern flank of the convective complex. Mecikalski and meridional PV gradient is evident throughout the sequence
Tripoli [1998] investigated this type of momentum transfer in varying intensity, stretching from the west coast of the
(conversion of ‘‘inertial available kinetic energy’’) through United States to north of Hawaii. This is a signature of a
convection. The intensified jet stream, collocated with con- Rossby wave breaking (RWB) event, a common occurrence
vectively driven stratospheric downwelling, would provide in this region during boreal summer [Postel and Hitchman,
an ideal conduit for long-range transport of SOC. 1999, 2001; Hitchman and Huesmann, 2007]. RWB occurs
[18] Figure 4a shows the inner grid of the simulation, centered near 45°N, 135°W, with considerable mixing of
with sea level pressure, surface winds, and the 0.1 m s1 tropical tropospheric and stratospheric air above the surface
isosurface of vertical motion on 0000 UT 3 July. The squall high. This is an example of an ‘‘LC1’’ equatorward wave-
line was well developed by this point, with vertical veloc- breaking event [Thorncroft et al., 1993]. The convection
ities exceeding 2.5 m s1 in the strongest cells. Strong associated with the shortwave, approaching from the west
convergence is noted in the surface wind field (arrows) near 50°N, 155°W, further intensified the ridge (through the
along the axis of convection. On the periphery of the redistribution of lower tropospheric PV to higher altitudes
broader synoptic depression, a compact area of low pressure by latent heating [Hoskins et al., 1985]), thereby enhancing
7 of 14D14S90 BÜKER ET AL.: CONVECTIVE OZONE TRANSPORT DURING INTEX D14S90
Figure 7. (a) Spatially integrated net ozone flux (SOC) with time for the inner grid (see Figure 1) from
1200 UTC 2 July to 1200 UTC 3 July. Negative values indicate flux into the troposphere. (b) Tendency of
SOC tracer with time. Note the close agreement early in the period, with a decreasing trend in SOC for
the inner grid as tracer leaves the domain.
8 of 14D14S90 BÜKER ET AL.: CONVECTIVE OZONE TRANSPORT DURING INTEX D14S90
Figure 8. Vertical cross section of ozone (colored/shaded index, ppmv) and contours of potential
vorticity (every 0.5 PVU) perpendicular to the line of convection in the inner grid at 0800 UTC 3 July.
Isosurfaces of vertical motion (purple, 0.5 m s1), and SOC (green, values exceeding 40% of the
background ozone) are also shown. Convective dilution of ozone is evident, while SOC is prevalent
along the northern flank of the convection, above a small tropopause fold. A patch of new SOC is also
generated where convection is impinging on the fold. Note that the SOC tracer indicates accumulated
flux, not instantaneous values.
the meridional PV gradient (and the associated jet streak). studies of STE and convective complexes [e.g., Poulida et
Another shortwave anomaly near 50°N, 125°W traveled al., 1996; H2004]. Integrating over the 24 h, the total net
eastward, a feature encountered on INTEX flight 4 over the flux out of the domain was 2.3 1033 molecules, or about
western United States. 0.2 Tg ozone. H2004 estimated about 0.8 Tg of SOC
[20] Figure 6 shows 4-day trajectories, initialized at associated with a larger convective complex for 1 day.
11.5 km (within the convective outflow) and the plan view Poulida et al. [1996] used aircraft observations to obtain a
of flight 4. The flow stays fairly contained within the jet minimum of 0.02 Tg SOC around the periphery of an MCS
stream, with a split occurring over the western United in its developing stage, but for a shorter time. In addition to
States. The majority of the trajectories end up over the the strong downwelling around the convection, a strong PV
southwestern United States by the time flight 4 commences. anomaly was also situated along the northern flank of the
This provides a qualitative picture of the impact of STE and convective area, with a structure resembling a small tropo-
long-range transport on the beginning portion of the flight pause fold.
domain. [22] Figure 8 shows a vertical-meridional cross section
through the inner grid of ozone (colored slice), PV contours
3.3. Ozone and SOC Analysis near the tropopause, and an isosurface of vertical motion
3.3.1. Inner Grid: 2 – 3 July (purple) exceeding 0.5 m s1 at 0800 UTC 3 July, just after
[21] Total net flux of ozone over the inner grid was the period of the most vigorous convection. Ozone-poor air
calculated for the 24-h period starting 1200 UTC 2 July. from the lower troposphere has been injected into the upper
Negative flux indicates transfer down the PV gradient (into troposphere by the convection. Downwelling is apparent on
the troposphere) while positive flux indicates upgradient the flanks of the convection, with high values reaching into
transfer. The domain integrated values are computed at each the middle troposphere. On the northern flank, the down-
time and plotted in Figure 7a. This shows a maximum in net welling appears to be coincident with a small tropopause
flux occurring between 0200 and 0800 UTC, which coin- fold (and high ozone values) extending into the middle
cides with peak diurnal heating. The peak value of nearly troposphere. New convection is occurring in the simulation
8 1028 ozone molecules s1 is comparable to other
9 of 14D14S90 BÜKER ET AL.: CONVECTIVE OZONE TRANSPORT DURING INTEX D14S90
Figure 9. Progression of the 5 ppbv isosurface of SOC tracer at (a) 2100 UTC 3 July, (b) 1200 UTC
4 July, (c) 1900 UTC 5 July, and (d) 1600 UTC 6 July. GOES 10 water vapor images are shown for
(e) 2100 UTC 3 July and (f) 1200 UTC 4 July. Note the ‘‘arcing dolphin’’ shape in both the isosurface
and the convective outflow in the water vapor imagery. The isosurface encounters the split flow and
separates into two segments by 6 July.
nearly under this structure. High values of convectively tracer can also be seen leaving the eastern boundary of the
generated PV in the lower and middle troposphere are seen inner grid.
in the slice as well. Also shown is a green isosurface [23] Since the flux is only calculated every 20 min, this
depicting where the SOC tracer value exceeds 40% of the introduces some error in the value of the tracer. Given the
background ozone value (recall that the SOC tracer is a integration of the calculation over 24 h, it is assumed that
measure of accumulated ozone flux). The tracer value is cancelation of spuriously high instantaneous flux values at
highest along the northern flank of the convectively mod- any given time will allow for a reasonable first-order
ified region, although some higher values also appear near quantification. Figure 7b shows the total tendency of
the ongoing convection, indicating some history of deeper ‘‘SOC molecules’’ with time for the inner grid. For the first
mixing. The high percentage is attributable to both the 18 h downward ozone transport increased SOC in the inner
strong downwelling surrounding the convection, and that grid. Thereafter, a decreasing trend in SOC is seen as SOC
background values are lower because of the convective tracer is advected eastward out of the inner domain.
dilution. (The values appearing right near the surface are 3.3.2. Outer Grid: 3 – 6 July
likely due to a convectively induced lower tropospheric PV [24] Figures 9a – 9d show the evolution of the 5 ppbv
maximum and very low background values of ozone.) SOC SOC isosurface as it is transported across the Pacific. The
10 of 14D14S90 BÜKER ET AL.: CONVECTIVE OZONE TRANSPORT DURING INTEX D14S90
Figure 10. Horizontal projection of DC8 INTEX-NA flight 4 during 1605 to 2328 UTC 6 July 2004,
superimposed on water vapor imagery from GOES 10 at 1945 UTC. Shaded segments delineate the time
(top left) and altitude (bottom left) of the DC-8 during the flight.
tracer is drawn out zonally along the jet axis, with the bulk changes in the flight plan. Pollution plumes were sampled
traveling northeast over the top of the upper level ridge. A in the middle and upper troposphere. The flight passed
‘‘forked tail’’ develops on the southwestern end of the through a cold front just before the northward turn near
isosurface as a result of convective dilution of the tracer. St. Louis (MO), along an upper tropospheric leg to near
The convective outflow is readily seen on GOES 10 water Sault Sainte Marie (MI), followed by a descent to St. Louis.
vapor imagery (Figures 9e and 9f). The tracer is advected Cloudiness forced an ascent before a step down through the
over North America, with one main portion settling over the troposphere back to Mid America Airport (near St. Louis);
southwestern United States and northern Mexico, and the aerosols and nitric acid were prevalent along with low
other streaming across the U.S.-Canadian border. By flight ozone levels in the boundary layer leg east of St. Louis.
time (1600 UTC 6 July), a small but significant amount of [26] Figure 11a shows a curtain profile of UWNMS
SOC was positioned over the beginning portion of the flight ozone along an interpolated flight track, while Figure 11b
track (Figure 9d). The portion of SOC over the southwest- shows observed lidar data on flight 4. It is evident there are
ern United States lingered for several days past 6 July when some discrepancies in the values of ozone in some regions,
the simulation was allowed to progress father, indicating a but much of the structure is well correlated. Since the
region of stagnant air. simulation does not have a full chemistry package, lower
tropospheric ozone values will tend to have more error, as
4. Data Comparison and Results source regions near the surface will dominate the variability.
Interpolation errors of UWNMS values to the flight track
4.1. Flight 4 Goals and Observations
also can contribute to the discrepancies. The main features
[25] Flight 4 of the INTEX-NA campaign was a transit in the lidar curtain profile are captured, such as the shape of
flight from Dryden Flight Research Center, California to the ozonopause, the relative maximum of ozone between 9
Mid-America Airport, Illinois. Figure 10 shows a detailed and 13 km during 2100– 2200 UT, and the middle and
plan view of the flight track along with the height of each upper tropospheric values of ozone observed by lidar
flight segment in the lower left corner. Science objectives of generally agree with modeled values.
INTEX-NA included identifying boundary layer pollution [27] Figure 12 shows a three-dimensional representation
from California and fires over Arizona, analyzing convec- of the flight track, along with a vertical cross section of
tive outflow over the Midwest, as well as observing frontal modeled ozone, and an isosurface representing SOC values
structures and boundary layer pollution over the Ohio exceeding 5% of the background ozone value. Figure 12
Valley. Another objective was to characterize upper tropo- also shows how much of the flight path just missed the bulk
spheric import from Asia. Over the beginning stages of the of the SOC tracer, with the isosurface seeming to ‘‘curl
flight, elevated boundary layer pollution was noted, with around’’ the flight path. A curtain profile of SOC tracer, in
sources from California and fires over Colorado and percentage of background model ozone, are shown in
Arizona. Farther to the east, an ascent into the upper Figure 13. Values exceeding 8% are shown near the
troposphere found weak pollution signatures, surmised to tropopause (about 15 km) during the beginning portion of
be from both Asia and the United States. Widespread the flight. The original flight plan called for an earlier (by
convection over the central United States forced some about an hour) ascent to the upper troposphere. It would
11 of 14D14S90 BÜKER ET AL.: CONVECTIVE OZONE TRANSPORT DURING INTEX D14S90
Figure 11. Comparison of interpolated UWNMS ozone with DC-8 DIAL lidar ozone for INTEX
flight 4. (a) Curtain profile of interpolated UWNMS ozone along the flight and flight altitude (dashed
line). (b) DC-8 DIAL lidar ozone and flight altitude (dashed line).
have been interesting to see more of the ozone structure at SOC for the summer season, from just convective ozone
higher altitudes earlier in the flight, as this would have STE, yields about 50 Tg of ozone.
captured more of the region where the SOC was most
prevalent. 4.2. Coincident Studies
[28] Although the values of SOC are quite small com- [29] Al-Saadi et al. [2005] analyzed long-range transport
pared to the background ozone field, it is somewhat for the entire INTEX campaign using a Lagrangian source-
surprising that a significant percentage of ozone can be receptor scheme. They found that midlatitude, upper tropo-
directly attributed to a 1-day source more than 5000 km spheric air over the INTEX region had a high correlation
distant. One might expect a more diffusive distribution of with sources near the tropopause over the subtropical and
the SOC in cases where the jet stream is not so confined. midlatitude Pacific when looking at time scales of 4 to
Given that these types of convective systems occur quite 7 days. They also found this air to be characterized by
regularly over the central Pacific, one must conclude that strong Lagrangian mixing and elevated stratospheric influ-
convectively induced SOC plays a large role in tropospheric ence. Our study focusing on a singular event of long-range
ozone over North America, as well as the global strato- transport corroborates well with these findings. The settling
spheric and tropospheric ozone budgets. Assuming there are of SOC into the ridge over the southwestern United States
three convective complexes similar to this study on any (which persisted well beyond 6 July) is also consistent with
given day across the North Pacific, an estimate of the total the findings of AS2005, with upper tropospheric air over
12 of 14D14S90 BÜKER ET AL.: CONVECTIVE OZONE TRANSPORT DURING INTEX D14S90
Figure 12. Vertical cross section of ozone (colored/shaded), the 1.3 PVU contour (white) across the
outer domain, isosurface where SOC exceeds 5% of the background value of ozone, and the path of
INTEX flight 4, for (a) 2200 UT 5 July and (b) 1700 UT 6 July.
North America having a local source in the upper tropo- over the central Pacific 3 days before. The UWNMS,
sphere at timescales of up to 10 days. This would seem to initialized with RAQMS ozone fields, provided qualitative
indicate a prevalence of upper tropospheric stagnation. and quantitative pictures of the influence of this convection
on tropospheric ozone over the INTEX-NA region. A two-
5. Conclusions scale method was used to determine the SOC in the region
of convection within a nested grid, with a tracer represen-
[30] Aircraft observations of ozone on the INTEX-NA tation of this ozone allowed to advect into the larger
transit flight of 6 July 2004 intersected a region influenced domain. Our analysis indicates that only 1 day of convec-
by long-range transport of SOC from a convective complex tion yielded about 0.2 Tg of SOC, which was quickly
Figure 13. Curtain profile of SOC tracer as a percentage of background ozone along the flight track in
the UWNMS. Values exceeded 8% at altitudes above the early portion of the flight.
13 of 14D14S90 BÜKER ET AL.: CONVECTIVE OZONE TRANSPORT DURING INTEX D14S90
advected across the Pacific and over North America by a polar stratospheric clouds during December 1999, J. Geophys. Res.,
108(D5), 8325, doi:10.1029/2001JD001034.
convectively enhanced jet streak. Tracer values nearing 10% Hitchman, M. H., M. L. Buker, G. J. Tripoli, R. B. Pierce, J. A. Al-Saadi,
of the total ozone field were simulated over the southwest- E. V. Browell, and M. A. Avery (2004), A modeling study of an east
ern United States 3 days later. We also found that, since the Asian convective complex during March 2001, J. Geophys. Res., 109,
D15S14, doi:10.1029/2003JD004312.
SOC tends to be near (or mixed with) convective outflow, Holton, J. R. (1992), An Introduction to Dynamic Meteorology, 3rd ed.,
the percentage of SOC was higher given the typical dilution Academic, San Diego, Calif.
of ozone in the core of the MCS. Tropospheric observations Hoskins, B. J., M. E. McIntyre, and A. W. Robertson (1985), On the use
of ‘‘stratospheric influence’’ (such as ozone) are typically and significance of isentropic potential vorticity maps, Q.J.R. Meteorol.
Soc., 111, 877 – 946.
correlated with low water vapor. This particular case shows Johnson, D. R., T. H. Zapotocny, F. M. Reames, B. J. Wolf, and R. B. Pierce
that convectively induced SOC would likely not have a (1993), A comparison of simulated precipitation by hybrid isentropic
strong anticorrelation with water vapor. Our findings are sigma and sigma models, Mon. Weather Rev., 121, 2088 – 2114.
Lamarque, J. F., and P. G. Hess (1994), Cross-tropopause mass exchange
also in agreement with longer-term attribution studies and potential vorticity budget in a simulated tropopause folding, J. Atmos.
showing a strong correlation of convectively mixed and Sci., 51(15), 2246 – 2269.
stratosphere-influenced air in the upper troposphere over Maddox, R. A. (1980), An objective technique for separating macroscale
and mesoscale features in meteorological data, Mon. Weather Rev., 108,
North America with sources over the central Pacific near the 1108 – 1121.
tropopause for synoptic timescales. Given the climatology Mecikalski, J. R., and G. J. Tripoli (1998), Inertial available kinetic energy
of similar convective systems over the central Pacific, we and the dynamics of tropical plume formation, Mon. Weather Rev.,
conclude that the convectively enhanced SOC and its long- 126(8), 2200 – 2216.
Mecikalski, J. R., and G. J. Tripoli (2003), Influence of upper-tropospheric
range transport make an important quantitative contribution inertial stability on the convective transport of momentum, Q.J.R.
to ozone over the United States. Meteorol. Soc., 129(590), 1537 – 1563.
Pierce, R. B., et al. (2003), Regional air quality modeling system (RAQMS)
predictions of the tropospheric ozone budget over east Asia, J. Geophys.
[31] Acknowledgments. We thank the INTEX science team for their Res., 108(D21), 8825, doi:10.1029/2002JD003176.
careful measurements, planning, and analysis which made this work Pierce, R. B., et al. (2007), Chemical data assimilation estimates of con-
possible. We thank Amanda Kis for obtaining and archiving satellite data tinental U.S. ozone and nitrogen budgets during the Intercontinental
for this study. We gratefully acknowledge support from NASA TRACE-P Chemical Transport Experiment North America, J. Geophys. Res., 112,
grant NCC1-01-011 and ACMAP grant NAG5-11303. D12S21, doi:10.1029/2006JD007722.
Postel, G. A., and M. H. Hitchman (1999), A climatology of Rossby wave
References breaking along the subtropical tropopause, J. Atmos. Sci., 56, 359 – 373.
Alexander, M., J. Holton, and D. Durran (1995), The gravity wave response Postel, G. A., and M. H. Hitchman (2001), A case study of Rossby wave
above deep convection in a squall line simulation, J. Atmos. Sci., 52, breaking along the subtropical tropopause, Mon. Weather Rev., 129,
2212 – 2226. 2555 – 2569.
Al-Saadi, J., et al. (2005), Lagrangian characterization of the sources and Poulida, O., R. Dickerson, and A. Heymsfield (1996), Stratosphere-
chemical transformation of airmasses observed by the NASA DC-8 during troposphere exchange in a midlatitude mesoscale convective complex:
ICARTT/INTEX-A, Eos Trans. AGU, 86(52), Fall Meet. Suppl., Abstract 1. Observations, J. Geophys. Res., 101(D3), 6823 – 6836, doi:10.1029/
A53D-04. 95JD03523.
Barnes, S. L. (1973), Mesoscale objective map analysis using weighted Sigmond, M., J. Meloen, and P. Siegmund (2000), Stratosphere-troposphere
time-series observations, NOAA Tech. Memo. ERL NSSL-69, 60 pp., Natl. exchange in an extratropical cyclone, calculated with a Lagrangian method,
Severe Storms Lab., Norman, Okla. Ann. Geophys. Atmos., 18(5), 573 – 582.
Bluestein, H. (1993), Synoptic-Dynamic Meteorology in Midlatitudes, vol. Singh, H. B., W. H. Brune, J. H. Crawford, D. J. Jacob, and P. B. Russell
II, 594 pp., Oxford Univ. Press, New York. (2006), Overview of the summer 2004 Intercontinental Chemical
Büker, M. L., M. H. Hitchman, G. J. Tripoli, R. B. Pierce, E. V. Browell, Transport Experiment North America (INTEX-A), J. Geophys. Res.,
and M. A. Avery (2005), Resolution dependence of cross-tropopause 111, D24S01, doi:10.1029/2006JD007905.
ozone transport over east Asia, J. Geophys. Res., 110, D03107, Stokes, G. G. (1847), On the theory of oscillatory waves, Trans. Cambridge
doi:10.1029/2004JD004739. Philos. Soc., 8, 441 – 455.
Ebel, A., et al. (1991), Simulation of ozone intrusion caused by a tropo- Thorncroft, C. D., B. J. Hoskins, and M. E. McIntyre (1993), Two paradigms
pause fold and cut-off low, Atmos. Environ., Part A, 25(10), 2131 – 2144. of baroclinic life-cycle behavior, Q.J.R. Meteorol. Soc., 119, 17 – 55.
Eckman, R. S., W. L. Grose, R. E. Turner, W. T. Blackshear, J. M. Russell Tripoli, G. J. (1992), A nonhydrostatic numerical model designed to simu-
III, L. Froidevaux, J. W. Waters, J. B. Kumer, and A. E. Roche (1995), late scale interaction, Mon. Weather Rev., 120, 1342 – 1359.
Stratospheric trace constituents simulated by a three-dimensional general Waugh, D. W., and B. M. Funatsu (2003), Intrusions into the tropical upper
circulation model: Comparison with UARS data, J. Geophys. Res., 100, troposphere: Three-dimensional structure and accompanying ozone and
13,951 – 13,966. OLR distributions, J. Atmos. Sci., 60(4), 637 – 653.
Fritsch, J. M., and R. A. Maddox (1981), Convectively driven mesoscale Wei, M. Y. (1987), A new formulation of the exchange of mass and trace
weather systems aloft Part II: Numerical simulations, J. Appl. Meteorol., consituents between the stratosphere and troposphere, J. Atmos. Sci.,
20, 20 – 26. 44(20), 3079 – 3086.
Gray, S. L. (2003), A case study of stratosphere to troposphere transport: Wirth, V., and J. Egger (1999), Diagnosing extratropical synoptic-scale
The role of convective transport and the sensitivity to model resolution, stratosphere-troposphere exchange: A case study, Q.J.R. Meteorol. Soc.,
J. Geophys. Res., 108(D18), 4590, doi:10.1029/2002JD003317. 125, 635 – 655.
Haltiner, G. J., and R. T. Williams (1980), Numerical Prediction and Wu, R. G., and B. Wang (2000), Interannual variability of summer mon-
Dynamical Meteorology, 2nd ed., John Wiley, New York. soon onset over the western North Pacific and the underlying processes,
Hibbard, W. L., B. E. Paul, D. A. Santek, C. R. Dyer, A. L. Battaiola, and J. Clim., 13(14), 2483 – 2501.
M. Voidrot-Martinez (1994), Interactive visualization of Earth and space
science computations, IEEE Comput., 27(7), 65 – 72.
Hitchman, M. H., and A. S. Huesmann (2007), A seasonal climatology of
Rossby wave breaking in the layer 330 – 2000 K, J. Atmos. Sci., 64, J. A. Al-Saadi, E. V. Browell, and R. B. Pierce, NASA Langley Research
1922 – 1940. Center, Hampton, VA 23681, USA. (jaal-saadi@larc.nasa.gov; e.v.browell@
Hitchman, M. H., M. L. Büker, and G. J. Tripoli (1999), Influence of larc.nasa.gov; r.b.pierce@larc.nasa.gov)
synoptic waves on column ozone during Arctic summer 1997, J. Geo- M. L. Büker, M. H. Hitchman, and G. J. Tripoli, Department of
phys. Res., 104, 26,547 – 26,563. Atmospheric and Oceanic Sciences, University of Wisconsin-Madison,
Hitchman, M. H., M. L. Buker, G. J. Tripoli, E. V. Browell, W. B. Grant, 1225 W. Dayton, Madison, WI 53706, USA. (bukerm@uwosh.edu;
T. J. McGee, and J. F. Burris (2003), Nonorographic generation of Arctic matt@aos.wisc.edu; tripoli@aos.wisc.edu)
14 of 14You can also read