MACHINE LEARNING PREDICTION OF BURST SUPPRESSION UNDER GENERAL ANESTHESIA - Biomedical Engineering Degree
←
→
Page content transcription
If your browser does not render page correctly, please read the page content below

Final Degree Project
 Biomedical Engineering Degree

 MACHINE LEARNING PREDICTION OF BURST
SUPPRESSION UNDER GENERAL ANESTHESIA

 Barcelona, 21st January 2022
 Author - Joana Collet i Fàbregas
 Tutor - Dr. Pedro Luís Gambús Cerrillo

ABSTRACT
During propofol-remifentanil induced general anesthesia, burst suppression (BS) EEG patterns
commonly occur in around 50% of the patients, with an increasing incidence with age. However,
this phenomenon has been reported to be an indicator of too high anesthetic doses and produce
adverse outcomes such as postoperative delirium, cognitive deficits, and it has even reported to be
a postoperative mortality predictor.

In light of the above, the present study aims to address the lack of predictive techniques for BS
occurrence anticipation by developing Machine Learning predictive models such as SVM, KNN,
RF, and XGB. Therefore, a large dataset including different monitored parameters during propofol-
remifentanil induced general anesthesia from many patients has been used for both training and
testing the models, as well as for final validation of the selected model.

Obtained results present an acceptable overall performance of the SVM model with a ROC-AUC
score of 0.829, and a feature importance analysis shows a high influence of age and BIS value for
the final prediction. Nonetheless, 25% of the predictions have been reported to have accuracies
under 0.6, questioning the reliability of the model and making it useful as an orientative aiding tool
for anesthesiologists, but not the ultimate decisive factor. Hence, further studies involving more
variability on the data, validation techniques and confidence intervals for each process, and an
exhaustive feature selection analysis, along with the repetition of the study with different ML
algorithms should be performed to improve the predictive ability of the current model and achieve
better performances.

Keywords: General anesthesia, Anesthesia monitoring, Burst Suppression, Predictive model,
Machine Learning

 ii

ACKNOWLEDGEMENTS
First of all, I would like to express my sincere appreciation to the project supervisor Dr. Pedro Luis
Gambús for offering me the opportunity to carry out this project with the SPEC-M research group
as well as for his supervision and advice throughout the project and for being always available for
any problem or doubt. Special thanks also to all the people working in operating room number 4 of
the CMA in Hospital Clínic, for making my stay there a very pleasant experience with a friendly
environment while allowing me to know how surgical surroundings work.

Secondly, I would like to show my deepest gratitude to Joan Altés for his continuous guidance and
help from the beginning of the project and throughout the development of the entire script and final
results evaluation. I am immensely thankful for his constant availability and for being so generous
with his time.

My greatest appreciation also to all my friends for accompanying me both in the study hours and
in my leisure time, always showing interest in anything related to this study, and for trusting in me
and the success of the project even when I doubted.

Last but not least, I am deeply thankful to my parents, Xevi and Susi, for encouraging me through
all my student years. For their patience, constant help, and unconditional support, and for teaching
me the importance of a job well done while enjoying it. Special thanks also to my mother for his
revision and counseling during the writing of the project and for always showing a smile when it
comes to giving a hand.

 iii

LIST OF FIGURES
Figure 1. Methogology flowchart .................................................................................................... 3
Figure 2. Electroencephalographic (EEG) Patterns during the Awake State, General Anesthesia,
and Sleep....................................................................................................................................... 5
Figure 3. Raw electroencephalogram waveforms of propofol-induced anesthesia ...................... 10
Figure 4. Decision boundaries approaches of different types of kernels for SVC models ............ 13
Figure 5. Example of ROC curve ................................................................................................. 16
Figure 6. Anesthesia control tower with the monitoring and anesthesia-infusion devices and
adapted keyboard for surgery-related events registration ............................................................ 26
Figure 7. Overview of the exclusion and selection process of data .............................................. 29
Figure 8. Structure of the input matrix for the ML models ............................................................ 30
Figure 9. QQ-plot description ....................................................................................................... 31
Figure 10. Schematics of the patients before and after the train-test split and the data processing
..................................................................................................................................................... 31
Figure 11. Number of patients by groups of age and barplot of BS occurrence by groups of age
and its respective error bars ........................................................................................................ 34
Figure 12. QQ-plots of each feature over four different known distributions ................................ 35
Figure 13. Boxplot of the distribution of the patients by groups of age for the training and testing
sets .............................................................................................................................................. 36
Figure 14. ROC curves for each model with its correspinding AUC score, and optimal threshold
for the model with highest AUC.................................................................................................... 36
Figure 15. Feature importance for RF and XGB models .............................................................. 37
Figure 16. Confusion matrix for the features and the label........................................................... 38
Figure 17. Highest and lowest accuracy performances of the BS occurrence predictive model .. 39
Figure 18. Distribution of the predicted probabilities against the label they should predict for the
highest and the lowest accuracy performances ........................................................................... 40
Figure 19. Accuracy frequency barplot and accuracy distribution boxplot.................................... 40
Figure 20. GANTT diagram for the project execution ................................................................... 45

 iv

LIST OF TABLES
Table 1. Common intravenous anesthetics classified according their effect .................................. 7
Table 2. Spectral frequency bands derived from EEG and their clinical meaning ........................ 10
Table 3. Confusion matrix layout comparing the real values with the predicted ones .................. 15
Table 4. Monitoring devices description and their commercial company ..................................... 24
Table 5. Monitored parameters and their description classified according to their acquisition
device .......................................................................................................................................... 25
Table 6. Feature and label structure of the data frame ................................................................ 28
Table 7. Different kernels and γ used for the SVC models .......................................................... 32
Table 8. Overview of the tasks of the project, their description and their estimated duration time
(in days) ....................................................................................................................................... 43
Table 9. GANTT legend ............................................................................................................... 44
Table 10. SWOT analysis on the project ...................................................................................... 46
Table 11. Costs and budget for the entire project ........................................................................ 48

 v
LIST OF ABBREVIATIONS

AI Artificial Intelligence

AMG Acceleromyography

BIS Bispectral index

BP Blood pressure

BS Burst suppression

BSR or SR Burst suppression rate

CF Confusion matrix

CMA Major ambulatory surgery area

CNS Central nervous system

COPD Chronic obstructive pulmonary disease

EEG Electroencephalogram

EMG Electromyography

FFT Fast Fourier Transform

FN False Negative

FP False Positive

KNN K-Nearest Neighbors

ML Machine Learning

 vi

MMG Mechanomyography

NIBP Non-invasive arterial blood pressure

RF Random Forest

ROC Reciever operating characteristic

SVC Support Vector Classifier

SVM Support Vector Machine

SWOT Strengths, Weaknesses, Opportunities and Threats

TCI Target controlled infusion system

TIVA Total intravenous anesthesia

TN True Negative

TNR True negative rate

TP True Positive

TPR True positive rate

XGB XGBoost

 vii
TABLE OF CONTENTS
Abstract ........................................................................................................................................ ii
Acknowledgements .................................................................................................................... iii
List of figures .............................................................................................................................. iv
List of tables ................................................................................................................................. v
List of abbreviations ................................................................................................................... vi
1. Introduction .......................................................................................................................... 1
 1.1. Description of the project ............................................................................................... 1
 1.2. Objectives ...................................................................................................................... 1
 1.3. Methodology and outline ................................................................................................ 3
 1.4. Scope and span ............................................................................................................. 4
 1.5. Limitations...................................................................................................................... 4
2. Background .......................................................................................................................... 5
 2.1. General anesthesia ........................................................................................................ 5
 2.1.1. Target effects of general anesthesia ...................................................................... 5
 2.1.1.1. Hypnosis ........................................................................................................ 6
 2.1.1.2. Analgesia ....................................................................................................... 6
 2.1.1.3. Amnesia ......................................................................................................... 6
 2.1.1.4. Akinesia ......................................................................................................... 6
 2.1.2. Anesthetic drugs .................................................................................................... 7
 2.1.2.1. Propofol.......................................................................................................... 8
 2.1.2.2. Remifentanil ................................................................................................... 8
 2.1.2.3. Rocuronium.................................................................................................... 8
 2.2. Anesthesia monitoring ................................................................................................... 8
 2.2.1. Basic monitoring systems ...................................................................................... 9
 2.2.1.1. Electrocardiogram .......................................................................................... 9
 2.2.1.2. Arterial blood pressure ................................................................................... 9
 2.2.1.3. Pulse oxymetry .............................................................................................. 9
 2.2.1.4. Capnography ................................................................................................. 9
 2.2.2. Advanced monitoring systems ............................................................................... 9
 2.2.2.1. Electroencephalogram ................................................................................... 9
 2.2.2.2. Bispectral index (BIS)................................................................................... 10
 2.3. Burst suppression ........................................................................................................ 11
 2.4. Predictive models......................................................................................................... 11

 viii
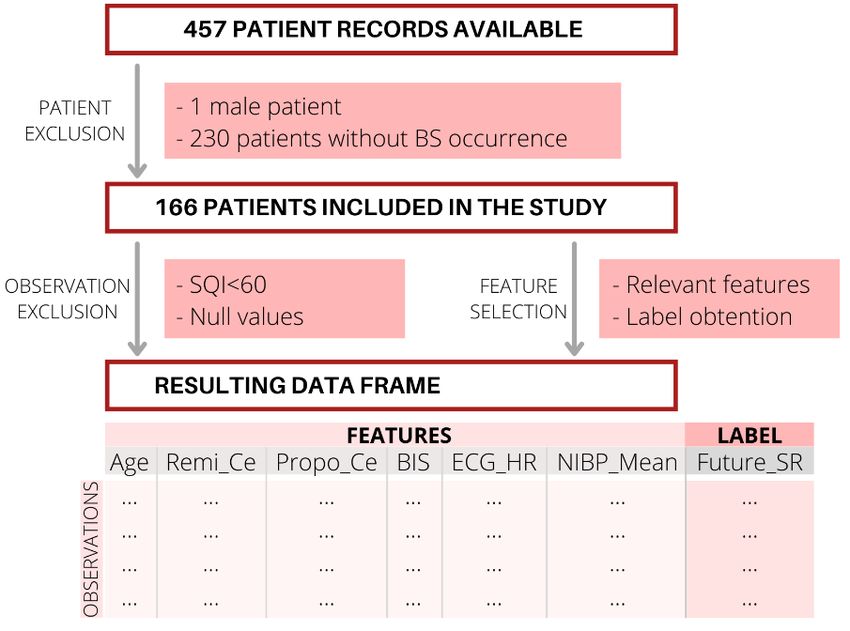
2.4.1. Machine Learning ................................................................................................ 12
 2.4.2. Machine Learning supervised algorithms ............................................................. 13
 2.4.2.1. Support Vector Classifier ............................................................................. 13
 2.4.2.2. K-Nearest Neighbors.................................................................................... 14
 2.4.2.3. Random Forest ............................................................................................ 14
 2.4.2.4. XGBoost....................................................................................................... 14
 2.4.3. Machine Learning models performance evaluation .............................................. 15
 2.4.3.1. Accuracy score ............................................................................................ 15
 2.4.3.2. Confusion matrix .......................................................................................... 15
 2.4.3.3. ROC curve ................................................................................................... 16
 2.5. State of the art ............................................................................................................. 17
 2.5.1. Burst suppression ................................................................................................ 17
 2.5.2. Predictive models................................................................................................. 18
3. Market analysis .................................................................................................................. 19
 3.1. Potential users ............................................................................................................. 19
 3.2. Market evolution........................................................................................................... 19
 3.3. Future market prospectives.......................................................................................... 20
4. Conception engineering .................................................................................................... 21
 4.1. Options description ...................................................................................................... 21
 4.1.1. Programming language ........................................................................................ 21
 4.1.2. Machine Learning Algorithms............................................................................... 22
 4.2. Options selection ......................................................................................................... 22
5. Detailed engineering .......................................................................................................... 24
 5.1. Data acquisition ........................................................................................................... 24
 5.2. Data processing ........................................................................................................... 26
 5.2.1. Data frame construction ....................................................................................... 26
 5.2.1.1. Label obtention ............................................................................................ 27
 5.2.1.2. Signal quality assessment............................................................................ 27
 5.2.1.3. Gender selection .......................................................................................... 27
 5.2.1.4. Feature selection ......................................................................................... 28
 5.2.1.5. Observations selection ................................................................................. 28
 5.2.1.6. Compensation of the proportion of different labels ....................................... 28
 5.2.1.7. Scaling ......................................................................................................... 29
 5.2.1.8. Final overview of the included patients and data.......................................... 29

 ix
5.2.2. Burst suppression incidence assessment ............................................................ 30
 5.3. Outliers analysis........................................................................................................... 30
 5.4. Data split ...................................................................................................................... 31
 5.5. Machine Learning model training and test ................................................................... 32
 5.5.1. Models building .................................................................................................... 32
 5.5.1.1. SVC ............................................................................................................. 32
 5.5.1.2. KNN ............................................................................................................. 32
 5.5.1.3. RF and XGB................................................................................................. 32
 5.5.2. Training, testing and evaluation ........................................................................... 33
 5.6. Model implementation .................................................................................................. 33
 5.7. Python modules ........................................................................................................... 33
6. Results and discussion ..................................................................................................... 34
 6.1. BS occurrence analysis ............................................................................................... 34
 6.2. Outliers analysis........................................................................................................... 34
 6.3. Models validation and selection ................................................................................... 35
 6.4. Feature importance ...................................................................................................... 37
 6.5. Model implementation on patients ............................................................................... 39
 6.6. Implications .................................................................................................................. 41
 6.7. Limitations .................................................................................................................... 41
7. Execution schedule ........................................................................................................... 43
 7.1. Tasks definition ............................................................................................................ 43
 7.2. Timing and phases – GANTT diagram ......................................................................... 44
8. Technical viability – SWOT analysis ................................................................................ 46
9. Economic viability ............................................................................................................. 47
 9.1. Material resources ....................................................................................................... 47
 9.1.1. Hardware requirements........................................................................................ 47
 9.1.2. Software requirements ......................................................................................... 47
 9.2. Human resources......................................................................................................... 47
 9.3. Costs and budget ......................................................................................................... 48
10. Regulatory and legal aspects ....................................................................................... 49
11. Conclusions and future lines ........................................................................................ 50
References ................................................................................................................................. 51
Appendices ................................................................................................................................... I

 x
1. INTRODUCTION

The number of annual surgical procedures performed under general anesthesia in Europe is
estimated at approximately 29 million interventions [1]. In addition, the current aging of the
population due to the increase in life expectancy worldwide, predicts an increase in the number of
surgeries under general anesthesia in the coming decades [2].

The main purpose of general anesthesia is to relieve the sensation of pain during a surgical
procedure; hence, through the administration of anesthetic drugs, a reversible state of
unconsciousness, amnesia, analgesia and akinesia is induced [3]. However, this condition also
involves significant changes in the physiologic balance of the body including cardiovascular,
respiratory, renal, hepatic and endocrine systems, caused by anesthetic drugs [4]. Therefore, it is
of vital importance to perform a complete monitoring of the patient in order to artificially maintain
the optimal physiological conditions during general anesthesia.

One of the effects related to the administration of anesthetic drugs is the phenomenon of EEG burst
suppression (BS), which is mainly caused by a too high dose of drugs [5], and according to some
authors could lead to adverse outcomes [6][7]. These possible unfavorable effects prove the need
of developing predictive models that can allow anesthesiologists to anticipate the phenomenon of
BS, thus reducing the potential risks they may involve.

 1.1. DESCRIPTION OF THE PROJECT

The clinical need of a system that could predict the occurrence of BS to avoid its appearance and
the potential side effects associated was the starting point to develop the present project, which
aims to generate an individualized predictive model capable of continuously indicating the likelihood
of BS occurrence in the following two minutes. This way, during an intervention under general
anesthesia, each second the model will display an index showing the probability of BS two minutes
ahead of time, according to currently monitored physiological signs as well as continuous drug
input.

The project has been carried out with the SPEC-M (Systems Pharmacology Effect Control and
Modeling) research group in the Department of Anesthesiology at Hospital Clínic de Barcelona.
The data used for the study belongs to the SPEC-M group and it has been collected since 2013 in
the operating room number 4 of the CMA Unit of the Hospital Clínic. This operating room carries
out gynecological procedures, and data is assembled from patients undergoing a general
anesthesia surgery.

At present, the database consists of more than 1500 patients, with a large majority of women.
However, in order to further increase its volume of data, at the beginning of this project a two-month
stay was carried out in the aforementioned operating room to continue with the data collection.

 1.2. OBJECTIVES

As already stated, the present study aims to conceive a prediction system for BS during surgeries
undergoing general anesthesia. Hence, the main goal consists on building a model able to predict,

 1
each second during an intervention, the probability of BS occurrence within two minutes. In order
to accomplish this general goal, different tasks and more specific objectives are required, which
are described below.

 - Regarding data acquisition

 → Data acquisition from patients during general anesthesia surgeries

 A short stay in the CMA operating room will be carried out in order to increase the
 amount of available data of the SPEC-M database. Another objective is to get
 familiar with patient management as well as with the meaning of the kind of data
 collected that will be used in the development of the project. The duration of the
 stay allowed to increase the database up to 50 more patients, approximately.

 → Use of the intraoperative Data Acquisition Set

 The mentioned data acquisition implies the use of the intraoperative Data
 Acquisition Set, which allows to collect the monitored physiological parameters in
 real time during procedures under general anesthesia. During the automatic
 collection of data, a manual register of relevant events is performed.

 - Regarding research in Biomedical Engineering field

 → Bibliographic research

 Understand the physiological causes and effects of BS, as well as the current
 studies and knowledge on this topic, including studies on BS prediction.

 In addition, research on the current State of the Art in patient monitoring during
 procedures under general anesthesia will also be carried out.

 → Review and improve current skills on data analysis, statistics and Machine
 Learning (ML) predictive models

 Gather information on the basis of ML models, along with the statistics, data
 analysis and information extraction behind them. This does not only imply
 knowledge acquisition on ML, but also on programming and its use in the present
 study.

 - Regarding data management and the development of a BS predictive model

 → Elaborate a program for data analysis of the current database

 From an already existing database belonging to the SPEC-M group, all the data
 must be analysed as a means to determine which parameters must be taken into
 account for BS prediction.

 2
Moreover, data must be processed in order to be properly prepared for further
 analysis, implying a checking of the available data as well as to perform en errors
 detection.

 → Elaborate a program for BS prediction

 Develop different ML models so as to find the most accurate one, understanding
 as such the one that has a better performance.

 Finally, this model must be applied to different patients with the aim of assessing
 which would be its functioning and behavior if tested in real patients.

 1.3. METHODOLOGY AND OUTLINE

The duration of the present study is five months, from September 2021 to January 2022. This time
period includes the execution of the entire project, from the development of the first general idea of
the project, the exhaustive research on the topic and the two-month stay at the operating room for
data acquisition, through the execution of the program for BS prediction with its validation, and
ending with the drafting of the final project report.

Once the need for a BS prediction system was known, the present study was structured and
different tasks were detailed in order to accomplish the previously mentioned objectives. These
tasks were grouped and structured in six stages, shown in Figure 1 and described below.

 Figure 1. Methogology flowchart

First of all, the study started with the two-month stay at the CMA operating room for data acquisition.
During this first stage, an initial bibliographical research was done, not only into anesthesia and
BS, but also in ML basics and algorithms and a market analysis. This review has provided some
basic knowledge on the current status on the subject, essential before continuing with the study.

Secondly, the processing of the existing database was performed by developing a Python script
using the Spyder environment for programming. This program has been designed so it can collect
all the data from the database and select relevant parameters and information and structure them
in a suitable way for further usages, while eliminating unrelated data.

Next, another Python script was elaborated in order to build a BS predictive model. This program
allows to develop different ML models, so an exhaustive comparation and analysis has been done
with the aim of selecting the model presenting a better performance and accuracy. The chosen
model has been later tested on a large number of patients as to simulate its behavior when applied
in real-time.

Finally, the obtained results have been evaluated and discussed, and the final report of the study
has been carefully written and detailed.

 3
1.4. SCOPE AND SPAN

According to the previously mentioned objectives, and the tasks detailed in the previous section,
the present study will include an extensive research on the State of the Art of studies regarding BS
prediction on patients undergoing general anesthesia. If any, the current BS predictive models will
be evaluated in order to know their usage conditions, characteristics and limitations.

After the market analysis, the study will contain different project management methods as to ensure
the maximum efficiency and optimal conditions during the execution of the entire project.
Concretely, an execution schedule will allow to define the different tasks to be carried out,
specifying the time required for each of them and the order in which they must be performed, as
well as their cost. Moreover, a GANTT diagram will be built in order to display the temporary
planning of the project in a visual way, showing the different activities to be performed,
simultaneously or not, throughout the project, along with the optimal deadlines for each task.

Once the background research is done and the current status on the topic is analyzed, the tasks
involving the final goal of this project will be able to start. This crucial part of the project will include
both the data processing and the building of several ML models for BS prediction, together with
full-scale evaluation of each of the obtained models, allowing to make an evidence-based selection
of the most favorable one. To end with, the resulting BS predictive model will be tested and
valideted with an extense amount of patients, and the development and operation of the project
itself will be evaluated. This last assessment will enable to compare the resources and deadlines
initially established with those finally used; thus, it will allow to estimate the success of the project
and whether it has been carried out in accordance with the expected.

 1.5. LIMITATIONS

Regarding the limitations of the project, it should be noted that since the data collection has been
done in the gynecology operating room of the Hospital Clínic of Barcelona, the vast majority of
patients in the database are women and, also in a high proportion, of white people. Hence, the final
results, although representing well the population in our environment, will not be representative for
all global population nor extrapolable to any person, since no masculine patients are taken into
consideration, and other ethnic groups are likely to be underrepresented in the used data.
Nonetheless, since gender and ethnic group do not greatly affect brain function, data can be
considered to accurately represent general patients behavior and results could be cautiously
applied both to male patients and patients of different ethnicities.

In addition, given that the project is carried out in the framework of a Final Degree project, the final
testing and validation of the obtained predictive model will not be carried out in a real-life surgery
in an operating room with a physical patient, but will be implemented on a computer using patients
from the current database. Nevertheless, the obtained result can be compared to what would be
expected in a real-life application, so the validation can be considered reliable and meaningful.

Moreover, since all the data for the model developement is obtained from propofol-remifentanil
induced general anesthesia surgeries, the obtained predictive model will only be useful for BS
prediction during anesthesia of the same type.
 4
2. BACKGROUND

 2.1. GENERAL ANESTHESIA

General anesthesia is a drug-induced, reversible condition which involves certain behavioral and
physiological characteristics, such as hypnosis, analgesia, amnesia and akinesia. These effects,
resulting from the administration of anesthetic drugs, entail severe side effects such as
cardiovascular inestability, respiratory depression, and an altered function of the thermoregulatory
systems. Consequently, anesthesiologists must adopt measures in order to maintain the
physiological conditions inside the normality range and homeostatic equilibrium [3][8].

In addition to the mentioned effects, general anesthesia also produces alterations on the EEG
patterns, the most common of which is a gradual increase of low-frequency and high-amplitude
activity as the level of general anesthesia intensifies. Due to the similarity of the EEG patterns
under general anesthesia and the known ones from a sleep or coma state (Figure 2), general
anesthesia is often considered a drug-induced reversible coma [9].

 Figure 2. Electroencephalographic (EEG) Patterns during the Awake State, General Anesthesia, and Sleep [3]

The following sections will provide a brief review on the different effects desired to reach with
anesthesia, along with a concise description of the drugs used to achieve these effects.
 2.1.1. TARGET EFFECTS OF GENERAL ANESTHESIA

During a surgical procedure, anesthesiologists play a key role on protecting the patient from the
aggressiveness of the procedure itself. In order to achieve the aforementioned reversible drug-
induced coma state, different pharmacological effects must be combined.

 5
2.1.1.1. HYPNOSIS

Hypnosis or unconsciousness is described as a drug-induce impairment of perceptive awareness,
which involves the loss of cognitive functions required for responding to verbal, tactile or painful
stimulation, comprising attention, perception and even spoken commands [10]. Hence, in clinical
situations, hypnosis is assumed when patients fail to respond verbal stimuli or mild shaking [11].

Induction of hypnosis leads the patient to disregarding the external, generating a well-being and
deep relaxation feeling followed by eyelid heaviness and regular breathing. Clinically, hypnosis
state involves a reduction of respiratory rate and can be examinated by checking eyelid flickering,
loose of muscular activity and relieve of facial tension, which usually causes dropping of the jaw
and a slight opening of the mouth, sometimes including a deep yawning reflex [12].

Among the drugs able to produce hypnosis, GABA A receptor agonists, such as propofol, can be
highlighted because its use is pretty much present in 90% of anesthesia induction. The hypnotic
state can be monitored and analysed through EEG and EEG derived parameters [13][14], and it is
crucial to continuously evaluate its depth in order to avoid an excessive or insufficient effect.

 2.1.1.2. ANALGESIA

Analgesia is known as the absence or modulation of pain perception when recieving a noxious
stimuli. This state is an essential effect to target due to the intensity of painful stimuli during a
surgical intervention, which otherwise would be unbearable.

This analgesic effect is achieved by blocking the pathways responsible of transmitting the noxious
stimuli recieved by the nociceptive receptors to the cortex [15]. A way of blocking this pathway is
by the use of opioids such as remifentanil. Analgesia induces collateral effects such as respiratory
depression and sometimes muscle rigidity; thus, it is essential to monitor this state [16]. Although
it can not be directly measured, it is possible to indirectly evaluate it by monitoring hemodynamic
and EEG changes.

 2.1.1.3. AMNESIA

Amnesia is defined as a profund loss of memory and impossibility to retain information, which can
be induced during surgery in order to improve the stress suffered by the patient in a surgical
procedure situation [17]. Each anesthetic produces amnesia by affecting on distinct pathways and
at different doses [18], but given the fact that patients who are truly unconscious are also on
amnesia, this effect is maintained by ensuring unconsciousness [9].

 2.1.1.4. AKINESIA

Akinesia or immobility is the loss of movement capacity, which is induced during the procedure to
facilitate the surgeon’s job, resulting in an improved exposure and precision [9], and also allowing
the endothracheal intubation during the induction and maintenance of the anesthetic state [19].
This absence of movement is usually achieved by the administration of the so-called
neuromuscular blocking agents, being the most commonly used succinylcholine and rocuronium.

 6
There are different types of neuromuscular blocking agents, each with its own target and
mechanism of action [20].

Immobility can be monitored through an electromyography (EMG), measuring the electrical activity
of a specific nerve. Moreover, mechanomyography (MMG) and acceleromyography (AMG) can
also be useful by measuring muscles actual movement.

 2.1.2. ANESTHESIC DRUGS

The amount of agents cabaple of achieving the priorly described effects is large. Nevertheless,
these drugs must be carefully selected and combined so they produce the most benefitial effect
[16]; thus, it is of high clinical interest to find synergistic interactions between agents, since these
would enable the use of smaller doses of each drug, consequently reducing potential side effects
[20]. Depending on the effect they produce, anesthesics can be classified as shown in Table 1,
where some of the most common agents can be observed.
Table 1. Common intravenous anesthetics classified according their effect [21]

 Hypnotics Opioids Muscle relaxants
 Propofol Fentanyl Cisatracurium
 Thiopental Sufentanil Vecuronium
 Etomidate Remifentanil Pancuronium
 Ketamine Morphine Rocuronium
 Succinylcholine

Anesthetics can be classified according to its administration pathway; hence, they can be either
inhalational or intravenous. The so-called total intravenous anesthesia (TIVA) refers to the
exclusive use of the intravenous route for anesthetic administration.

Both techiniques are widely used and many indicators must be taken into account when selecting
the most appropriate administration type for each patient and procedure. However, one factor to
consider is that TIVA may present some advantages over inhalational anesthetics in terms of
inflammatory and immunomodulatory effects, as well as better outcome and recovery [22][23][24].

Although intravenous drugs can be administered manually, target controlled infusion systems (TCI)
are often used [25]. These use pharmacokinetic and pharmacodynamic models in order to compute
the amount of anesthetic to deliver over time; this way, the desired level of anesthetic effect can be
rapidly changed if required [26]. Compared to manual drug administration, TCI allows a more
accurate control of the desired pharmacodynamic effect, along with shorter recovery time [27].

In the operation room from the CMA in Hospital Clínic, a TCI-TIVA induced anesthesia based on a
synergic combination of propofol, remifentanil and rocuronium, when needed, is used for those
surgeries requiring general anesthesia in order to achieve all the aforementioned effects. This
combination of agents is known to produce a synergic effect, thus positively complementing each
other in pharmacodynamic terms and even enabling a reduction of the required dosage for both
drugs [20]. Due to their usage in the CMA in Hospital Clínic, these anesthesics are reviewed in the
following sections.

 7
2.1.2.1. PROPOFOL

Propofol is an intravenous agent which quickly produces an hypnotic effect, due to its lipophilic
nature that allows it to rapidly cross the blood-brain barrier and reach the CNS. Hence, induction
of hypnosis is fast, and its effect can be maintained either by continuous infusion or intermittent
injection. Furthermore, propofol produces more immobility and is associated with rapid recovery
and a low incidence of nausea and vomiting after the anesthesia.

However, in some cases it can produce pain or a stinging feeling during injection, and it produces
a drop in blood pressure as well as a reduction in heart rate. However, these last consequences
can be monitored and controlled by keeping a continuous infusion at low doses [28][29].

In order to achieve the whole anesthetic state, according to the abovementioned effects, it is usually
used alongwith opioids, which provide analgesia.

 2.1.2.2. REMIFENTANIL

Remifentanil is a fast opioid analgesic agent which, due to its rapid mechanism of action, is suitable
for TIVA, in which effective agents are required [30]. It is associated with deeper analgesia and
anesthesia, resulting in fewer responses to noxious stimuli and with a fast recovery time, among
others [31].

Nonetheless, remifentanil causes respiratory depression as well as bradichardia and hypotension.
These effects, though, can be controlled by controlling ventilation, which is already required in
general anesthesia, and by keeping administration by infusion [32].

 2.1.2.3. ROCURONIUM

Rocuronium is a non-depolarizing neuromuscular blocker used to achieve immobility and muscle
relaxation during surgery. Despite its longer duration of action compared to other agents, its main
advantage is its rapid effect and reversibility [33].

In procedures under propofol-remifentanil anesthesia, tracheal intubation without using muscular
relaxant agents could cause hypotension and bradycardia; hence, the use of muscular blockers
such as rocuronium remarkably reduce these effects [34].

Regarding its use in the CMA in Hospital Clínic, rocuronium is only used before tracheal intubation,
while during laryngeal mask airway introduction it is not required due to its low complication
incidence [35].

 2.2. ANESTHESIA MONITORING

As stated previously, autonomous homeostatic control is lost under general anesthesia, so the
administration of the correct anesthetics in the precise dose are fundamental for homeostatic
equilibrium maintainance. Hence, monitoring of both for vital constants and drug doses is crucial to
maintain the patient in the physiological normality range as well as to provide an individualized
anesthetic management.

 8
The following sections will be focused on briefly describing the different monitoring systems used
in the CMA in Hospital Clínic during a surgical procedure under general anesthesia, classified as
basic and advanced monitoring systems.

 2.2.1. BASIC MONITORING SYSTEMS

 2.2.1.1. ELECTROCARDIOGRAM

An electrocardiogram (ECG) measures the electrical activity of the heart through different
electrodes placed on the skin of the patient. It provides direct and derived information on different
parameters, such as heart rate, heart rythm and ST signals, among others.

Variations on these parameters can be due to changes on the homeostatic equilibrium, as well as
on the hypnotic and analgesic effect, highlighting the need to monitor cardiac activity [36].

 2.2.1.2. ARTERIAL BLOOD PRESSURE

Arterial blood pressure (BP) is also used for monitoring the cardiovascular function, as it
continuously measures the blood flow pressure exerted on the arterial walls. It can either be
measured in an invasive way by using intra arterial catheters, or non invasively by using cuffs [37].

As well as ECG, out-of-range values of BP might produce important physiological changes as well
as effect on the overall anesthetic effect.

 2.2.1.3. PULSE OXIMETRY

Pulse oximetry is a noninvasive technique for oxygenation monitoring. It quantifies oxygen blood
saturation through a sensor usually placed on the index fingertip of the patient, by applying
spectrophotometric methods able to measure hemoglobin levels and pulse rate, among others [38].

 2.2.1.4. CAPNOGRAPHY

Capnography consists on monitoring the ventilatory function of the patient by measuring the
concentration or partial pressure of CO2 in respiratory gases. During anesthesia, capnography is
used to ensure proper CO2 elimination from the lungs, along with correct ventilation and pulmonary
perfusion [39].

 2.2.2. ADVANCED MONITORING SYSTEMS

 2.2.2.1. ELECTROENCEPHALOGRAM

Electroencephalogram (EEG) is one of the main monitoring systems and plays a key role on
anesthesia monitoring. It measures the electrical activity of the cortical area of the brain through
several electrodes placed on the forehead of the patient; thus, it is a powerful continuous indicator
of the anesthetic effect produced by the administered drugs, since these cause changes in the EEG
waves.

 9
Under general anesthesia, each EEG waveform
 are related with different anesthetic states, as
 described in Figure 3. As can be observed, as a
 general rule, anesthesia is responsible of a
 gradual reduction on frequency along with an
 increase of high amplitude waves as the level of
 unconsciousness deepens [3].

 As could be observed in Figure 3, at stages of
 deep anesthesia, a phenomenon called “burst
 suppression” can occur, which involves an
 alternating pattern of bursts (high frequency and
 high amplitude waves) and periods of isoelectric
 EEG with absence of electric activity [40]. This
 pattern, except in cases of brain ischaemia or
 other factors, is an indicator of a too deep
 anesthesia; thus, ideally it should be avoided.

 Given the complicated interpretation of raw EEG
Figure 3. Raw electroencephalogram waveforms of waveforms in the time domain, data extraction
propofol-induced anesthesia [41] from these signals is challenging. Therefore,
using the principles of the Fast Fourier Transform (FFT), a frequency decomposition of the signals
can be performed, obtaining a plot with the different frequencies on the x-axis and their power on
the y-axis [41].

This enables to classify different waveforms according to their characteristic frequencies and, thus,
identify anesthetic stages (Table 2).

Table 2. Spectral frequency bands derived from EEG and their clinical meaning [41][42]
 Waveform Frequency range (Hz) Clinical interpretation
 Beta (β) 13 – 25 Wide awake, consciouss
 Alpha (α) 9 – 12 Awake, relaxed, consciouss
 Theta (θ) 5–8 Light sleep, relaxed
 Delta (δ) 1–4 Deep sleep

Hence, EEG monitoring provides information on which waveform is predominant over time;
therefore, it is a powerful indicator of the anesthetic state of the patient.

 2.2.2.2. BISPECTRAL INDEX (BIS)

As previously stated, raw EEG signals are difficult to evaluate, requiring high expertise from the
anesthesiologist. To facilitate this analysis, advanced signal processing algorithms have been
developed in order to extract parameters that could be easily evaluated. A popular EEG derived
parameter is the well-known Bispectral Index (BIS), which uses a confidential algorithm able to
measure the pharmacodynamic anesthetic effect on the CNS by displaying a single index value
ranged from 0 to 100, corresponding values to “no brain activity” and “fully awake”, respectively. In

 10
propofol induced aesthesia, in order to maintain an optimal hypnosis effect, BIS values should
range from 40 to 60 [43].

This value is obtained from four electrodes placed on the forehead of the patient and, besides the
BIS index, BIS monitor also provide a predicted trend graph of the BIS values over time, the raw
EEG signals in real-time, EMG activity, and different signal quality indicators, such as SQI, which
the highest its value, the more reliable the BIS index [44].

Despite the powerful information provided by the BIS index, it is important to highlight the need to
monitor all the previously mentioned parameters, since the overall anesthetic state can not only be
monitored through EEG. Hence, hemodynamic variables and autonomic and somatic responses,
among others, must also be considered before defining the effect of anesthesia on the patient.

 2.3. BURST SUPPRESSION

As already stated, an often observed EEG pattern phenomenon is the so-called “burst suppression”
(BS), which comprises high-voltage activity (bursts) and isoelectrical EEG (suppression of activity).

Outside from anesthesia, this pattern can be found in patients suffering from brain pathologies,
such as coma, severe brain trauma, epilepsia, stroke, Ohtahara syndrome and hypothermia. As
previously mentioned, it can be a consequence of a deep anesthetic effect. In fact, the absence of
BS during sleep is a differential feature between sleep and general anesthesia [5]. Besides too
intense anesthetic effect, known risk factors for BS include older age and previous comorbidities,
such as COPD [45].

Although it can even be considered desirable in some specific conditions, such as for patients
treated for severe seizures, when referring to surgeries under general anesthesia with too intense
anesthetic effects BS has been associated to adverse outcomes [5][46].

According to different studies, it is believed that sustained states of BS during anesthesia might
harm the brain, and it can also be related to postoperative delirium or even cognitive deficits
[47][48]. However, other studies have found that EEG-guided anesthesia resulted in a decrease of
BS time during surgery, but the incidence of postoperative delirium was not reduced [49]. Moreover,
despite BS was associated with high anesthetic doses and comorbidities, it has been seen that
EEG suppression can be a predictor of postoperative mortality only when accompanied with low
mean arterial pressure [45].

Regardless of the controversy, it can be assumed that BS can be related to adverse outcomes,
specially when combined with other factors, and that it does not have benefitial effects when
referring to surgeries under general anesthesia. Hence, a predictive model for BS would be a
powerful technique as to avoid EEG suppression patterns.

 2.4. PREDICTIVE MODELS

Nowadays, technology and data processing systems have revolutionized the operating way in all
fields, even making possible what seemed impossible. Regarding the medical field, these
improvements are the result of combining medicine with computer sciences and engineering.

 11
Diagnosis and health status forecasts of patients, alongwith monitoring and classification of
biomedical signals are essential tasks of medical care with a common main goal: predicting the
medical contitions of the patient in order to anticipate and avoid possible adverse outcomes. Hence,
predictive models have been developed as to properly reproduce the patient’s condition with the
aim to make predictions [50].

Predictive models use known data, statitics and mathematical algorithms to predict outcomes. In
general, this predictive models are known as Artificial Intelligence (AI), which can be defined as a
field concering all computational techniques aiming to mimic and reproduce human intelligence for
predicting results [51]. This offers a great number of benefits compared to human-performed
predictions, such as flexibility and adaptability, followed by a more accurate pattern recognition
through large amounts of data and variables. All these advantages are also accompanied with a
fast computing capability, way faster than humans [52]. Inside AI, different disciplines can be
distinguished. Among these, Machine Learning (ML) is considered to be an major subfield and it is
widely used for predictive models in healthcare.

 2.4.1. MACHINE LEARNING

By definition, ML refers to “computational methods for improving performance by mechanizing the
acquisition of knowledge from experience”; hence ML models use already collected data in order
to develop algorithms able to predict an outcome when new unobserved data is introduced [51].
When developing a ML model, the data used for the development of the algorithm is known as
Train data, since it is used for training the model so it is later able to predict results. In order to test
obtained models, a set of data known as Test data is used to test the performance and accuracy
of the developed model. ML models can be classified in four large categories, which are supervised,
unsupervised, semisupervised and reinforcement learning.

The main distinction between supervised and unsupervised learning models is the use of labeled
training data. While supervised algorithms use data in which there is prior knowledge on the final
output values that should be obtained, unsupervised models use not labeled data. A combination
of these two types results in semisupervised algorithms. As for reinforcement learning models, they
are based on algorithms which use a punishment-reward approach for making predictions on a
dynamic environment [51].

Depending on the available data and on the expected performance and application of the desired
model, one class or other will be used, or even a combination of them. Once the type of learning is
known, however, there is a wide range of algorithms avaiable for each class, and the challenge
relies on selecting the most optimal one. Since there is no rule on which algorithm to choose
depending on each situation, many of them must be tried and compared in order to pick the best
performing one.

Given the fact that the present study aims to build a BS predictive model, and basing the decision
on the structure of the collected and available data, four different models have been developed
using supervised learning. Hence, only the algorithms supporting these models will be described.

 12
2.4.2. MACHINE LEARNING SUPERVISED ALGORITHMS

As mentioned, there is no way to know which algorithm will have a better performance prior to
testing them. For this reason, several models must be built in order to compare their results and
select the one with higher accuracy. In the present study, four different supervised learning
algorithms have been chosen under the recommendations from the supervisors, which will be
described below.

 2.4.2.1. SUPPORT VECTOR CLASSIFIER

Support Vector Classifiers (SVC) are a class of Support Vector Machines (SVM), which are
supervised ML approaches which analyse datasets in order to predict outcomes. Usually, this
model is used for binary classification and prediction; thus, a SVC is able to classify data in two
different outputs by examinating an input dataset. However, as seen in Figure 4, SVM can also
classify data into multiple classes [51].

In order to understand the principle behind SVC algorithm, a large dataset with many different
inputs and each input belonging to one of two classes must be assumed. With this dataset, the
SVC model would develop an algorithm able to represent each of these inputs as a point in a space
in which data for both classes would be divided by a gap. This way, by mapping new data into this
space, the model is able to predict the class of this input according to the position of new data with
respect to the gap. The space in which data is mapped will be N-dimensional, N being the number
of features inside the input data [53]. The output of the model can either be the predicted class in
which the input belongs to, or the probability for the data to belong to the different classes.

For now, the classification method
described works by drawing a line
between classes for a 2-
dimensional space, a plane when
referring to 3-dimensional spaces,
or a hyperplane for higher
dimensionalities; these are known
as linear classifications. However,
SVC models include a parameter
known as kernel, which allows to
modify the so-called linear
classification in order to obtain a
decision boundary with different
shapes. Four types of kernels along
with their classification behavior Figure 4. Decision boundaries approaches of different types of kernels
can be observed in Figure 4. for SVC models [54]

 13
You can also read