Macquarie Australia Conference 2022 - Transurban
←
→
Page content transcription
If your browser does not render page correctly, please read the page content below
Macquarie Australia Conference 2022

Disclaimer and basis of preparation

This publication is prepared by the Transurban Group comprising Transurban Holdings Limited (ACN 098 143 429), Transurban Holding Trust (ARSN 098 807 419) and Transurban International Limited (ACN 121 746 825). The responsible
entity of Transurban Holding Trust is Transurban Infrastructure Management Limited (ACN 098 147 678) (AFSL 246 585).

To the maximum extent permitted by law, none of the Transurban Group, its officers, employees or agents or any other person: (1) accept any liability for any loss arising from or in connection with this publication or the information in it,
including, without limitation, any liability arising from fault or negligence; (2) make any representation or warranty regarding, and take no responsibility for, any part of this publication or the information in it; and (3) make any
representation or warranty, express or implied, as to the currency, accuracy, reliability, or completeness of the information in this publication.

The information in this publication does not take into account individual investment and financial circumstances and is not intended in any way to influence a person dealing with a financial product, nor provide financial advice. It does not
constitute an offer to subscribe for securities in the Transurban Group. Any person intending to deal in Transurban Group securities is recommended to obtain professional advice.

This publication contains certain forward-looking statements. The words “continue”, “expect”, “forecast”, “potential”, “estimated”, “projected”, “likely”, “anticipate” and other similar expressions are intended to identify forward-looking
statements. Indications of, and guidance on, future earnings, financial position, distributions, capex requirements and performance are also forward-looking statements as are statements regarding internal management estimates and
assessments of traffic expectations and market outlook. Such forward-looking statements are not guarantees of future performance and involve known and unknown risks, uncertainties and other factors, many of which are beyond the
control of Transurban, its officers, employees, agents and advisors, that may cause actual results to differ materially from those expressed or implied in such statements. There can be no assurance that actual outcomes will not differ
materially from these statements. There are usually differences between forecast and actual results because events and actual circumstances frequently do not occur as forecast and their differences may be material.

Investors should not place undue reliance on forward-looking statements, particularly in light of the current economic climate and the uncertainty and disruption caused by the COVID-19 pandemic. None of the Transurban Group, its
officers, employees or agents or any other person: (1) gives any representation, warranty or assurance that the occurrence of the events expressed or implied in any forward-looking statement will occur; and (2) have any responsibility to
update or revise any forward-looking statement to reflect any change in the Transurban Group’s financial condition, status or affairs or any change in the events, conditions or circumstances on which a statement is based, except as
required by Australian law.

UNITED STATES OF AMERICA
These materials do not constitute an offer of securities for sale in the United States of America. Securities may not be offered or sold in the United States unless registered under the U.S. Securities Act of 1933, as amended (the “U.S
Securities Act”), or offered and sold in a transaction exempt from, or not subject to, the registration requirements of the U.S. Securities Act.
© Copyright Transurban Limited (ACN 098 143 410). All rights reserved. No part of this publication may be reproduced, stored in a retrieval system, or transmitted in any form or by any means electronic, mechanical, photocopying,
recording or otherwise, without the written permission of the Transurban Group.

BASIS OF PREPARATION
This document includes the presentation of results on a statutory as well as non-statutory basis. The non-statutory basis includes Proportional Results and Free Cash. Numbers in this presentation are prepared on a proportional basis
unless specifically referred to as statutory or total. All financial results are presented in AUD unless otherwise stated. Data used for calculating percentage movements has been based on whole actual numbers. Percentage changes are
based on prior comparative period unless otherwise stated. Financial years are designated by FY and half years are designated by HY with all other references to calendar years. Refer to the Glossary for an explanation of terms used
throughout the presentation.
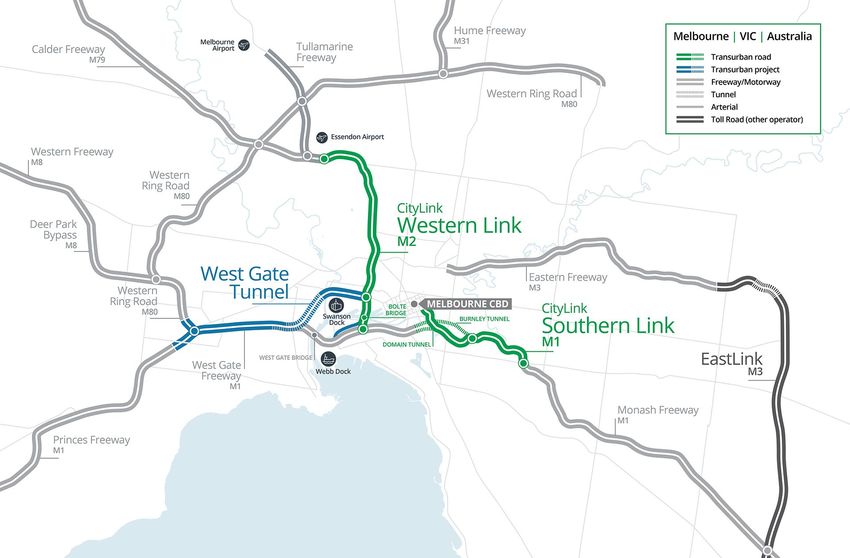
West Gate Tunnel Project
  Transformational project enhancing transport
  outcomes for Victoria
  •    Vital alternative to the West Gate Bridge, which carries over 200,000 vehicles
       per day and regularly experiences congestion
  •    WGTP will deliver around 70km of new traffic lanes, create more than
       6,000 construction jobs and is expected to generate around $11 billion
       in economic benefits for the State of Victoria1
  •    Connection to CityLink will create an integrated network enabling safer,
       faster and more efficient trips for customers
  •    Value sources include CityLink and WGTP tolling mechanisms and CityLink
       concession extension

                                                                                           WGTP progress update
                    Up to                                                More              •   First Tunnel Boring Machine (TBM) has excavated around 550 metres of
                    20 mins                                              than 14km             the outbound tunnel. Second TBM commenced tunnelling and excavated
                                                                                               around 150 metres of the inbound tunnel
         in travel time savings per trip                       of new and upgraded
         expected for customers using                          walking and cycling paths   •   More than 70% of widening works on West Gate Freeway now complete
         the West Gate Tunnel3
                                                                                           •   More than 600 metres of the new elevated roadway above Footscray Road
                                                                                               has been built

1. Victoria State Government—Western Distributor Business Case (2015).
2. Victorian government West Gate Tunnel Project website.
WGTP - improving freight outcomes

With freight demands expected to increase significantly over time, Transurban roads, including the West Gate Tunnel, will play a key
role in how freight travels in the future

     Long-term freight growth supported by West Gate Tunnel
     Project
     •   The West Gate Tunnel Project (set to open in 2025) is specifically designed to
         move heavy vehicle traffic away from local roads and support more efficient
         travel for all road users
         -   direct freeway connection into the Port of Melbourne, allowing trucks to
             bypass up to 17 sets of traffic lights and representing significant time
             savings for logistics operators
         -   new tunnel expected to shift more than 9,000 trucks per day off local
             roads in Melbourne’s inner west – improving amenity for local residents
         -   increases road freight efficiency and optionality through the
             strengthening of bridges and addition of extra lanes on the West Gate
             Freeway, enabling use of High Productivity Freight Vehicles

1.
Freight pivotal to Australian economy

                    4 billion                                                     163                    8.6% of                               3.2%
                    tonnes                                                      tonnes                     GDP                                growth

       of goods carried across                                  average freight volume        contributed by the freight             in road freight movement
         Australia each year                                   carried for every person in       and logistics sector                 across Australia in 2021
                                                                  Australia each year

  Criticality of road freight highlighted by COVID                                           Large vehicle traffic up 7.5% versus pre-pandemic levels1
  •    Resilience of large vehicle traffic across Transurban’s assets                        400
       demonstrated the vital role which freight plays in keeping the Australian             375
       economy moving
                                                                                             350
  •    Further underlined by strong growth in Australian road freight in 2021,               325
       which outpaced other modes of transport including rail, costal shipping
                                                                                             300
       and air freight
                                                                                             275
  •    Strong growth forecast to continue with total freight expected to grow 35             250
       per cent from 2018 to 2040, and urban freight to grow 60 per cent from                   Mar-19    Sep-19   Mar-20   Sep-20       Mar-21    Sep-21   Mar-22
       2020 to 2040, in line with Australia’s population growth projections
1. Quarterly trips/transactions (in thousands) on Transurban roads (Jun 2020-Mar 2022).
Insights hub
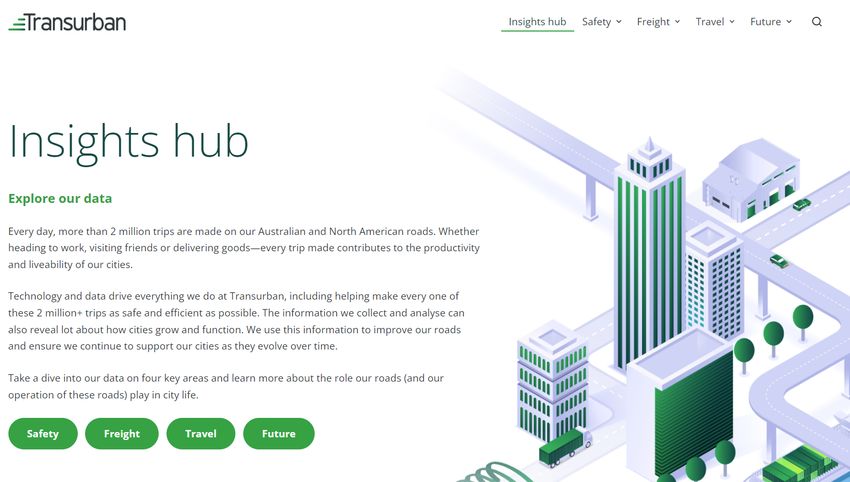
Group strategy

        By understanding what matters
        to our stakeholders, we create
        road transport solutions that
        make us a partner of choice
Transurban investment proposition

 Leading global toll        21 assets located in        Weighted average              Seven projects                Long-term
  road developer             five markets with          concession life of              currently in            relationships with
   and operator              quality structural            ~30 years                   development                governments
                               growth drivers                                           or delivery                and strategic
                                                                                                                     partners

 Over 15 major projects     Assets in locations with   Averaging more than 27      Near-term opportunity          Focus on listening,
delivered in four markets   exposure to favourable     years in concession life      pipeline weighted           understanding and
 in the last two decades.      long-term trends          over the last decade      towards enhancement            creating innovative
Currently operating more     including population      through investments in     opportunities across core   transport solutions based
  than 330 kilometres of            growth                 new assets and            markets of North            on what matters to
    road infrastructure                                    enhancements             America, Sydney and              stakeholders
                                                                                          Brisbane

           Balancing growth in distributions over time and investment in new opportunities to increase long-term value
Supporting distribution growth

 Continued                    Balance sheet capacity          Inflation benefit           Delivering
 momentum in                  internally to fund              with near-term              distribution
 traffic growth               existing near-term              interest rate               growth
 expected                     growth opportunities            protection                  Long-term distribution
 Anticipate near and long-    Active balance sheet            Debt hedging profile and    growth expected to be
 term traffic growth with     management reduces the need     inflation-linked toll       supported by inflation-
 ongoing economic recovery    for external funding with the   escalations provide         linked toll escalations,
 following COVID-19 and new   near-term pipeline weighted     protection in a near-term   anticipated traffic growth
 asset capacity since 2019    towards well-progressed         rising interest rate        and balance sheet capacity
                              greenfield projects and         environment                 to pursue growth
                              enhancement opportunities                                   opportunities
Supporting distribution growth
Long-term distribution growth expected to be supported by traffic growth, inflation-linked toll escalations and balance sheet capacity

     Traffic growth expected to drive long-term distributions                                                                 Near-term protection from hedging and inflation-linked tolls1
          2,000                                                                          400        Growth in asset base      150
                                                                                                    over time to support      120                                   The benefit of a 1% increase               Latest CPI data is higher than CPI
          1,500                                                                          300         traffic volumes and                                            in CPI is likely to be greater              used in sensitivity analysis chart
                                                                                                                                  90
                                                                                                             distributions                                          than the cost impact of 1%
                                                                                                                                  60                                higher interest rates, in the
          1,000                                                                          200
     $M

                                                                                               km
                                                                                                                                                                    near term

                                                                                                                             $M
                                                                                                                                  30
           500                                                                           100                                        0
                                                                                                                                  Illustrative CPI revenue impact FY22-FY25 – price escalation at annualised June 2021 quarter CPI + 1%
             -                                                                           -                                        on FY21 revenue
                   FY12      FY14     FY16     FY18   FY20   FY22     FY24        FY26                                            Illustrative interest rate impact FY22-FY25 - near term debt maturities refinanced at interest rate of 5% (1%
                          Gross distributions ($M)           Total asset length                                                   above Transurban's current average cost of debt)

     Capacity available to internally fund new assets ($B)                                                                    Illustrative margin impacts 1H22                                                                      73.0% - 74.0%

                                                                                                                                       67.5%                                  65.9%
                 3.4
                                                               Corporate liquidity2
                                       ~4.5 - 5                Expected Capital Releases (FY22-25)
                                                               Anticipated capex pipeline (FY22-26)                                 1H22 Group           Accounting        1H22 Group         New assets and       COVID traffic      1H22 Group
                 2.3                                                                                                               EBITDA margin4       adjustments       EBITDA margin        divestments           impacts         EBITDA margin
                                                                                                                                                                                                                                      (pro-forma)
                                                                                                                                  1H22 EBITDA margin would have been around
       Balance sheet capacity available internally to                                                                              73-74% had traffic volumes been in line with
       fund current pipeline in the near term3                                                                                                  pre-COVID levels

1.   Refer to slide 19 footnotes 4 and 5 for further details.
2.   As at 31 December 2021 net of 1H22 distribution payment.
3.   Potential to use a portion of the additional Capital Releases, resulting from the increased stake in WestConnex, to minimise dilution in Free Cash per security.
4.   Excluding accounting adjustments including reclassification of SaaS expenditure and non-cash impacts on maintenance models. Refer to 1H22 Results dated 17 February 2022 for further information.
Weekly traffic data1
Sydney weekly traffic vs 2019 (%) Melbourne weekly traffic vs 2019 (%)
Week commencing Week commencing
3-Jan 17-Jan 31-Jan 14-Feb 28-Feb 14-Mar 28-Mar 11-Apr 3-Jan 17-Jan 31-Jan 14-Feb 28-Feb 14-Mar 28-Mar 11-Apr
50% 10%
40% 0%
30%
-10%
20%
-20%
10%
0% -30%
-10% -40%
Weather Labour
-20%
impacts Easter2 Day Easter2
Brisbane weekly traffic vs 2019 (%) North America weekly traffic vs 2019 (%)
Week commencing Week commencing
3-Jan 17-Jan 31-Jan 14-Feb 28-Feb 14-Mar 28-Mar 11-Apr 3-Jan 17-Jan 31-Jan 14-Feb 28-Feb 14-Mar 28-Mar 11-Apr
40%
0%
30%
20% -10%
10% -20%
0% -30%
-10%
-40%
-20%
-30% -50%
Weather Weather President’s
impacts3 Easter2 impacts Day
1. Traffic charts updated to Sunday 24 April 2022 based on unaudited internal Transurban road data.
2. Comparison week in 2019 on a common day basis contained the ANZAC Day public holiday. In 2022, Easter Sunday fell on 17 April. Easter Sunday in 2019 fell on 21 April.
3. ADT figures for Queensland assets not available for the period between 08:00 on 2 March to 23:59 on 6 March. Tolling was suspended during this time due to extreme rainfall events.Traffic insights
Continued preference for private transport over public transport for Private road transport usage has recovered closer to pre-pandemic
daily use level compared to public transport modes1
• Latest NSW public transport data1 shows public transport volumes down Change in NSW public transport volumes and Transurban NSW traffic4
1.2
almost 60% compared to July 2019, while Transurban’s Sydney assets 1
excluding new assets have recovered to within ~10% across the same period 0.8
• Concerns regarding personal health and safety in confined public spaces may 0.6
be contributing to a preference for private transport over public transport 0.4
0.2
• On average, daily public transport use for surveyed people in Sydney, 0
Melbourne and Brisbane is expected to be 22% below pre-pandemic levels Jul-19 Jan-20 Jul-20 Jan-21 Jul-21 Jan-22
with daily private vehicle use 16% above pre-pandemic levels2 NSW public transport volume Transurban NSW (ex. new assets) traffic
Permanent and total shift away from workplace unlikely Workday traffic trends across the Australian markets show a return to
the CBD
• Flexible work arrangements offered by employers include varied start/finish Sydney, Melbourne and Brisbane CBD Office occupancy as a percentage of pre-
times, varied leave options, condensed work week and job sharing corridor weekday car traffic5 COVID-19 levels by CBD (cumulative)6
20
Million trips / transactions
200%
• Around 87% of recent survey respondents expect to do most of their work
back in their workplace2, with employees having previously reported increased 150%
16
collaboration and a separation between home and work as key reasons to get
100%
back to the office3
12 50%
0%
8 Sep-20 Mar-21 Sep-21 Mar-22
Sep-20 Mar-21 Sep-21 Mar-22 Melbourne CBD Sydney CBD Brisbane CBD
1. Transport for NSW Open Data – Monthly Opal trip count by mode. 4. Excluding new assets M8/M5 East (opened/commenced tolling on 5 July 2020) and NorthConnex (opened on 31 October 2020).
2. Independent survey commissioned by Transurban of more than 5,000 Australians, Americans and Canadians, reported in Transurban’s 5. Includes Transurban assets more exposed to CBD commuter traffic in Sydney (LCT, CCT, ED), Melbourne (CityLink) and Brisbane (Clem7,
Industry Report on Urban Mobility Trends, February 2022. Legacy Way and GBB) for illustrative purposes.
3. Transurban’s Industry Report on Urban Mobility Trends - February 2021 and August 2020. 6. Property Council of Australia - Office Occupancy survey.Capital management approach
Cash flow growth Long-term growth in Funding risk mitigation Balance sheet strength
underpinned Free Cash to fund and diversification provides optionality for
by essential distributions investment in new
infrastructure opportunities
Balancing growth in distributions over time and investment in new opportunities to increase long-term valueOpportunity pipeline
Long term investment horizon and pipeline of opportunities in core markets enables Transurban to take a disciplined approach
in growing the portfolio
REGION POTENTIAL OPPORTUNITIES1 NEXT 5 YEARS 5+ YEARS
Brisbane
Sydney Western Harbour Tunnel and Sydney Harbour Tunnel potential monetisation
M6 potential monetisation (formerly known as F6 extension)
Melbourne
Sydney Beaches Link potential monetisation
Melbourne North East Link potential monetisation
Brisbane Gateway Motorway widening
Logan Motorway widening
Broader network enhancements including in relation to Brisbane 20322
North America Phase 1 of Maryland Express Lanes Project
Montreal
Capital Beltway Accord
Greater
Washington
Express Lanes enhancements and/or extensions
Area
Future traditional toll road and Express Lanes acquisition opportunities
Maryland Express Lanes Project future phases
Future opportunities in Quebec
1. No assurance can be given that these potential opportunities will eventuate on the timetable outlined or at all, or that Transurban will be able to participate in them. Transurban's ability to participate in any future projects or acquisitions
will be subject to, among other things, applicable government processes and the receipt of relevant regulatory approvals.
2. Transurban is not a sponsor of the Olympic Games, any Olympic Committees or teams.Project updates
M7-M12 Integration Project— M7-M12 Integration Project—new • Delivering value for government, Fredericksburg
overview and update connections for Western Sydney community and business. Creating road Extension
transport solutions for government that update
• M7 is a ~39km, four lane motorway • Transurban expects the M7-M12 to
provide a critical link for Western Sydney to
between the M5 West at Prestons to deliver a range of benefits to all Contract
key areas of commerce and leisure
the M2 at Baulkam Hills stakeholders by supporting growth in adjustment
Western Sydney. This is enabled by • Benefitting local business. Working with agreed with D&C
• Proposal to widen the M7 from four to establishing a direct connection from local suppliers to support job creation contractor on the
six lanes, including integrating the M7 the future Western Sydney Airport via through the construction phase Fredericksburg
into the future M12 through a new M12 to key freight precincts, CBD, Port • Continued support from investment Extension Project
M7/M12 interchange Botany and Sydney Airport partners. Continued collaboration with resulting in an
• Currently in Stage 2 of the NSW • Time savings. Customers are expected to long-term investment partners expected immaterial cost
Government’s Unsolicited Proposal save at least over four million hours of to deliver value for all stakeholders adjustment to
Process and remains subject to travel time per year following completion of Transurban and
assessment by the NSW Government the M7 widening1
Timelines revised
• M7 widening and M7/M12 interchange anticipated
• Supporting growth in Western Sydney. opening date of
Enhanced productivity on a key freight expected to take around three years to
complete late 2023
route with faster and safer road travel will
likely support future growth in Western • Anticipate tendering process for D&C
Sydney contractor to commence in 2022
• Capability to deliver. Transurban has the • Work on the M12 Motorway is
expertise and capability to deliver the anticipated to start in 2022 and
widening and new interchange, along with expected to be completed prior to the
integrating traffic flow from the future M12 Western Sydney International opening in
into the M7 and broader Sydney assets 2026
1. Economic analysis prepared by AECOM.Supporting distribution growth Continued Balance sheet capacity Inflation benefit Delivering momentum in internally to fund with near-term distributions traffic growth existing near-term interest rate growth expected growth opportunities protection
Glossary and notes
Tolling escalation
MOTORWAY                        ESCALATION                                                                            MOTORWAY                         ESCALATION

M2                              Tolls escalate quarterly by the greater of quarterly CPI or 1%                                                         Tolls escalate quarterly by an equivalent of 4.25% per annum to 30
                                                                                                                      West Gate Tunnel1
                                                                                                                                                       June 2029 and quarterly CPI thereafter
LCT                             Class A tolls escalate quarterly by quarterly CPI. Class A tolls cannot
                                be lowered as a result of deflation. Class B tolls escalate quarterly by                                               Tolls escalate annually by Brisbane CPI. The toll cannot be lowered as
                                                                                                                      Logan Motorway
                                                                                                                                                       a result of deflation
                                the greater of quarterly CPI or 1%

CCT                             Tolls escalate quarterly by quarterly CPI. The toll cannot be lowered as                                               Tolls escalate annually by Brisbane CPI. The toll cannot be lowered as
                                                                                                                      Gateway Motorway
                                a result of deflation                                                                                                  a result of deflation

ED                              Tolls escalate quarterly by the greater of a weighted sum of quarterly                                                 Tolls escalate annually by Brisbane CPI. The toll cannot be lowered as
                                                                                                                      Clem7
                                AWE and quarterly CPI or 1%                                                                                            a result of deflation

M5 West                         Tolls escalate quarterly by quarterly Sydney CPI. The toll cannot be                                                   Tolls escalate annually by Brisbane CPI. The toll cannot be lowered as
                                                                                                                      Go Between Bridge
                                lowered as a result of deflation                                                                                       a result of deflation

M7                              Tolls escalate or de-escalate quarterly by quarterly CPI                                                               Tolls escalate annually by Brisbane CPI. The toll cannot be lowered as
                                                                                                                      Legacy Way
                                                                                                                                                       a result of deflation
NorthConnex                     Tolls escalate quarterly by the greater of quarterly CPI or 1%                                                         Tolls escalate annually by Brisbane CPI. The toll cannot be lowered as
                                                                                                                      AirportlinkM7
                                                                                                                                                       a result of deflation
M4                              Tolls escalate annually by the greater of CPI or 4% to December 2040;
                                the greater of CPI or 0% per annum to concession end
                                                                                                                      95 Express Lanes2                Dynamic, uncapped
M8 and M5 East                  Tolls escalate annually by the greater of CPI or 4% to December 2040;
                                the greater of CPI or 0% per annum to concession end
                                                                                                                      495 Express Lanes3               Dynamic, uncapped
M4-M5 Link and Rozelle          Tolls escalate annually by the greater of CPI or 4% to December 2040;
Interchange1                    the greater of CPI or 0% per annum to concession end
                                                                                                                                                       Tolls escalate annually at Canadian CPI. Additional toll escalation
CityLink                        Tolls escalate quarterly by an equivalent of 4.25% per annum to 30                    A25                              applies when peak traffic volumes (for peak tolls) or total daily traffic
                                June 2029 and quarterly CPI thereafter                                                                                 volumes (for off-peak tolls) reach pre-determined thresholds

1. Assets currently under construction.
2. 95 Express Lanes concession includes the 395 Express Lanes and the Fredericksburg Extension (currently under construction).
3. 495 Express Lanes concession includes the 495 Express Lanes Northern Extension project, for which a binding proposal with the Virginia government has been accepted, with commercial close reached 1H22. Data relates to operational
   lanes only.
Near-term interest rate protection notes Footnotes to slide 10 (Supporting distribution growth) 2. Based on 1H22 proportional toll revenue by asset excluding Roam Tolling and Tollaust revenue. 3. CPI linked category includes assets where toll prices increase at CPI or at the greater of CPI or a fixed percentage. Fixed at 4.25% (until 2029) category includes CityLink, where tolls escalate quarterly by an equivalent of 4.25% per annum to 30 June 2029 and quarterly CPI thereafter, which cannot be lowered as a result of deflation. Dynamic category includes the 95 Express Lanes and 495 Express Lanes, where toll price increases are dynamic and uncapped. 4. Illustrative interest rate impact calculation assumes the weighted average cost of AUD debt (proportional drawn debt exclusive of letters of credit). 5. Illustrative CPI revenue impact calculation is based on FY21 proportional toll revenue and traffic mix (which may vary in the future) and shows the estimated incremental revenue from a 1% increase in CPI (as appropriate to each asset) relative to the annualised CPI for each asset in the June 2021 quarter. The analysis assumes that the CPI increase occurs annually on 1 July each year and excludes assets that have dynamic pricing, as well as Roam Tolling and Tollaust revenue.
Glossary
TERM               DEFINITION                                                                                     TERM            DEFINITION
95                 95 Express Lanes                                                                               E-WAY           M5 West retail tolling brand
395                395 Express Lanes                                                                              FFO             Funds From Operations
495                495 Express Lanes                                                                              FFO/DEBT        Based on S&P methodology. FFO is calculated as statutory EBITDA (where EBITDA equals
1H/2H              First or second half of a financial year (unless specified otherwise)                                          revenue minus operating expenses, net of maintenance provision) plus dividends from
A25                A25 toll road                                                                                                  investments; minus interest paid, tax paid, and stock compensation expense. Debt is
                                                                                                                                  calculated as statutory drawn debt net of cash, foreign currency hedging and other liquid
AASB               Australian Accounting Standards Board
                                                                                                                                  investments
ACN                Australian Company Number                                                                                      FFO/Debt calculation methodologies may be subject to adjustments in future periods
ADT                Average Daily Traffic. ADT is calculated by dividing the total number of trips on each asset   FREDEX          95 Express Lanes Fredericksburg Extension project
                   (transactions on CityLink) by the number of days in the period. For new assets, the count of
                                                                                                                  FREE CASH/FCF   Free Cash is the primary measure used to assess the cash performance of the Group.
                   days begins at the commencement of tolling
AFSL               Australian Financial Services Licence
                                                                                                                  FX              Foreign Exchange
AMTN               Australian Medium Term Note
                                                                                                                  FY              Financial year 1 July to 30 June
ARSN               Australian Registered Scheme Number
                                                                                                                  GBB             Go Between Bridge
ASX                Australian Securities Exchange
                                                                                                                  GHG             Greenhouse Gas
AUD                Australian Dollars
                                                                                                                  GRI             Global Reporting Initiative
AWE                Average Weekly Earnings
                                                                                                                  GWA             Greater Washington Area meaning Northern Virginia, Washington DC, areas of Maryland
CAD                Canadian Dollars                                                                                               and the surrounding metropolitan area
CAPITAL RELEASES   Capital Releases refer to the injection of debt into Transurban assets as assets mature,       HCV             Heavy Commercial Vehicle
                   optimising balance sheets
                                                                                                                  HOT             High Occupancy Toll
CCT                Cross City Tunnel
                                                                                                                  HOV             High Occupancy Vehicle
CHF                Swiss Franc
                                                                                                                  HPFV            High Productivity Freight Vehicle
COVID-19           Coronavirus disease 2019
                                                                                                                  HSE             Health, Safety and Environment
CPI                Consumer Price Index. Refers to Australian CPI unless otherwise stated
                                                                                                                  LEP             Logan Enhancement Project
CPP INVESTMENTS    Canada Pension Plan Investments
                                                                                                                  LCT             Lane Cove Tunnel
CPS                Cents per stapled security
                                                                                                                  LCV             Light Commercial Vehicle
D&A                Depreciation and Amortisation
                                                                                                                  LINKT           Transurban’s retail tolling brand
D&C                Design and Construct
                                                                                                                  M&E             Mechanical and electrical
DC                 District of Columbia, United States of America
                                                                                                                  M2              Hills M2
EBITDA             Earnings Before Interest, Tax, Depreciation and Amortisation
                                                                                                                  M4              New M4
ED                 Eastern Distributor
                                                                                                                  M4-M5           M4-M5 Link
EMTN               Euro Medium Term Note
                                                                                                                  M5 WEST         M5 West motorway
ESG                Environmental, Social and Governance
                                                                                                                  M7              Westlink M7
EUR                Euros
                                                                                                                  M8              M8 (previously the New M5)
Glossary
TERM DEFINITION TERM DEFINITION
MD Maryland, United States of America SLN Shareholder Loan Note. An interest bearing shareholder loan
MDOT Maryland Department of Transportation SPV Special Purpose Vehicle
MTQ Ministère des Transports du Québec
STATE WORKS The capital contribution for WestConnex Stage 3A to be provided by Transport for New
N.M. Not meaningful CONTRIBUTION South Wales. This is separate to the NSW Government’s 49% share of the equity funding
N/A Not applicable commitment for WestConnex Stage 3A
NA North America STP/STP JV Sydney Transport Partners Joint Venture
NCX NorthConnex TAWREED Tawreed Investments Limited. A wholly owned subsidiary of Abu Dhabi Investment
NEURA Neuroscience Research Australia Authority
NEXT Project NEXT – 495 Northern Extension TBM Tunnel Boring Machine
NOK Norwegian Krone TCFD Task Force on Climate-related Financial Disclosures
NPAT and NPBT Net Profit After Tax and Net Profit Before Tax TFNSW Transport for New South Wales is the government agency responsible for transport
NSW New South Wales, Australia infrastructure and transport services in New South Wales. Roads and Maritime Services
NWRG NorthWestern Roads Group (RMS) was dissolved in December 2019 with all functions transferring to TfNSW
O&M Operations and Maintenance TIFIA Transportation Infrastructure Finance and Innovation Act
OTHER REVENUE Other revenue includes management fee revenue, roaming fee revenue and advertising TOLL REVENUE Toll revenue includes revenue from customers, specifically tolls, service and fee revenue
revenue and is recognised at the point in time the service is provided. Additionally, other TOLLAUST Service provider including O&M and retail services to NSW assets
revenue includes tolling services provided to third parties for which revenue is recognised TQ Transurban Queensland
over the period the service is provided. It also includes compensation received from third TRANSURBAN Transurban Chesapeake owns 100% of the entities that developed, built, financed and now
parties for a loss of toll revenue due to delays with construction completion, which is CHESAPEAKE (TC) operate and maintain the 95 Express Lanes (including the Fredericksburg Extension which
recognised when it is reasonably assured it will be collected. is under construction), 395 Express Lanes and 495 Express Lanes. Transurban has a 50%
PAB Private Activity Bond interest in Transurban Chesapeake
PP Private Placement UN SDGs/SDGs United Nations Sustainable Development Goals
PPA Power Purchase Agreement UNDERLYING EBITDA EBITDA excluding significant items
PPP Public Private Partnership US/USA United States of America
QLD Queensland, Australia USPP US Private Placement
RICI Road Injury Crash Index. Serious road injury (an individual transported from, or receives VA Virginia, United States of America
medical treatment, at scene) crashes per 100 million vehicle km travelled VDOT Virginia Department of Transportation
RIFR Recordable Injury Frequency Rate VIC Victoria, Australia
RUC Road user charging VTIB Virginia Transportation Infrastructure Bank
S&P Standard and Poor’s WCX WestConnex
SAAS Software as a Service
WGF West Gate Freeway
SASB Sustainability Accounting Standards Board
WGT/WGTP West Gate Tunnel/West Gate Tunnel Project
SEQ South East Queensland
SERVICE AND FEE Service and fee revenue includes customer administration charges and enforcement
REVENUE recoveriesYou can also read