MAIZE VALUE CHAIN ANALYSIS - Kenya Agricultural Value Chain Enterprises (USAID-KAVES) August 2015
←
→
Page content transcription
If your browser does not render page correctly, please read the page content below
Kenya Agricultural Value Chain Enterprises (USAID-KAVES)

 MAIZE VALUE CHAIN ANALYSIS
                      August 2015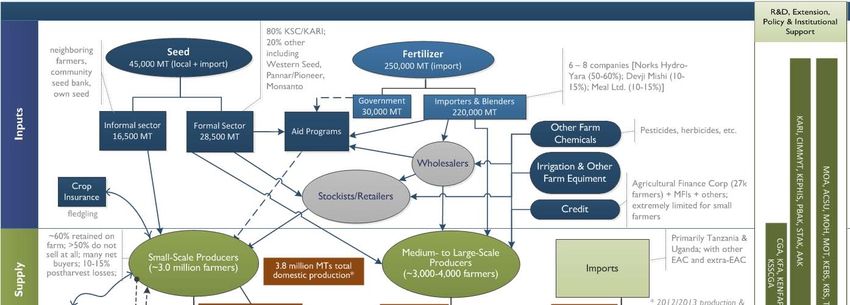
USAID-KAVES Maize Value Chain Analysis

September 2014

This publication was Inc. for review by the United States Agency for International Development.

           Fintrac Inc.
           www.fintrac.com
           info@fintrac.com

           US Virgin Islands
           3077 Kronprindsens Gade 72
           St. Thomas, USVI 00802
           Tel: (340) 776-7600
           Fax: (340) 776-7601

           Washington, DC
           1400 16th Street, NW
           Suite 400
           Washington DC 20036
           Tel: (202) 462-8475
           Fax: (202) 462-8478

           USAID-KAVES
           Karen Office Park
           3rd Floor Baobab, Suite H
           Langata, Road, Karen, Nairobi

           Prepared by Fintrac Inc.                                                               ii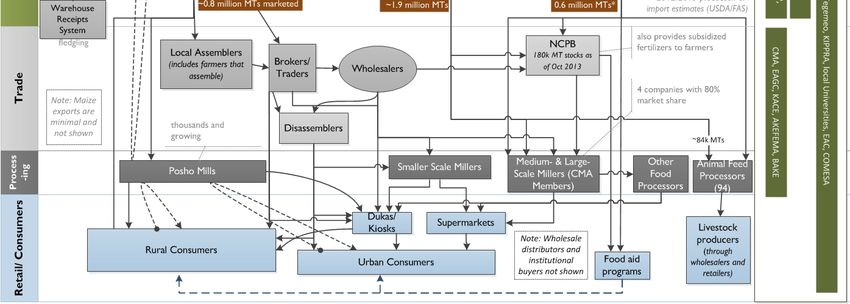
USAID-KAVES Maize Value Chain Analysis
FOREWORD
The goal of the Kenya Agricultural Value Chain Enterprises (USAID-KAVES) project is to increase the productivity
and incomes of smallholders and other actors along targeted agriculture value chains, thereby enhancing food
security and improving nutrition.
This report is one of a series of detailed value chain analyses covering five value chains (maize, dairy, mango,
Irish potato, and French (green) beans conducted by USAID-KAVES to identify critical constraints/gaps and
prioritize high-return program interventions that will contribute to the program’s core objectives of:
Increasing the competitiveness of selected agricultural value chains to increase incomes, mitigate food
insecurity, improve nutrition, and increase the incomes of the rural poor;
Fostering innovation and adaptive technologies and techniques that improve nutritional outcomes for rural
households, sustainably reduce chronic under-nutrition, and increase household consumption of nutrition-
dense foods; and
Increasing the capacity of local organizations to sustainably undertake value chain work.
While drawing upon the extensive body of existing research on targeted Kenyan valued chains, USAID-KAVES’
analyzes further, builds on and updates those findings with primary data obtained through field surveys and
interviews with value chain participants.
Prepared by Fintrac Inc. iii
USAID-KAVES Maize Value Chain Analysis

CONTENT
Executive Summary_____________________________________________________________________ 1

1. Introduction and Background _________________________________________________________ 6
    Introduction ___________________________________________________________________ 6
    Methodology __________________________________________________________________ 6
    Lessons learned From Past USAID Interventions _________________________________________ 7
2. Consumption and Demand Analysis ____________________________________________________ 9
    2.1 National Demand Estimation ____________________________________________________ 9
    2.2 Estimated Impact of Animal Feeds Industry on Demand ________________________________ 15
    2.4 Characteristics and Requirements of Principal Buyers__________________________________ 16
    2.5 Summary of Findings _________________________________________________________ 18
3. Supply Analysis and Production Potential ______________________________________________ 19
    3.1 Production Trends and Projections _______________________________________________ 19
    3.2 Key Drivers of Production and Supply _____________________________________________ 19
         3.2.1 Area Expansion _________________________________________________________________________ 19
         3.2.2. Climatic Variability and On-farm Yields ________________________________________________________ 20
         3.2.3 Postharvest Handling and Management Losses __________________________________________________ 21
         3.2.4 Production Seasonality and Price Trends _______________________________________________________ 22
         3.2.5 Pest and Disease Outbreaks ________________________________________________________________ 24
         3.2.6 Trade Patterns __________________________________________________________________________ 24
    3.4 Supply Projections ___________________________________________________________ 26
    3.5 Supply Constraints and Threats __________________________________________________ 29
         3.5.1 Productivity Constraints ____________________________________________________________________ 29
         3.5.2 Farm Size______________________________________________________________________________ 29
         3.5.3 Climate Variability and Change ______________________________________________________________ 30
         3.5.4 Postharvest Handling Constraints ____________________________________________________________ 30
    3.6 Summary of Findings _________________________________________________________ 30
4. The Maize Value Chain ______________________________________________________________ 32
    4.1 Input suppliers ______________________________________________________________ 34
         4.1.1 Seeds Suppliers _________________________________________________________________________ 34
         4.1.2 Fertilizer Suppliers _______________________________________________________________________ 36
         4.1.3 Provision of Mechanical Equipment and Services _________________________________________________ 39
         4.1.4 Other Farm Inputs _______________________________________________________________________ 40
         4.1.5 Input Use and Effect on Productivity __________________________________________________________ 40
         4.1.6 Input Affordability ________________________________________________________________________ 43
    4.2 Farmers __________________________________________________________________ 44
         4.2.1 Smallholder Farmers ______________________________________________________________________ 44
         4.2.2 Medium-Scale Farmers ____________________________________________________________________ 44
         4.2.3 Large-Scale Farmers ______________________________________________________________________ 44
    4.3 Marketing Actors ____________________________________________________________ 45
         4.3.1 Small-Scale Assemblers ____________________________________________________________________ 45
         4.3.2 Wholesalers ____________________________________________________________________________ 46
         4.3.3 Warehousing and Storage Service Providers ____________________________________________________ 46
         4.3.4 Transporters____________________________________________________________________________ 47
    4.4 Processors ________________________________________________________________                             47
    4.5 Retailers __________________________________________________________________                            48
    4.6 Summary of Findings _________________________________________________________                           48
5. Margins Analysis ____________________________________________________________________                        50
    5.1 Farmers __________________________________________________________________                              50
         5.1.1 Farmer Gross Margins ____________________________________________________________________ 50
         5.1.2 Economic Viability of Maize Production ________________________________________________________ 51

Prepared by Fintrac Inc.                                                                                         iv
USAID-KAVES Maize Value Chain Analysis
5.2 Village Assemblers ___________________________________________________________ 54
5.3 Wholesalers________________________________________________________________ 54
5.4 Retailers __________________________________________________________________ 55
5.5 Millers ____________________________________________________________________ 55
5.6 Summary of Findings _________________________________________________________ 56
6. Business Enabling Environment _______________________________________________________ 58
6.1 Supporting Organizations and Institutional Actors ____________________________________ 58
6.1.1 Research, Extension and Information Institutions _________________________________________________ 58
6.1.2 Financial Service Providers__________________________________________________________________ 59
6.1.3 County Governments _____________________________________________________________________ 60
6.2 Regulatory and Policy Environment _______________________________________________ 61
6.2.1 Policy Regime ___________________________________________________________________________ 61
6.2.2 Policy Intervention ________________________________________________________________________ 62
6.2.3 Grades and Standards ____________________________________________________________________ 63
6.2.4 Trade Policy ____________________________________________________________________________ 64
6.2.5 Price Controls and Taxation ________________________________________________________________ 65
6.3 Infrastructure ______________________________________________________________ 65
6.3.1 Transport Infrastructure ___________________________________________________________________ 65
6.3.2 Electricity ______________________________________________________________________________ 66
6.3.3 Rural Market Facilities ____________________________________________________________________ 66
6.3.4 Irrigation Infrastructure ____________________________________________________________________ 67
7. USAID-KAVES UPGRADING INTERVENTIONS ______________________________________ 68
Traders slow to adopt new business models __________________________________________________ 69
Side selling __________________________________________________________________________ 69
Availability of capital ___________________________________________________________________ 69
Lack of volume to justify investments _______________________________________________________ 69
Cost of systems _______________________________________________________________________ 69
New technology _______________________________________________________________________ 69
Lack of competition between suppliers ______________________________________________________ 69
No price/quality incentives _______________________________________________________________ 69
Cost of equipment _____________________________________________________________________ 69
ANNEX I: REFERENCES _______________________________________________________________ 70
ANNEX II: LIST OF ACRONYMS _______________________________________________________ 74
Prepared by Fintrac Inc. v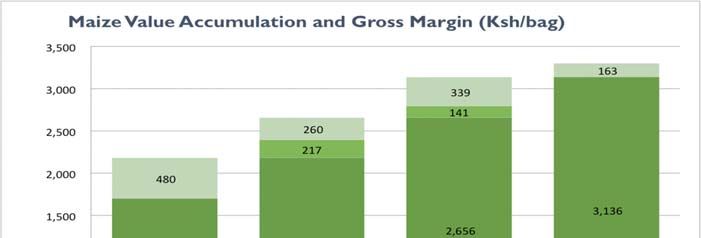
USAID-KAVES Maize Value Chain Analysis                                                    September 2014

EXECUTIVE SUMMARY
Maize is critical to food security in Kenya and, as the most widely consumed and produced staple crop,
is central to household and national income. However, yields have declined from 2.2 metric tons (MT)
per hectare (ha) in the 1990s to 1.74 MT in 2012, largely as a result of low and inappropriate soil
fertilization. Based on population and consumption growth trends, we expect an increase in aggregate
demand for maize from 3.21 million MT in 2013 to 3.48 million MT in 2022. If Kenya can increase
its average maize yield by just 15% (to 2MT/ha), it can more than meet expected national demand.
Above this yield a surplus will be generated for strategic storage and regional export. Since the country
has surpassed this threshold in the past, it should not be a difficult task for Kenya could attain maize
self-sufficiency if interventions that target farm productivity and postharvest losses are made in the
high maize potential counties. These interventions are likely to have high returns, not only at the
national supply level, but also through increased incomes for farmers and traders.

INTRODUCTION AND METHODOLOGY
The USAID-KAVES (hereafter “KAVES”) project prioritizes maize because of its major role as both a
food crop and a source of household income. Maize is Kenya’s main staple, providing 65 percent of
food crop caloric intake and 36 percent of total food caloric intake for both urban and rural households
(FAO Stat, 2009). The KAVES baseline survey in 2013 found that 97 percent of the estimated 3.5
million small-scale farmers include maize in their farming systems and a 2015 survey of KAVES
beneficiaries showed no significant change. Maize drives food security directly, while contributing to
livestock productivity and the commercialization of higher value, nutritious crops through crop
rotation. It offers the most accessible market and source of income for farmers through an extensive
network of local buyers of surplus maize. Maize is important to smallholder dairy and livestock farmers
for which the cost of feed is the main factor affecting their competitiveness.
Methodology
Since many studies in the past have analysed various aspects of the maize value chain, a preliminary
SWOT analysis was carried out in consultation with all members of the KAVES technical team; KAVES’
subcontractors; and other maize stakeholders, to determine existing gaps in the literature and identify
areas for further data collection and analysis. Based on this process, field surveys, focus group
discussions (FGDs) and key informant interviews were carried out to update existing information,
validate secondary sources, and provide primary data specific to the KAVES target areas. Relevant
secondary sources were reviewed and analysed and are discussed in this report with, in some cases,
alternative analyses and interpretations carried out. Primary data validation was collected through a
series of FGDs with farmers, traders and processors in selected target counties. Data collected as
part of the KAVES baseline survey of 1,800 farmers was analyzed and pooled with a second panel
survey selected from the first 16,000 farmers receiving KAVES’ support. Finally, smaller rapid market
surveys of traders were carried out to obtain specific information on costs and margins at different
levels of the value chain. The report was finally validated by a small group of leading researchers,
industry players and technocrats in November 2014. Minor updates were made in July 2015 to reflect
changes in data analysis and conditions.

SUMMARY OF KEY FINDINGS
Consumption and Demand Analysis
Per capita maize consumption shows a steady downward trend from about 90 kilograms in 2003 to
67.5 kilograms in 2012. It is projected to decline further to 56.3 kilograms in 2022, as consumers
increasingly substitute cooking bananas, Irish potato, sweet potato, and cassava in place of maize as a
result of increasing incomes, and higher urbanization rates. Population growth, however, is likely to lead
to modest (1% per year) overall increase in aggregate demand for maize (including human consumption,

Prepared by Fintrac Inc.
                                                                                                        1
USAID-KAVES Maize Value Chain Analysis                                                     September 2014

seed, animal feed, and other industrial uses). The Table below summarizes demand projections into
2022, and indicates an increase from 2.96 million metric tons in 2012 to 3.3 million tons in 2022. Urban
consumption will drive most of the growth in demand, as the total maize consumption by rural areas
is projected to grow at only 0.5 percent per year, and will be only 5 percent higher than its 2012 levels
(compared to 25 percent for urban areas).

 Consumption Segment                          2012              2017              2022          Growth
 Rural households                         2,253,409         2,319,370         2,358,002            0.5%
 Urban households                           514,174           569,957           641,270            2.2%
 Animal feeds industry                      122,373           176,179            233,556           6.7%
 Seed and other domestic uses                71,463            74,044            82,026            1.3%
 Total                                   2,961,419         3,139,550         3,314,854            1.1%

Supply Analysis and Production Potential
Average maize yields have declined from 2.2 MT/ha in the 1990s to 1.74 MT/ha in 2012. The 2013
USAID-KAVES baseline survey for the Feed the Future (FtF) target counties found an average yield of
1.8 MT/ha, ranging from 0.4 MT in Taita Taveta and Kericho to 3.33 MT in Nandi. While Kenyan yields
may be considered fair relative to other producers in sub-Saharan Africa, they are well below potential,
as illustrated by Kenya’s previous ability to achieve average yields above 2.0 MT/ha (a reasonable target
for rain-fed systems).

We portray two scenarios for the medium and long-term maize markets in Kenya, one optimistic and
one “status quo”. Under the optimistic scenario we assume yield increases of 1 percent per year,
continued expansion of planted area at 2.5 percent, and no significant weather or disease events. Under
this scenario we estimate that, by 2022, production area will grow to 2.7 million hectares, production
volume will expand to 5.23 million MT, total maize availability will increase to 3.9 million MT, creating
a surplus of 0.91 million MT. However, continued expansion of maize area at historical rates may be
overly optimistic given increasing land pressures and fragmentation. Without effective interventions at
national level, yield increases may also be overly optimistic, having stagnated in high potential counties
over the last seven years. Under the status quo scenario, production is still projected to meet domestic
food demand in 2022 but unlikely to contribute significantly to farmers’ incomes. Under the optimistic
and status quo scenarios, projected surpluses are thin enough that they can easily turn into deficits in
years with unfavorable weather conditions. Higher yield increases than 1 percent per year are required
to avoid this threat.

Our analysis shows that Kenya could attain maize self-sufficiency, without increasing planted area, with
modest increases in yields and reductions in postharvest losses. Interventions that target higher
farm yields and lower postharvest losses will have the highest returns, not only at the
national supply level, but also through increased income for farmers and traders. Going
forward, risks to Kenya’s rain-fed farming system will need to be proactively managed, addressing
technology and management gaps in the face of the growing challenges of shrinking farm size, increased
climatic variability and pressure from new pests and diseases.
The Maize Value Chain
Input Suppliers: Four importers control more than 85 percent of the fertilizer market. While Kenyan
fertilizer prices compare favorably against those of its East African neighbors, they are well above prices
in major exporting countries. Since only about 41 percent of all farmers use fertilizers consistently,
there is substantial room for market growth. Interventions could include soil nutrient amelioration and
fertilization; soil management education and training; soil testing and mapping; and customized fertilizer
blending to meet nutrient requirements of various soils.

Maize seeds range from local landraces to composites and hybrids. Local landraces are poorer yielding
but have an advantage of being suited to local conditions. Many farmers still plant their own saved seed,
or acquire seed directly from other farmers in their communities. Certified seed from registered
companies is readily available, with 90 percent locally produced and the balance imported. Whilst the

Prepared by Fintrac Inc.
                                                                                                          2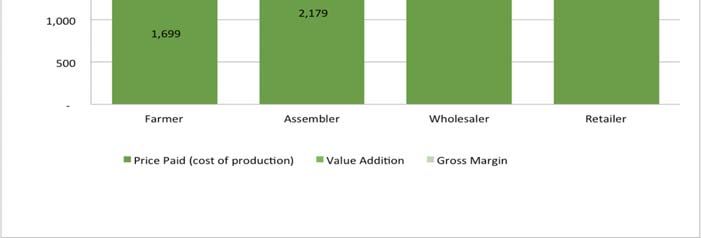
USAID-KAVES Maize Value Chain Analysis                                                    September 2014

yield potential of hybrid varieties is not in doubt, the USAID-KAVES baseline data showed that, in
practice, farmers are only achieving small differences in yields between hybrid and local seed when
combined with fertilizer. There is a clear need for KAVES to stress the importance of total
productivity packages in order for farmers to benefit from investment in improved seed.

Farmers: While more than 3.4 million smallholders plant maize, less than one-quarter of them actually
sell maize commercially and most are net buyers. Due to limited capital and lack of application of good
agriculture practices, many do not use productivity-enhancing inputs such as fertilizer and improved
seeds effectively. For those that do use inputs, their main sources are thousands of small-scale agro-
dealers and stockists located within rural market centers. Despite the efforts of previous projects,
smallholders face limited access to other important services such as mechanical tillage and harvesting
services, drying facilities, and safe storage technologies.

Marketing Actors: Maize marketing is a comple system consisting of thousands of small assemblers,
brokers, medium-scale wholesalers, large wholesalers, transporters, and retailers. Farmers primarily
sell in small quantities to small-scale, under-capitalized traders (assemblers), making aggregation time-
consuming and incurring substantial costs for assembly, handling, and grading. Rural-based traders suffer
from low margins, poor access to credit, and inadequate storage facilities. More efficient
aggregation by better-organized farmer groups can have an immediate impact on
margins and incomes at the village level.
Margins Analysis
By normal trading standards the average gross margins for post-farm value chain actors are not
excessive. The relatively small margins they achieve, coupled with high risks of wastage and other forms
of economic loss, leave little room for increasing farm gate prices by squeezing other actors’ margins.
These thin margins are indicative of the high cost of doing business along the maize value chain, starting
with the cost of assembly and transportation. The best opportunity for increasing producer
margins is by raising on-farm productivity, improving quality, reducing post-harvest losses,
and increasing market efficiencies of scale though well-managed aggregation systems.

Enabling Environment
Policy regime: Government intervention in the maize market to support domestic production and
manage imports is a common occurrence. There is a high level of political sensitivity to maize prices,
leading to attempts to support, suppress, or stabilize prices and often creating uncertainty within the
sector.

Prepared by Fintrac Inc.
                                                                                                        3
USAID-KAVES Maize Value Chain Analysis September 2014
Supporting Organizations & Institutional Actors: Public regulatory institutions are generally
weak because of insufficient resources and low credibility, so their ability to regulate and enforce quality
standards is limited. The legal institutions regulating rural commerce are ineffective and thus contribute
to market inefficiencies.
Devolution of decision-making: Emerging county agriculture policies and regulations will
significantly reshape Kenya’s agricultural policy regime in the future, changing local organization in the
areas of extension and education, supply of inputs, marketing policies, and production support
strategies. Intervention projects must be tailored to the unique needs of the devolved units and provide
capacity building to establish well-functioning governance structures at county level.
Infrastructure: The poor state of storage facilities and roads contributes to high production costs,
low sale prices, and economically significant post-harvest losses. The decline in investment in rural
infrastructure after trade liberalization, especially rural access roads, has increased the costs of maize
marketing players and limited the ability of smallholder farmers to negotiate better market prices.
UPGRADING INTERVENTIONS
Based on the information and analyses carried out, using data from both previous studies and surveys
carried out in 2013/14 by KAVES, three strategic components are recommended for the KAVES
approach to upgrading the maize subsector. These are supported by eight strategic interventions and
twenty upgrading objectives that will increase on-farm productivity, streamline and commercialize crop
aggregation, and improve storage and postharvest systems. Interventions have been selected that will
contribute directly to the goals and objectives of the project and are highly scalable through private
sector partnerships, with varying levels of public sector support. The interventions all rely heavily on
the mass adoption of new technologies, supported with specialist training and extension; new sources
of investment and credit to unlock value chain constraints; and engagement of private sector partners
for market development and sustainability.
Recommended Specific upgrading objectives Challenges Expected outcomes
intervention
Strategic component 1: Increase Productivity
1. Promote 1. Farmers will focus more on On-time availability of Increased yields
reduction in increasing yield per unit area by inputs Higher farm
average area of optimizing use of inputs Traditional low input incomes
maize planted 2. Greater use of irrigation for approach to maize Increase in county
per household mixed horticulture and maize production and national
by smallholder production systems Weak input distribution production
farmers systems
2. Support 3. Site specific soil analysis and Cost of extension to Increased yields
application of fertilizer selection reach 500,000 farmers Lower costs per
integrated soil 4. Precision application of fertilizer Finance for farmers to buy unit of production
fertility 5. Increased use of lime, blended inputs. Higher gross
management and customized fertilizer Finance for stockists to margins
systems (ISFM) supply inputs. Increase in total
Fertilizer suppliers lack production
capacity to serve
smallholder sector
Prepared by Fintrac Inc.
4USAID-KAVES Maize Value Chain Analysis September 2014
3. Increase 6. Distribution networks Capital cost of equipment Reduced cost of
availability of improved for small-scale Land size limits range of production
labor-saving technologies equipment that is cost- Higher yields
technologies 7. New rental businesses effective Higher margins
established at village level for Environmental objections Progressive farming
cultivation, harvesting, shelling to herbicide use systems
and drying equipment Youth participation
8. Widespread adoption of Less farm and more
herbicides and foliar feeds productive work for
women
4. Introduce 9. Greater adoption of location- Cost of hybrid seed Reduction in crop
precision specific varieties with optimum Weak outreach of seed failure
selection of yield potential suppliers Less financial risk
varieties 10. Increased availability and Regulatory bottlenecks Higher yield
adoption of “water efficient potential
maize for Africa” (WEMA)
varieties and striga resistant
seed
Strategic component II. Strengthen Marketing and Aggregation
5. Promote 11. Greater on-line access to Traders slow to adopt Increased smallholder
collective market information new business models bargaining power
marketing 12. Marketing agreements and Side selling Lower costs
contracts between farmer Higher quality
groups and buyers Less wastage
13. Well-managed collection
centers
6. Stimulate new 14. Minimal wastage Availability of capital More competitive
investments in 15. Cost and quality efficient Lack of volume to justify prices and quality
equipment and logistics investments Less wastage
facilities
Strategic component III. Reduce Postharvest Losses
7. Facilitate new 16. Cost-benefit analyses of on- Cost of systems Reduced value of
investments in farm and aggregated bulk New technology wastage
household and storage systems Lack of competition Increased availability of
commercial 17. Widespread adoption of cost- between suppliers maize at household
storage systems effective hermetic bags for level
household storage Safer products, better
18. Investment in silos and storage nutrition
structures by aggregators
8. Provide training 19. New grading systems No price/quality Higher quality grain
to raise quality introduced incentives Safer maize products
standards 20. Adoption of digital scales and Cost of equipment Higher net returns
moisture meters by aggregators
and traders
Prepared by Fintrac Inc.
5USAID-KAVES Maize Value Chain Analysis September 2014
1. INTRODUCTION AND BACKGROUND
INTRODUCTION
Maize is Kenya’s principal staple food crop,
providing substantial caloric intake to Justification for Maize as a USAID-KAVES
most urban and rural households. In 2012 Targeted Value Chain
an estimated 2.1 million hectares1 of
maize were planted and 97 percent of the Main staple crop that drives food security directly,
estimated 3.5 million small-scale farmers while also contributing to livestock productivity
across the country include it in their and the commercialization of higher value,
farming system (KAVES baseline survey nutritious crops through crop rotation.
2013, Tegemeo Institute, 2009). Maize High potential impact on household and national
accounts for nearly 20 percent of total incomes by increasing production, trading and
food expenditures among the poorest value due to high production (3.81) and
urban households2, therefore any factor distribution (8.33) multipliers.
that threatens maize production and Offers the most accessible market and source of
supply becomes a national food security income for many farmers through extensive
issue. For this and other reasons (see text network of existing local buyers of surplus maize.
box), maize was selected as a priority crop Likelihood of increasing smallholder competitive
for USAID-KAVES. advantage in the domestic market due to trending
higher global prices (with import parity prices
As background and a starting point, expected to continue to increase over the
Section 2 provides an analysis of domestic medium-term).
consumption and demand characteristics, Importance to dairy and livestock farmers for
and Section 3 examines production/trade which the cost of feed is the main factor affecting
trends and estimates future supply under their competitiveness.
various scenarios. Section 4 looks at the High potential maize zones located within Feed the
maize value chain in detail (highlighting key Future target counties, including opportunities for
actors, their interactions and critical particularly vulnerable households in marginal
constraints and gaps). Section 5 examines semi-arid (SA2) areas (e.g. newly available short-
gross margins along the value chain using cycle maize varieties along with low-cost water
primary data collected through field management techniques).
surveys, while Section 6 provides an Potential for integration with cash crops
overview of key constraints to the production (the most viable system for most
business-enabling environment (inclusive farmers in the target areas for agronomic,
of infrastructure and regulatory/policy marketing and food security reasons).
constraints). Based on the gaps, Promising emerging business models (e.g. contract
constraints and opportunities identified, farming and warehouse receipts) with potential to
Section 7 provides recommendations for make maize production and marketing systems
“upgrading interventions” along the value more efficient.
chain where USAID-KAVES is best placed Strong world-class partnership opportunities with
to stimulate increases in productivity and private-sector companies and national and
incomes. international maize research institutions based in
Kenya (i.e. valuable resources that can be utilized
METHODOLOGY to increase outreach and impact through
collaboration).
Because various aspects of the maize
value chain have been the subject of numerous other studies and analysis over the past decade, a
preliminary SWOT analysis was carried out in consultation with all members of the USAID-KAVES
technical team, subcontractor Farm Concern International (FCI) and other maize sector experts to
1 Ministry of Agriculture statistics
2 Similar data on food expenditures in rural areas was not available, but it is estimated to be higher than urban areas.
Prepared by Fintrac Inc.
6USAID-KAVES Maize Value Chain Analysis September 2014
determine the most critical gaps and constraints within the value chain and to identify areas where
further data collection, research, and analysis were needed to prioritize interventions. Based on this
initial SWOT analysis (see Table 1), field surveys, focus group discussions (FGDs), and key informant
interviews were carried out to update outdated information, validate secondary sources, and
particularly to obtain primary information specific to USAID-KAVES’ targeted geographical areas.
Sources: USAID-KAVES technical team, focus group discussions (FGDs) and key informant interviews (June 2013)
Table 1: Preliminary SWOT Analysis for Maize Production and Marketing
Strengths Weaknesses Opportunities Threats
Availability of subsidized High cost of inputs, Ready markets and Rapidly declining
fertilizer including fuel, fertilizer, substantial installed soil fertility
Availability of certified and seed milling capacity High and escalating
seeds Inefficient input and Value addition into other cost of inputs
Introduction of drought output markets products Unpredictable
resistant varieties Poor soil fertility Formation of producer weather patterns
Availability of fertile and management groups for better High prevalence of
productive land Price fluctuations and marketing (and pests and diseases
Favorable climatic delayed payment by aggregation) Aflatoxin
conditions (including buyers Climate change to open contamination
generally reliable rains) Inadequate storage new areas suitable for Adulterated seeds
Availability of ready facilities maize production (e.g. Increasing
markets with maize Weed and pest infestation high altitude) urbanization
being the primary staple Poor postharvest Potential export markets leading to loss of
food management in South Sudan and other farmland
Value chain with many Lack of heat and drought deficit areas in the Devolved policies
actors (and a very high resistant varieties COMESA region creating
multiplier effect) High cost of aggregation Introduction of nitrogen- unpredictable, less
and water-efficient seed favorable business
varieties environment
All relevant studies and data were reviewed and are discussed in this study, in some cases with
alternative analyses carried out and interpretations made. These are referenced throughout the study
and all sources are listed in Annex I. Primary validation data was collected by subcontractor FCI
through a series of FGDs with farmers, traders and processors in selected target counties. Data
collected as part of the USAID-KAVES baseline survey of 1,800 farmers was analyzed and pooled with
a second panel survey of farmers selected from the first 16,000 USAID-KAVES farmers receiving
support. Finally, a smaller survey of traders was carried out to obtain specific information on margins
at different levels of aggregation. The study was carried out between March and November 2013. All
the growth rates reported in this report use the Compounded Annual Growth Rate (CAGR) formula.
LESSONS LEARNED FROM PAST USAID INTERVENTIONS
USAID’s Kenya Maize Development Program (KMDP) was implemented from 2002–2010, providing
technical assistance to targeted smallholder maize farmers mainly in the high- and mid-potential maize
producing districts of Kenya‘s Western and Rift Valley provinces. It was designed to increase household
incomes for value chain actors by promoting increased awareness and involvement in every step of the
maize value chain. Five key lessons were learnt by KMDP that informed the design of USAID-KAVES
and will contribute to project implementation:
1. KMDP and other USAID-funded projects were successful in creating many new partnerships
between farmer groups and other actors in Kenya‘s maize value chain but the relatively low
value of maize as a cash crop was a disincentive for investment in inputs and adoption of
improved practices by many farmers with less than two acres of productive land.
2. Smallholder maize farming as it is commonly practiced in Kenya, as a low input-low output
system, is not sustainable over the long-term. The globalization of world markets and the
Prepared by Fintrac Inc.
7USAID-KAVES Maize Value Chain Analysis September 2014
liberalization of trade require development of new business models for efficient aggregation
and quality management that increase the competitiveness of small-scale producers.
3. KMDP successfully reached out to a large number of smallholder farmers but to transform the
three million maize producers in Kenya requires more investment and innovations to spread
change beyond the direct participants in projects. There are still many farmers in Kenya who
are in need of technical assistance.
4. Over the long term, smallholder maize farmers need to become more diversified and include
higher value crops in their farming systems to become economically viable.
5. KMDP subcontractor Farm Input Promotions Services Africa (FIPS) established a network of
demonstration plots for new maize varieties and fertilizer trials. These showed that maize
yields can increase significantly by focusing on soil fertility management, soil testing, liming, use
of hybrid seed and modern land preparation technologies. The introduction of mini-input packs
that smallholders can afford was particularly effective.
USAID supported One Acre Fund for a year in 2012-13, to implement the Asset-Based Financing
for Smallholder Farmers Project (ABFSF), building on the progress made in upgrading the maize
value chain by KMDP. ABFSF established a permanent revolving fund that increased smallholder
farmers’ access to finance through the provision of credit for high quality seed and fertilizer. In addition,
it linked farmers to seed and fertilizer firms; provided technical assistance through a network of trained
field officers; formed groups for aggregating surplus production. Ket lessons learnt were:
1. It is important to diversify the number of crops that are offered within the loan package.
2. Changing the planting behaviors of farmers is a challenge but opportunity exists through
training and messaging on crop diversification.
3. Farmer group leaders can make good extension agents at community levels and there is a need
to continue building the capacity of support field staff and group leaders to ensure sustainability
and greater outreach
4. Grain storage commitment mechanisms, such as group storage pledges and ‘bag tags’, can
increase local storage, boost harvest profitability, and potentially reduce the effect of the
hunger season on farm families.
The USAID-Kenya Agricultural Research Institute (KARI) Partnership for Increased
Rural Household Incomes (2004-2013), built on previous collaborations from 1967. Under this
program, KARI researched a range of agricultural and natural resource management systems that
included the maize value chain. Specific lessons and results relevant to KAVES include:
1. A range of improved varieties were produced by KARI scientists for different ecological zones.
Research focused on mid-altitude and highland varieties that are resistant to three specific
problems: Grey Leaf Spot, Maize Streak Virus and Striga. However, the developed research
products have not been adopted on the scale needed to impact on national production.
2. With private sector partners, KARI is investing in commercial production and distribution of
its products and reaching out to stimulate demand from smallholder producers.
3. Researchers have linked low productivity to the long-term use of di-Ammonium Phosphate
(DAP) and Calcium Ammonium Nitrate (CAN), continuous cropping; soil erosion on sloping
lands; and poor water conservation practices.
Transferring these results and solutions to commercial practice is a continuous challenge for KARI and
provides immediate opportunities for USAID-KAVES that are included in priority interventions
recommended below in section 7. Interventions by other donors and GOK are also taken into account
in this study. In particular the DFID-funded activities of the African Agricultural Technology Foundation
on drought-tolerant and striga-resistant maize varieties and the work of FAO and Purdue University
on smallholder-scale, storage systems.
Prepared by Fintrac Inc.
8USAID-KAVES Maize Value Chain Analysis September 2014
2. CONSUMPTION AND DEMAND
ANALYSIS
This section examines how much demand is likely to increase in the next five to ten years.
We build consumption and demand scenarios to evaluate the future of the maize industry
in Kenya, including how changing food preferences (i.e. the increasing shift to
consumption of alternatives to maize) will affect the national outlook for the industry.
We use population statistics, urbanization rates, and per capita consumption trends to
project Kenya’s maize needs into 2022.
As Kenya’s population and economy grow and the level of urbanization increases, demand for maize
will increase both for human and animal consumption (the latter as feed for the expanding beef, dairy,
poultry, and pig industries). Kenya’s total population is currently estimated at 44 million and is growing
at approximately 2.7 percent annually, with urban population growing at a faster rate of 4.4 percent
per year compared to 2.2 percent in rural areas (WDI, 2014). To feed this population, maize supply
must keep pace with its growth and changing food preferences.
2.1 NATIONAL DEMAND ESTIMATION
Maize is the main staple food in Kenya, accounting for 65 percent of caloric intake from staple foods
and 36 percent of total caloric intake. Data on maize consumption is thin and have mixed quality. The
actual consumption per person is less understood, with most estimates assuming one 90-kg bag per
year. Kirimi et al. (2011) estimated Kenya’s average per capita consumption at 88 kilograms of maize
products per year, in the form of maize flour for ugali, grain for githeri/nyoyo (a mixture of maize and
beans or other pulses), mukimo (a mixture of maize, mashed potatoes and vegetables), and
steamed/roasted green maize.
Popular assumption is domestic demand for maize has Aggregate demand for maize will
consistently exceeded local production in recent years. New continue to increase although at a
data however show significant declining per capita consumption lower rate than population growth
of maize products, especially in urban areas. When we account due to decreasing per capita
for these declines and variations in consumption between the consumption, as consumers
rural and urban areas, the analysis in this report suggests the increasingly diversify to
official estimates may be overestimating Kenya’s actual substitutes.
consumption requirements.
The analysis in this section uses several sources of secondary data to arrive at an estimate of the
national per capita consumption. Tegemeo Institute Household Panel Surveys since 1995 are the only
sources of historical consumption data in urban areas; the latest series is 2009. The data is published
in: Muyanga, Jayne, Argwings-Kodhek, & Ariga (2005), using 1995 and 2003 data; Musyoka, Lagat, Ouma,
Wambua, & Gamba (2010), using 2003 data; and, Kamau, Olwande, & Githuku (2011), 2003 and 2009
data. The surveys show urban per capita maize consumption steadily declined between 1995 and 2009,
by about 3% per year. From an average consumption of 89.8kg per person in 1995, consumption
declined to 57.6kg in 2009 (see Table 2). Consequently, the 2009 average per capita maize consumption
in Nairobi was only 64 percent of its 1995 levels. The average declines were steepest among the lowest
40 percent households, at 4.5% and 3.4% per year in the lowest and lower quintiles, respectively. These
rates of decline however slowed in later series of the surveys (2003-2009), except for households in
the highest income quintile, where it significantly accelerated (5.9% per year); it increased at a
decreasing rate of 10 percent during the period (2.8%).
Reasons for the declining trend in maize consumption are less understood. Basic demand theory
however points to three possible explanations: i) maize is an inferior good, with less of it consumed as
average incomes rise; ii) maize is highly price elastic - both own price and cross price elasticities are
Prepared by Fintrac Inc.
9USAID-KAVES Maize Value Chain Analysis September 2014
greater than one, so price inflation drives consumers to reduce consumption levels and/or switch to
relatively cheaper alternatives; iii) increased substitution with alternatives that are considered healthier
and/or have become more available – increased dietary diversity. We use Table 2 and growth in per
capita income to test proposition (i), price trends to test (ii), and per capita consumption of maize
alternatives to test the third proposition.
Table 2: Annual Per Capita Maize Consumption in Nairobi, kilograms, 1995-2009
By Income Quintile
Year Average
Lowest 2 3 4* Highest
1995 107.4 100.7 94.8 83.6 69.4 89.8
2003 70.8 67.3 68.9 51.8 65.6 68.4
2009 56.4 62.4 61.2 57.6 45.6 57.6
CAGR (2003-2009) -3.7% -1.3% -2.0% 1.8% -5.9% -2.8%
CAGR (1995-2009) -4.5% -3.4% -3.1% -2.6% -3.0% -3.1%
Source: Muyanga et al. (2005); Kamau et al. (2011). * The only quintile showing increased consumption between 2003
and 2009. We suspect entry or typographical error in the 2003 data.
In urban areas, Muyanga et al. (2005), Musyoka et al. (2010), and Kamau et al. (2011) found maize
products are inferior goods whose consumption drops significantly with increases in average income.
Muyanga et al found an inverse relationship between maize consumption and household income, with
per capita consumption dropping by 7 percent as one moves from the lowest income quintile to the
highest quintile. Moreover, Musyoka et al. (2010) found income (expenditure) elasticity of demand for
maize and its products (posho and sifted flour) is less than one; a 1% increase in food expenditure
increases the expenditure on maize products by less than 1 percent, which means the share of maize
products in total food expenditure declines with income. This is confirmed in Muyanga et al., which
found the share of maize in staple carbohydrates consumption declined by 100 percent between the
poorest 20% households (43.8%) and the wealthiest 20 percent (22%).
Table 2 confirms the wealthiest 20% households consumed about 37 percent less maize per person
compared to the poorest 20% households in 2009. Kenya’s per capita incomes have however not
grown significantly enough to fully explain the 3 percent average annual decline in consumption. Over
the past decade (2004-2013), the national per capita income grew at an average 2 percent per annum
(probably higher in urban areas, but we lack data to support it). For every 1% increase income, maize
consumption is expected to decline by 0.4 percent (Musyoka et al.); this translates to 0.8% decline per
year and a total of 5 percent over six years, which is significantly less than the 16.8 percent decline
recorded between 2003 and 2009.
The second possible reason for declining per capita consumption of maize is price inflation. This effect
can manifest itself in average prices rising beyond the levels most consumers can afford (reduced
consumption) and/or relative maize prices rising to make its alternatives more attractive to consumers
(substitution). The former is explained by the effect of own price elasticity for maize products, while
the latter functions through cross price elasticity and should lead to greater substitution into other
foods. Musyoka et al. found own price elasticity of maize products in urban areas was minus 1.85 (sifted
flour) and minus 1.74 (maize), with much higher elasticity’s among the non-poor households. The
authors also found substantial substitution effect for maize, in both the poor and non-poor households,
with the latter the most likely to substitute maize when prices increase. Demand for maize products
is therefore highly sensitive to marginal price changes. We analyze price trends, including nominal, real
and relative prices to test this proposition.
Nominal wholesale maize prices have increased significantly since 2005, more than doubling over the
period, 2005-2013, as noted Table 3. The national average wholesale price increased at 9.4 percent per
year during this period. During the period between 2009 and 2013, average prices grew at 7 percent
per year, then accelerated to 32.6 percent per year during 2011-2013. In contrast, the Table further
Prepared by Fintrac Inc.
10USAID-KAVES Maize Value Chain Analysis September 2014
shows average real prices stayed flat during the period 2005-2013, and declined by 2.9 percent per
year between 2009 and 2013.
Table 3: Change in Average Wholesale Maize Prices, 2005-2013
CPI Nominal Price Real Price
(Feb. 2009=100) (KSh/90-kg bag) (KSh/90-kg bag)
January 2005 70.48 1,461 2,073
January 2009 97.55 2,292 2,349
January 2011 110.57 1,706 1,543
Dececember 2013 143.85 3,000 2,086
CAGR (2005-2013) 9.4% 0.1%
CAGR (2009-2013) 7.0% -2.9%
CAGR (2011-2013) 32.6% 16.3%
Source: USAID-KAVES calculations from MOALF market data
Maize prices have either kept up with or trailed inflation rates. The recent sharp increases follow a
general spike in international maize prices between 2010 and 2012, and a 2.2 percent decline in maize
production in 2011. The monthly real prices in 2013 were however lower than those in 2012 and the
5-year averages (Fig. 1). For price inflation to explain declining per capita maize consumption, real
prices needed to rise 10 percent over the period 2003-2009.
Figure 1: Real Prices for Maize
5yr Real Avg 2012 Real 2013 Real
2,700
Ksh/90kg bag
2,200
1,700
November
January
February
May
April
July
September
October
December
June
August
March
Source: KAVES calculations from MOA/KNBS
An analysis of relative prices for maize against its closest alternatives, such as rice, cooking bananas and
potatoes further clarifies the price effect. Fig. 2 shows maize price ratios against selected substitutes
between 2002 and 2012, with maize price in the numerator. It is evident that, except for cooking
bananas, changes in maize prices have trailed those of substitutes. Since 2004, average prices of rice
and potatoes changed faster than that of maize, thereby making them relatively more expensive to
maize. In contrast, cooking bananas became relatively much cheaper than maize and potatoes since
2002. Changing relative prices of maize can thus explain only a small part of the decline in its per capita
consumption. Part of the reason for relative price effect is the increased availability and acceptance of
alternatives to maize, with cooking bananas, Irish and sweet potatoes, cassava and sorghum/millet
emerging as important substitutes. These substitution trends are discussed next.
Prepared by Fintrac Inc.
11USAID-KAVES Maize Value Chain Analysis September 2014
Figure 2: Retail Price Ratios for Maize, Bananas, and Potatoes, 2002-2012
1.10
1.00
0.90
0.80
0.70
0.60
0.50
0.40
0.30
2002 2003 2004 2005 2006 2007 2008 2009 2010 2011 2012
Potatoes-Bananas PR Maize-Rice PR Maize-Bananas PR Maize-Potatoes PR
Source: KAVES calculations from KNBS (2013)
Finally, consumption shares of alternatives staples are growing due to increased availability and
accessibility to a diversified basket of foods. The role of maize has therefore diminished in most
households’ diets. Part of this is attributable to increased awareness about health and nutrition benefits
of alternative foods, especially among higher income households, the preference for more convenient
foods, and changes in relative maize prices. The share of maize in staples consumption of urban
households has declined precipitously since 1995. As a share of total staples consumed, maize products
constituted 58 percent in 1995, 45 percent in 2003, and 33 percent in 2009 (Muyanga et al.; Kamau et
al). The largest declines occurred among the middle 20% and the wealthiest 20%. In an expanded list of
staples that includes potatoes, cassava, and millet/sorghum, the share of maize was only 23 percent in
2009 (Kamau et al, p. 18). Additionally, whereas maize products contributed 42 percent and 32 percent
of the total staples consumption expenditure in 1995 and 2003, respectively, its share further declined
to 29 percent in 2009. Musyoka et al (2010) found consumption rates for maize products in Nairobi
were much lower than those of alternatives, such as wheat products and rice, with the wealthiest
households consuming less maize products and more wheat and rice products than their poorest
counterparts.
The aforementioned consumption differences are captured in Tegemeo’s panel survey results contained
in Table 4. There have been large increases in the per capita consumption of alternatives to maize since
1995; most notable is the sharp rise in per capita consumption of cooking bananas across all income
groups, compared to flat or modest increases for rice and wheat products. Confirming the relative
price trends captured in Fig. 2, cooking bananas has emerged as the leading alternative to maize and
other sources of starchy food in urban areas. Its consumption increased by 333 percent between 1995
and 2003, and by an additional 201 percent in the period, 2003-2009. Overall, the urban per capita
consumption of bananas in 2009 was 13 times higher than in 1995, increasing its share in total staple
consumption from 2.6 percent in 1995, 11 percent in 2003, to 30 percent in 2009. When the list of
staples is expanded to include potatoes (Irish/sweet), cassava, sorghum and millet, cooking bananas
contributed 20.6 percent of the total consumption in 2009, with per capita consumption nearing parity
with potatoes (Irish/sweet).
It is also notable that the correlation between the consumption of bananas and income levels is weak,
and it is most popular among households in the middle-income group (Muyanga et al.). As average per
Prepared by Fintrac Inc.
12USAID-KAVES Maize Value Chain Analysis September 2014
capita incomes increase toward the middle-income quintiles, the consumption of cooking bananas is
expected to rise. The switch to bananas therefore appears decisive and provides the most plausible
explanation of the declining maize consumption per capita. If the trends shown in Table 4 continued,
our analysis estimates that cooking bananas had overtaken potatoes and maize as the leading staple
food in urban areas by 2012.
Table 4: Annual Per Capita Consumption of Maize Alternatives in Nairobi, kilograms,
1995-2009
By Income Quintile
Food item Year Average
Lowest 2 3 4 Highest
1995 4.1 1.4 2.8 7.6 3.4 4.0
2003 9.0 14.3 22.6 21.7 18.2 17.2
Cooking bananas 2009 25.2 33.6 52.8 67.2 87.6 51.6
CAGR (1995-2009) 26% 48% 45% 31% 50% 38%
CAGR (2003-2009) 19% 15% 15% 21% 30% 20%
1995 25.3 31.9 44.8 42.7 48.7 39.2
2003 27.0 37.0 41.6 57.1 67.0 46.0
Wheat products 2009 23 32 50 54 70 46
CAGR (1995-2009) -1% 0% 1% 3% 5% 2%
CAGR (2003-2009) -3% -2% 3% -1% 1% 0%
1995 17.4 18.7 21.8 22.3 25.6 21.4
2003 13.9 18.6 16.6 21.5 24.1 19.0
Rice 2009 12 18 23 26 26 20
CAGR (1995-2009) -5% 0% 1% 2% 0% -1%
CAGR (2003-2009) -2% -1% 6% 3% 1% 1%
Source: KAVES calculations from Muyanga et al. (2005) & Kamau et al. (2011). * No comparable data for
Irish/sweet potatoes in 2003.
In conclusion, therefore, maize consumption trend is conforming to its “inferior good” properties and
succumbing to intense pressures from increasingly accessible substitutes. As incomes increase, the rate
of urbanization rises, and bananas, potatoes, and other starchy foods become more available and
acceptable to consumers, we expect the per capita consumption of maize to decline even further in
the next ten years. The decline will occur at a decreasing rate of 10 percent in the near term and
possibly higher rates in the medium term, as consumers approach what would be considered optimal
consumption levels and maize substitutes become relatively more expensive than presently.
No consumption data are available for other urban and rural areas. This analysis therefore derives
comparable consumption data for these areas from the Nairobi data. By its cosmopolitan nature
Nairobi is fairly representative of other major urban centers. We adjusted the Nairobi consumption
numbers for other urban areas using proportions of the population in each income class, following the
2013 Kenya National Bureau of Statistics (KNBS) and Society for International Development (SID)
report on inequality (henceforth, KNBS/SID, 2013). A further assumption is that per capita maize
consumption in the rural areas should not deviate significantly from those of urban lower income
classes.
We estimate the poorest 40% and middle 20% households in rural areas consume about 1.3 times the
average per capita of their counterparts in urban areas, and the rural upper 40% households consume
Prepared by Fintrac Inc.
13USAID-KAVES Maize Value Chain Analysis September 2014
1.2 times their urban equivalents. These multipliers account for relatively higher proportion of
whole/posho meal in rural maize diets than urban areas. Table 5 contains the population shares and
estimated consumption by income quintiles for 2009. After adjustments, the average per capita
consumption in 2009 was 55.2 kg in urban areas and 75.4 kg in rural areas. These estimates form the
basis of the consumption and demand analysis in this report.
Table 5: Population Shares and Estimated Per Capita Maize Consumption in 2009
Item Income Quintiles
Total
Lowest 2 3 4 Highest
Nairobi 0.6 19.2 15.3 20.2 44.7 100
Population
Share (%)
All Urban 2.6 28.7 15.3 19.3 34.1 100
Rural 44.6 21.1 20.5 12.2 1.5 100
Nairobi 56.4 62.4 61.2 57.6 45.6 54.0
Consumption
Per Capita
Estimated
(kg/year)
All urban 56.4 62.4 61.2 57.6 45.6 55.2
Rural 73.3 81.1 79.6 69.1 54.7 75.4
Consumption
Rural-urban 1.3 1.3 1.3 1.2 1.2 1.36
Multiplier
Source: KAVES calculations from KNBS/SID (2013) & Kamau et al. (2011)
We have used the aforementioned survey results and various demand parameters and assumptions to
estimate per capita consumption and project demand over the next five to ten years. The parameters
include disaggregated rural and urban projections for population, urbanization, and per capita
consumption. The analysis estimates per capita consumption in urban areas declines at an average
compounded rate of 2.6 percent per year until 2017, then at a decreasing rate (10 percent slower) to
2022. In the rural areas, per capita consumption declines at 1.6 percent per year until 2017, and
thereafter slows down by 10 percent. These translate to compounded annual rates of decline of 3
percent in urban areas and 1.9 percent in rural areas over the ten years under analysis.
Table 6 contains the consumption estimates and projections from 2009 to 2022. We estimate annual
per capita consumption was 67.5 kilograms in 2012, consisting of 70.7 kg in rural areas and 50 kg in
urban areas. This is projected to further decline to 61.3 kilograms by 2017 and 56.3 kilograms by 2022
due primarily to increasing incomes, higher urbanization rates, and higher demand for substitute food
items. Our estimates are generally in line with the Kenya Economic Survey 2014 Food Balance Sheets,
which reported the national per capita maize consumption at 64.9 kg in 2012 and 63.1 kg in 2013
(KNBS, 2014).3
The overall projections indicate national per capita consumption will decline at an annual average rate
of 1.8 percent over the ten-year period to 2022. Even with population increase, this will lead to only a
modest overall increase in aggregate consumption/demand of maize of approximately 1 percent per
year, from 2.77 million MT (30.7 million bags) in 2012 to 2.89 million MT (32.1 million bags) and 3.0
million MT (33.3 million bags) in 2017 and 2022, respectively.4 Urban consumption will drive most of
the growth in maize demand, as the total maize consumption by rural areas is projected to grow at
3 The main difference is the KNBS quantities are derived from supply data and assume waste levels (30%) higher than that
used in this report.
4 These estimates and projections are largely in line with The World Bank (2013) estimates placing Kenya’s maize
requirements at 32-34 million bags per year.
Prepared by Fintrac Inc.
14You can also read